
Key Insights
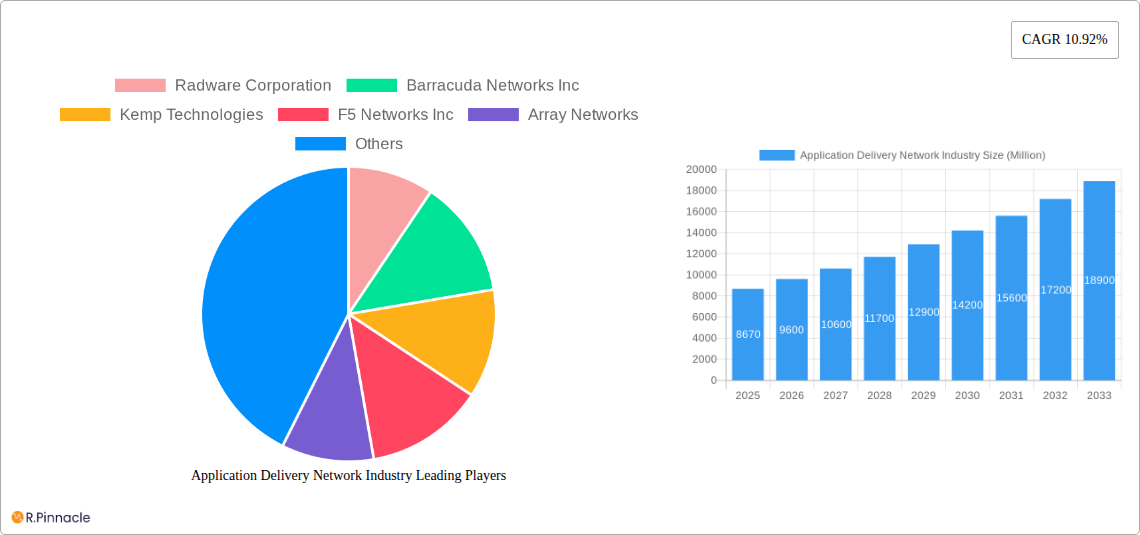
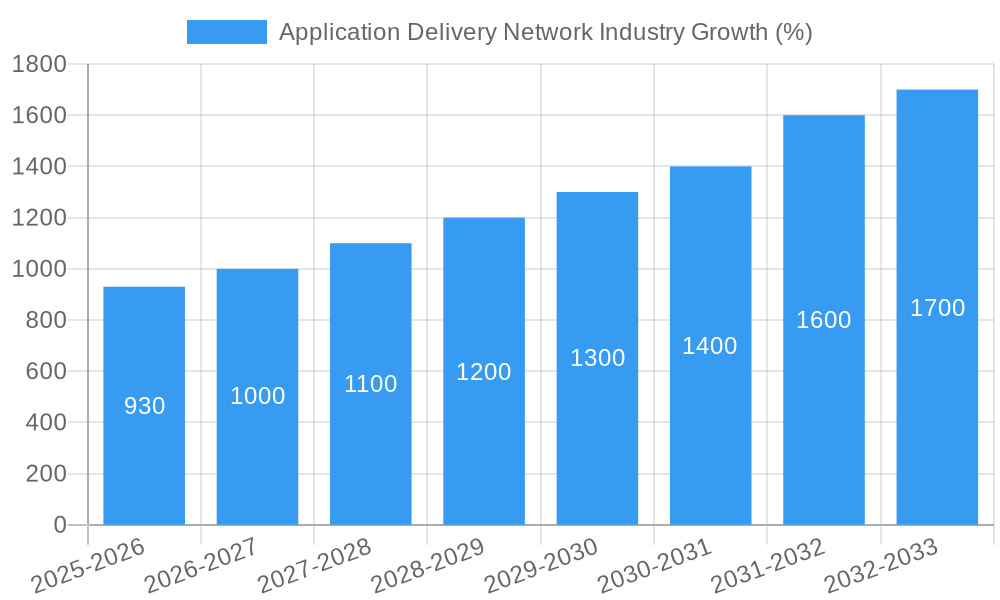
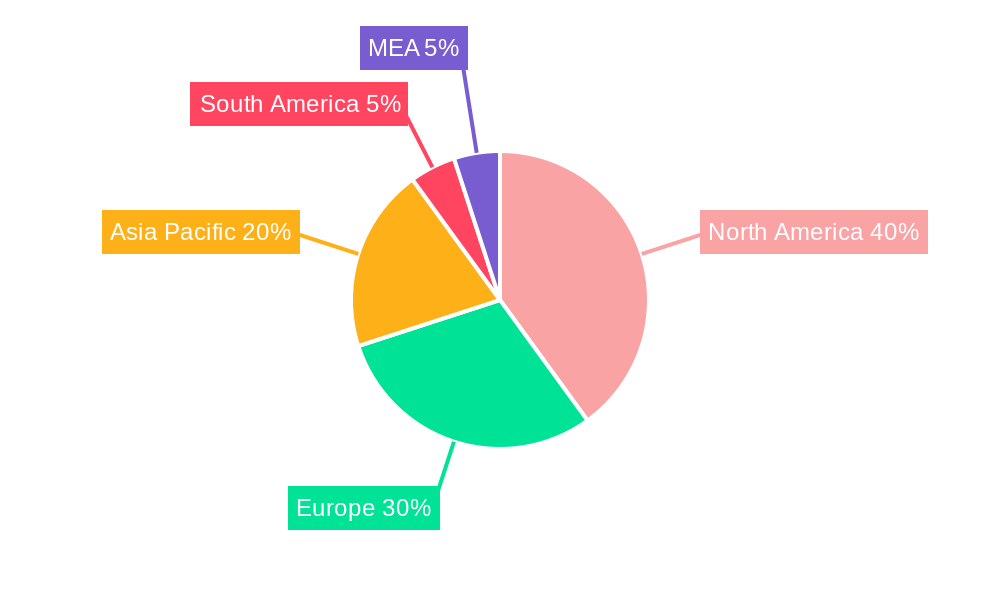
The Application Delivery Network (ADN) market is experiencing robust growth, projected to reach \$8.67 billion in 2025 and maintain a Compound Annual Growth Rate (CAGR) of 10.92% from 2025 to 2033. This expansion is fueled by several key factors. The increasing adoption of cloud computing and the rise of digital transformation initiatives across various industries are driving the demand for robust and scalable ADN solutions. Businesses are increasingly reliant on applications for core operations, making application performance and security paramount. The shift towards hybrid and multi-cloud environments further complicates application delivery, necessitating sophisticated ADN solutions to ensure seamless connectivity, optimal performance, and robust security across diverse platforms. Furthermore, the growing prevalence of sophisticated cyber threats underscores the critical need for advanced security features integrated within ADN platforms, thus boosting market growth. The market segmentation reveals a strong presence across various deployment types (on-premise and cloud), enterprise sizes (SMEs and large enterprises), and end-user verticals (BFSI, IT & Telecommunications, Healthcare, Government, Media & Entertainment). North America currently holds a significant market share, driven by early adoption of advanced technologies and a strong digital infrastructure. However, Asia-Pacific is expected to witness significant growth in the coming years due to increasing digitalization efforts and expanding internet penetration across several countries in the region.
The competitive landscape is characterized by a mix of established players and emerging vendors. Major players like Radware, Barracuda Networks, F5 Networks, and Cisco Systems are leveraging their extensive experience and established customer base to maintain their market positions. However, smaller, more agile companies are also innovating and offering specialized solutions, creating a dynamic and competitive market. Future growth will depend on continued innovation in areas such as artificial intelligence (AI)-powered application delivery, automation, and enhanced security features to address evolving cybersecurity threats and the complexities of hybrid and multi-cloud deployments. The focus will likely shift towards more integrated and comprehensive solutions that address the complete application lifecycle, from development and deployment to ongoing management and optimization.
Application Delivery Network (ADN) Industry Report: 2019-2033
This comprehensive report provides an in-depth analysis of the Application Delivery Network (ADN) industry, offering actionable insights for industry professionals, investors, and strategists. With a study period spanning 2019-2033, a base year of 2025, and a forecast period of 2025-2033, this report leverages extensive market research to provide a clear picture of the current landscape and future trajectory of the ADN market, projected to be worth xx Million by 2033.
Application Delivery Network Industry Market Structure & Innovation Trends
The Application Delivery Network (ADN) market is characterized by a mix of established players and emerging innovators. Market concentration is moderate, with several key players holding significant market share, while numerous smaller companies compete for niche segments. The market's innovation is driven by the need for improved application performance, security, and scalability in an increasingly complex digital landscape. Regulatory frameworks, particularly around data privacy and security, significantly influence ADN adoption and development. Product substitutes, such as Software-Defined Networking (SDN) solutions, present competitive challenges. The end-user demographics are diverse, spanning various industries and enterprise sizes, creating opportunities for specialized ADN solutions. M&A activities are frequent, with deal values in the hundreds of Millions, reflecting ongoing consolidation and expansion within the sector.
- Market Share (Estimated 2025): F5 Networks Inc. (xx%), Cisco Systems Inc. (xx%), Akamai Technologies (xx%), Radware Corporation (xx%), Others (xx%). These figures are estimations based on available data.
- M&A Deal Values (2019-2024): Total deal value estimated at xx Million. Specific deals are not included due to confidentiality restrictions.
Application Delivery Network Industry Market Dynamics & Trends
The ADN market is experiencing robust growth, driven by several factors. The increasing adoption of cloud computing, the proliferation of mobile devices, and the rise of Internet of Things (IoT) applications all contribute significantly to the demand for efficient and secure application delivery. Technological disruptions, such as the development of 5G networks and edge computing, are reshaping the ADN landscape, creating both opportunities and challenges. Consumer preferences for high-performance and secure online experiences fuel the market's expansion. The competitive dynamics are intense, with established players facing pressure from agile startups and innovative solutions. The market's Compound Annual Growth Rate (CAGR) is estimated to be xx% during the forecast period (2025-2033). Market penetration remains relatively low, indicating significant future growth potential, especially in emerging markets.
Dominant Regions & Segments in Application Delivery Network Industry
The North American region currently holds a dominant position in the ADN market, driven by a high concentration of technology companies, mature IT infrastructure, and strong demand for advanced application delivery solutions. However, Asia-Pacific is showing rapid growth.
- By Deployment Type: The cloud segment is experiencing the fastest growth, fueled by the widespread adoption of cloud-based applications and infrastructure.
- By Enterprise Size: Large enterprises are the primary consumers of ADN solutions due to their complex IT infrastructures and higher security requirements. SMEs are increasingly adopting ADN, though at a slower rate.
- By End-user Vertical: The BFSI, IT and Telecommunications, and Healthcare sectors are major consumers of ADN solutions, owing to their stringent security and performance requirements. Growth in other sectors like Government and Media & Entertainment is also substantial.
Key drivers vary by segment: economic growth, increased digital transformation initiatives, and robust IT spending are significant factors.
Application Delivery Network Industry Product Innovations
Recent innovations in ADNs focus on enhanced security features (e.g., DDoS mitigation, advanced threat protection), improved application performance optimization (e.g., AI-powered traffic management), and increased automation capabilities (e.g., orchestration and automation platforms). These innovations cater to the growing demands for secure and efficient application delivery in dynamic and complex environments. The market is seeing a shift towards cloud-native solutions, leveraging microservices architectures and containerization technologies.
Report Scope & Segmentation Analysis
This report segments the ADN market by deployment type (on-premise, cloud), enterprise size (SMEs, large enterprises), and end-user vertical (BFSI, IT and Telecommunications, Healthcare, Government, Media & Entertainment, Other). Each segment is analyzed based on historical data (2019-2024), current estimations (2025), and future projections (2025-2033), considering factors like growth rates, market size, and competitive intensity. The Cloud deployment type exhibits the highest growth projection. Large Enterprises dominate the market size. BFSI, IT & Telecommunications show the largest market share by end-user vertical.
Key Drivers of Application Delivery Network Industry Growth
Several factors are driving the growth of the ADN market. The increasing adoption of cloud computing, the rising demand for high-performance applications, and the growing concerns regarding application security are key contributors. The shift towards digital transformation across various industries is fueling the demand for efficient and reliable application delivery solutions. Government regulations promoting cybersecurity are also stimulating market growth.
Challenges in the Application Delivery Network Industry Sector
The ADN market faces several challenges, including the increasing complexity of application architectures, the need for skilled professionals to manage ADN solutions, and the constant evolution of cyber threats. Competitive pressures from emerging technologies and the potential for supply chain disruptions also pose challenges. The estimated cost of addressing these challenges is xx Million annually.
Emerging Opportunities in Application Delivery Network Industry
Significant opportunities exist in emerging markets, with increasing digitalization in developing economies driving demand for ADN solutions. The integration of artificial intelligence (AI) and machine learning (ML) into ADN platforms presents significant opportunities for improved performance and security. The expansion of edge computing is creating new opportunities for deploying ADN solutions closer to end-users.
Leading Players in the Application Delivery Network Industry Market
- Radware Corporation
- Barracuda Networks Inc
- Kemp Technologies
- F5 Networks Inc
- Array Networks
- Avi Networks (Vmware)
- Cisco Systems Inc
- Akamai Technologies
- A10 Networks Inc
- Broadcom Inc (Symantec Corporation)
- Citrix Systems Inc
Key Developments in Application Delivery Network Industry
- December 2022: Cisco Systems Inc. partnered with T-Mobile to launch the world's largest cloud-native converged core gateway, significantly improving network speed and latency.
- February 2023: Juniper Networks Inc. provided cloud-ready data center and AI-driven enterprise solutions to Green energy data centers, highlighting the importance of robust ADN solutions in modern data centers.
Future Outlook for Application Delivery Network Industry Market
The ADN market is poised for continued growth, driven by technological advancements, increasing digital transformation initiatives, and the growing need for secure and reliable application delivery. Strategic partnerships and acquisitions will continue to shape the market landscape, leading to further innovation and consolidation. The market is expected to witness a significant expansion in emerging markets and new applications, creating lucrative opportunities for industry players.
Application Delivery Network Industry Segmentation
-
1. Deployment Type
- 1.1. On-Premise
- 1.2. Cloud
-
2. Size of Enterprises
- 2.1. Small and Medium Enterprises (SMEs)
- 2.2. Large Enterprises
-
3. End-user Vertical
- 3.1. BFSI
- 3.2. IT and Telecommunications
- 3.3. Healthcare
- 3.4. Government
- 3.5. Media & Entertainment
- 3.6. Other End-user Verticals
Application Delivery Network Industry Segmentation By Geography
-
1. North America
- 1.1. United States
- 1.2. Canada
-
2. Europe
- 2.1. United Kingdom
- 2.2. Germany
- 2.3. France
- 2.4. Rest of Europe
-
3. Asia Pacific
- 3.1. China
- 3.2. India
- 3.3. Japan
- 3.4. Rest of Asia Pacific
- 4. Latin America
- 5. Middle East
Application Delivery Network Industry REPORT HIGHLIGHTS
| Aspects | Details |
|---|---|
| Study Period | 2019-2033 |
| Base Year | 2024 |
| Estimated Year | 2025 |
| Forecast Period | 2025-2033 |
| Historical Period | 2019-2024 |
| Growth Rate | CAGR of 10.92% from 2019-2033 |
| Segmentation |
|
Table of Contents
- 1. Introduction
- 1.1. Research Scope
- 1.2. Market Segmentation
- 1.3. Research Methodology
- 1.4. Definitions and Assumptions
- 2. Executive Summary
- 2.1. Introduction
- 3. Market Dynamics
- 3.1. Introduction
- 3.2. Market Drivers
- 3.2.1. Rising Need for Application Performance Scaling and Security; Growing Adoption of Cloud Based Applications; Increasing BYOD Trend
- 3.3. Market Restrains
- 3.3.1. Security Issues Associated with Cloud
- 3.4. Market Trends
- 3.4.1. Cloud-based Delivery to Witness the Highest Growth
- 4. Market Factor Analysis
- 4.1. Porters Five Forces
- 4.2. Supply/Value Chain
- 4.3. PESTEL analysis
- 4.4. Market Entropy
- 4.5. Patent/Trademark Analysis
- 5. Global Application Delivery Network Industry Analysis, Insights and Forecast, 2019-2031
- 5.1. Market Analysis, Insights and Forecast - by Deployment Type
- 5.1.1. On-Premise
- 5.1.2. Cloud
- 5.2. Market Analysis, Insights and Forecast - by Size of Enterprises
- 5.2.1. Small and Medium Enterprises (SMEs)
- 5.2.2. Large Enterprises
- 5.3. Market Analysis, Insights and Forecast - by End-user Vertical
- 5.3.1. BFSI
- 5.3.2. IT and Telecommunications
- 5.3.3. Healthcare
- 5.3.4. Government
- 5.3.5. Media & Entertainment
- 5.3.6. Other End-user Verticals
- 5.4. Market Analysis, Insights and Forecast - by Region
- 5.4.1. North America
- 5.4.2. Europe
- 5.4.3. Asia Pacific
- 5.4.4. Latin America
- 5.4.5. Middle East
- 5.1. Market Analysis, Insights and Forecast - by Deployment Type
- 6. North America Application Delivery Network Industry Analysis, Insights and Forecast, 2019-2031
- 6.1. Market Analysis, Insights and Forecast - by Deployment Type
- 6.1.1. On-Premise
- 6.1.2. Cloud
- 6.2. Market Analysis, Insights and Forecast - by Size of Enterprises
- 6.2.1. Small and Medium Enterprises (SMEs)
- 6.2.2. Large Enterprises
- 6.3. Market Analysis, Insights and Forecast - by End-user Vertical
- 6.3.1. BFSI
- 6.3.2. IT and Telecommunications
- 6.3.3. Healthcare
- 6.3.4. Government
- 6.3.5. Media & Entertainment
- 6.3.6. Other End-user Verticals
- 6.1. Market Analysis, Insights and Forecast - by Deployment Type
- 7. Europe Application Delivery Network Industry Analysis, Insights and Forecast, 2019-2031
- 7.1. Market Analysis, Insights and Forecast - by Deployment Type
- 7.1.1. On-Premise
- 7.1.2. Cloud
- 7.2. Market Analysis, Insights and Forecast - by Size of Enterprises
- 7.2.1. Small and Medium Enterprises (SMEs)
- 7.2.2. Large Enterprises
- 7.3. Market Analysis, Insights and Forecast - by End-user Vertical
- 7.3.1. BFSI
- 7.3.2. IT and Telecommunications
- 7.3.3. Healthcare
- 7.3.4. Government
- 7.3.5. Media & Entertainment
- 7.3.6. Other End-user Verticals
- 7.1. Market Analysis, Insights and Forecast - by Deployment Type
- 8. Asia Pacific Application Delivery Network Industry Analysis, Insights and Forecast, 2019-2031
- 8.1. Market Analysis, Insights and Forecast - by Deployment Type
- 8.1.1. On-Premise
- 8.1.2. Cloud
- 8.2. Market Analysis, Insights and Forecast - by Size of Enterprises
- 8.2.1. Small and Medium Enterprises (SMEs)
- 8.2.2. Large Enterprises
- 8.3. Market Analysis, Insights and Forecast - by End-user Vertical
- 8.3.1. BFSI
- 8.3.2. IT and Telecommunications
- 8.3.3. Healthcare
- 8.3.4. Government
- 8.3.5. Media & Entertainment
- 8.3.6. Other End-user Verticals
- 8.1. Market Analysis, Insights and Forecast - by Deployment Type
- 9. Latin America Application Delivery Network Industry Analysis, Insights and Forecast, 2019-2031
- 9.1. Market Analysis, Insights and Forecast - by Deployment Type
- 9.1.1. On-Premise
- 9.1.2. Cloud
- 9.2. Market Analysis, Insights and Forecast - by Size of Enterprises
- 9.2.1. Small and Medium Enterprises (SMEs)
- 9.2.2. Large Enterprises
- 9.3. Market Analysis, Insights and Forecast - by End-user Vertical
- 9.3.1. BFSI
- 9.3.2. IT and Telecommunications
- 9.3.3. Healthcare
- 9.3.4. Government
- 9.3.5. Media & Entertainment
- 9.3.6. Other End-user Verticals
- 9.1. Market Analysis, Insights and Forecast - by Deployment Type
- 10. Middle East Application Delivery Network Industry Analysis, Insights and Forecast, 2019-2031
- 10.1. Market Analysis, Insights and Forecast - by Deployment Type
- 10.1.1. On-Premise
- 10.1.2. Cloud
- 10.2. Market Analysis, Insights and Forecast - by Size of Enterprises
- 10.2.1. Small and Medium Enterprises (SMEs)
- 10.2.2. Large Enterprises
- 10.3. Market Analysis, Insights and Forecast - by End-user Vertical
- 10.3.1. BFSI
- 10.3.2. IT and Telecommunications
- 10.3.3. Healthcare
- 10.3.4. Government
- 10.3.5. Media & Entertainment
- 10.3.6. Other End-user Verticals
- 10.1. Market Analysis, Insights and Forecast - by Deployment Type
- 11. North America Application Delivery Network Industry Analysis, Insights and Forecast, 2019-2031
- 11.1. Market Analysis, Insights and Forecast - By Country/Sub-region
- 11.1.1 United States
- 11.1.2 Canada
- 11.1.3 Mexico
- 12. Europe Application Delivery Network Industry Analysis, Insights and Forecast, 2019-2031
- 12.1. Market Analysis, Insights and Forecast - By Country/Sub-region
- 12.1.1 Germany
- 12.1.2 United Kingdom
- 12.1.3 France
- 12.1.4 Spain
- 12.1.5 Italy
- 12.1.6 Spain
- 12.1.7 Belgium
- 12.1.8 Netherland
- 12.1.9 Nordics
- 12.1.10 Rest of Europe
- 13. Asia Pacific Application Delivery Network Industry Analysis, Insights and Forecast, 2019-2031
- 13.1. Market Analysis, Insights and Forecast - By Country/Sub-region
- 13.1.1 China
- 13.1.2 Japan
- 13.1.3 India
- 13.1.4 South Korea
- 13.1.5 Southeast Asia
- 13.1.6 Australia
- 13.1.7 Indonesia
- 13.1.8 Phillipes
- 13.1.9 Singapore
- 13.1.10 Thailandc
- 13.1.11 Rest of Asia Pacific
- 14. South America Application Delivery Network Industry Analysis, Insights and Forecast, 2019-2031
- 14.1. Market Analysis, Insights and Forecast - By Country/Sub-region
- 14.1.1 Brazil
- 14.1.2 Argentina
- 14.1.3 Peru
- 14.1.4 Chile
- 14.1.5 Colombia
- 14.1.6 Ecuador
- 14.1.7 Venezuela
- 14.1.8 Rest of South America
- 15. North America Application Delivery Network Industry Analysis, Insights and Forecast, 2019-2031
- 15.1. Market Analysis, Insights and Forecast - By Country/Sub-region
- 15.1.1 United States
- 15.1.2 Canada
- 15.1.3 Mexico
- 16. MEA Application Delivery Network Industry Analysis, Insights and Forecast, 2019-2031
- 16.1. Market Analysis, Insights and Forecast - By Country/Sub-region
- 16.1.1 United Arab Emirates
- 16.1.2 Saudi Arabia
- 16.1.3 South Africa
- 16.1.4 Rest of Middle East and Africa
- 17. Competitive Analysis
- 17.1. Global Market Share Analysis 2024
- 17.2. Company Profiles
- 17.2.1 Radware Corporation
- 17.2.1.1. Overview
- 17.2.1.2. Products
- 17.2.1.3. SWOT Analysis
- 17.2.1.4. Recent Developments
- 17.2.1.5. Financials (Based on Availability)
- 17.2.2 Barracuda Networks Inc
- 17.2.2.1. Overview
- 17.2.2.2. Products
- 17.2.2.3. SWOT Analysis
- 17.2.2.4. Recent Developments
- 17.2.2.5. Financials (Based on Availability)
- 17.2.3 Kemp Technologies
- 17.2.3.1. Overview
- 17.2.3.2. Products
- 17.2.3.3. SWOT Analysis
- 17.2.3.4. Recent Developments
- 17.2.3.5. Financials (Based on Availability)
- 17.2.4 F5 Networks Inc
- 17.2.4.1. Overview
- 17.2.4.2. Products
- 17.2.4.3. SWOT Analysis
- 17.2.4.4. Recent Developments
- 17.2.4.5. Financials (Based on Availability)
- 17.2.5 Array Networks
- 17.2.5.1. Overview
- 17.2.5.2. Products
- 17.2.5.3. SWOT Analysis
- 17.2.5.4. Recent Developments
- 17.2.5.5. Financials (Based on Availability)
- 17.2.6 Avi Networks (Vmware)
- 17.2.6.1. Overview
- 17.2.6.2. Products
- 17.2.6.3. SWOT Analysis
- 17.2.6.4. Recent Developments
- 17.2.6.5. Financials (Based on Availability)
- 17.2.7 Cisco Systems Inc
- 17.2.7.1. Overview
- 17.2.7.2. Products
- 17.2.7.3. SWOT Analysis
- 17.2.7.4. Recent Developments
- 17.2.7.5. Financials (Based on Availability)
- 17.2.8 Akamai Technologies
- 17.2.8.1. Overview
- 17.2.8.2. Products
- 17.2.8.3. SWOT Analysis
- 17.2.8.4. Recent Developments
- 17.2.8.5. Financials (Based on Availability)
- 17.2.9 A10 Networks Inc
- 17.2.9.1. Overview
- 17.2.9.2. Products
- 17.2.9.3. SWOT Analysis
- 17.2.9.4. Recent Developments
- 17.2.9.5. Financials (Based on Availability)
- 17.2.10 Broadcom Inc (Symantec Corporation)
- 17.2.10.1. Overview
- 17.2.10.2. Products
- 17.2.10.3. SWOT Analysis
- 17.2.10.4. Recent Developments
- 17.2.10.5. Financials (Based on Availability)
- 17.2.11 Citrix Systems Inc
- 17.2.11.1. Overview
- 17.2.11.2. Products
- 17.2.11.3. SWOT Analysis
- 17.2.11.4. Recent Developments
- 17.2.11.5. Financials (Based on Availability)
- 17.2.1 Radware Corporation
List of Figures
- Figure 1: Global Application Delivery Network Industry Revenue Breakdown (Million, %) by Region 2024 & 2032
- Figure 2: Global Application Delivery Network Industry Volume Breakdown (K Unit, %) by Region 2024 & 2032
- Figure 3: North America Application Delivery Network Industry Revenue (Million), by Country 2024 & 2032
- Figure 4: North America Application Delivery Network Industry Volume (K Unit), by Country 2024 & 2032
- Figure 5: North America Application Delivery Network Industry Revenue Share (%), by Country 2024 & 2032
- Figure 6: North America Application Delivery Network Industry Volume Share (%), by Country 2024 & 2032
- Figure 7: Europe Application Delivery Network Industry Revenue (Million), by Country 2024 & 2032
- Figure 8: Europe Application Delivery Network Industry Volume (K Unit), by Country 2024 & 2032
- Figure 9: Europe Application Delivery Network Industry Revenue Share (%), by Country 2024 & 2032
- Figure 10: Europe Application Delivery Network Industry Volume Share (%), by Country 2024 & 2032
- Figure 11: Asia Pacific Application Delivery Network Industry Revenue (Million), by Country 2024 & 2032
- Figure 12: Asia Pacific Application Delivery Network Industry Volume (K Unit), by Country 2024 & 2032
- Figure 13: Asia Pacific Application Delivery Network Industry Revenue Share (%), by Country 2024 & 2032
- Figure 14: Asia Pacific Application Delivery Network Industry Volume Share (%), by Country 2024 & 2032
- Figure 15: South America Application Delivery Network Industry Revenue (Million), by Country 2024 & 2032
- Figure 16: South America Application Delivery Network Industry Volume (K Unit), by Country 2024 & 2032
- Figure 17: South America Application Delivery Network Industry Revenue Share (%), by Country 2024 & 2032
- Figure 18: South America Application Delivery Network Industry Volume Share (%), by Country 2024 & 2032
- Figure 19: North America Application Delivery Network Industry Revenue (Million), by Country 2024 & 2032
- Figure 20: North America Application Delivery Network Industry Volume (K Unit), by Country 2024 & 2032
- Figure 21: North America Application Delivery Network Industry Revenue Share (%), by Country 2024 & 2032
- Figure 22: North America Application Delivery Network Industry Volume Share (%), by Country 2024 & 2032
- Figure 23: MEA Application Delivery Network Industry Revenue (Million), by Country 2024 & 2032
- Figure 24: MEA Application Delivery Network Industry Volume (K Unit), by Country 2024 & 2032
- Figure 25: MEA Application Delivery Network Industry Revenue Share (%), by Country 2024 & 2032
- Figure 26: MEA Application Delivery Network Industry Volume Share (%), by Country 2024 & 2032
- Figure 27: North America Application Delivery Network Industry Revenue (Million), by Deployment Type 2024 & 2032
- Figure 28: North America Application Delivery Network Industry Volume (K Unit), by Deployment Type 2024 & 2032
- Figure 29: North America Application Delivery Network Industry Revenue Share (%), by Deployment Type 2024 & 2032
- Figure 30: North America Application Delivery Network Industry Volume Share (%), by Deployment Type 2024 & 2032
- Figure 31: North America Application Delivery Network Industry Revenue (Million), by Size of Enterprises 2024 & 2032
- Figure 32: North America Application Delivery Network Industry Volume (K Unit), by Size of Enterprises 2024 & 2032
- Figure 33: North America Application Delivery Network Industry Revenue Share (%), by Size of Enterprises 2024 & 2032
- Figure 34: North America Application Delivery Network Industry Volume Share (%), by Size of Enterprises 2024 & 2032
- Figure 35: North America Application Delivery Network Industry Revenue (Million), by End-user Vertical 2024 & 2032
- Figure 36: North America Application Delivery Network Industry Volume (K Unit), by End-user Vertical 2024 & 2032
- Figure 37: North America Application Delivery Network Industry Revenue Share (%), by End-user Vertical 2024 & 2032
- Figure 38: North America Application Delivery Network Industry Volume Share (%), by End-user Vertical 2024 & 2032
- Figure 39: North America Application Delivery Network Industry Revenue (Million), by Country 2024 & 2032
- Figure 40: North America Application Delivery Network Industry Volume (K Unit), by Country 2024 & 2032
- Figure 41: North America Application Delivery Network Industry Revenue Share (%), by Country 2024 & 2032
- Figure 42: North America Application Delivery Network Industry Volume Share (%), by Country 2024 & 2032
- Figure 43: Europe Application Delivery Network Industry Revenue (Million), by Deployment Type 2024 & 2032
- Figure 44: Europe Application Delivery Network Industry Volume (K Unit), by Deployment Type 2024 & 2032
- Figure 45: Europe Application Delivery Network Industry Revenue Share (%), by Deployment Type 2024 & 2032
- Figure 46: Europe Application Delivery Network Industry Volume Share (%), by Deployment Type 2024 & 2032
- Figure 47: Europe Application Delivery Network Industry Revenue (Million), by Size of Enterprises 2024 & 2032
- Figure 48: Europe Application Delivery Network Industry Volume (K Unit), by Size of Enterprises 2024 & 2032
- Figure 49: Europe Application Delivery Network Industry Revenue Share (%), by Size of Enterprises 2024 & 2032
- Figure 50: Europe Application Delivery Network Industry Volume Share (%), by Size of Enterprises 2024 & 2032
- Figure 51: Europe Application Delivery Network Industry Revenue (Million), by End-user Vertical 2024 & 2032
- Figure 52: Europe Application Delivery Network Industry Volume (K Unit), by End-user Vertical 2024 & 2032
- Figure 53: Europe Application Delivery Network Industry Revenue Share (%), by End-user Vertical 2024 & 2032
- Figure 54: Europe Application Delivery Network Industry Volume Share (%), by End-user Vertical 2024 & 2032
- Figure 55: Europe Application Delivery Network Industry Revenue (Million), by Country 2024 & 2032
- Figure 56: Europe Application Delivery Network Industry Volume (K Unit), by Country 2024 & 2032
- Figure 57: Europe Application Delivery Network Industry Revenue Share (%), by Country 2024 & 2032
- Figure 58: Europe Application Delivery Network Industry Volume Share (%), by Country 2024 & 2032
- Figure 59: Asia Pacific Application Delivery Network Industry Revenue (Million), by Deployment Type 2024 & 2032
- Figure 60: Asia Pacific Application Delivery Network Industry Volume (K Unit), by Deployment Type 2024 & 2032
- Figure 61: Asia Pacific Application Delivery Network Industry Revenue Share (%), by Deployment Type 2024 & 2032
- Figure 62: Asia Pacific Application Delivery Network Industry Volume Share (%), by Deployment Type 2024 & 2032
- Figure 63: Asia Pacific Application Delivery Network Industry Revenue (Million), by Size of Enterprises 2024 & 2032
- Figure 64: Asia Pacific Application Delivery Network Industry Volume (K Unit), by Size of Enterprises 2024 & 2032
- Figure 65: Asia Pacific Application Delivery Network Industry Revenue Share (%), by Size of Enterprises 2024 & 2032
- Figure 66: Asia Pacific Application Delivery Network Industry Volume Share (%), by Size of Enterprises 2024 & 2032
- Figure 67: Asia Pacific Application Delivery Network Industry Revenue (Million), by End-user Vertical 2024 & 2032
- Figure 68: Asia Pacific Application Delivery Network Industry Volume (K Unit), by End-user Vertical 2024 & 2032
- Figure 69: Asia Pacific Application Delivery Network Industry Revenue Share (%), by End-user Vertical 2024 & 2032
- Figure 70: Asia Pacific Application Delivery Network Industry Volume Share (%), by End-user Vertical 2024 & 2032
- Figure 71: Asia Pacific Application Delivery Network Industry Revenue (Million), by Country 2024 & 2032
- Figure 72: Asia Pacific Application Delivery Network Industry Volume (K Unit), by Country 2024 & 2032
- Figure 73: Asia Pacific Application Delivery Network Industry Revenue Share (%), by Country 2024 & 2032
- Figure 74: Asia Pacific Application Delivery Network Industry Volume Share (%), by Country 2024 & 2032
- Figure 75: Latin America Application Delivery Network Industry Revenue (Million), by Deployment Type 2024 & 2032
- Figure 76: Latin America Application Delivery Network Industry Volume (K Unit), by Deployment Type 2024 & 2032
- Figure 77: Latin America Application Delivery Network Industry Revenue Share (%), by Deployment Type 2024 & 2032
- Figure 78: Latin America Application Delivery Network Industry Volume Share (%), by Deployment Type 2024 & 2032
- Figure 79: Latin America Application Delivery Network Industry Revenue (Million), by Size of Enterprises 2024 & 2032
- Figure 80: Latin America Application Delivery Network Industry Volume (K Unit), by Size of Enterprises 2024 & 2032
- Figure 81: Latin America Application Delivery Network Industry Revenue Share (%), by Size of Enterprises 2024 & 2032
- Figure 82: Latin America Application Delivery Network Industry Volume Share (%), by Size of Enterprises 2024 & 2032
- Figure 83: Latin America Application Delivery Network Industry Revenue (Million), by End-user Vertical 2024 & 2032
- Figure 84: Latin America Application Delivery Network Industry Volume (K Unit), by End-user Vertical 2024 & 2032
- Figure 85: Latin America Application Delivery Network Industry Revenue Share (%), by End-user Vertical 2024 & 2032
- Figure 86: Latin America Application Delivery Network Industry Volume Share (%), by End-user Vertical 2024 & 2032
- Figure 87: Latin America Application Delivery Network Industry Revenue (Million), by Country 2024 & 2032
- Figure 88: Latin America Application Delivery Network Industry Volume (K Unit), by Country 2024 & 2032
- Figure 89: Latin America Application Delivery Network Industry Revenue Share (%), by Country 2024 & 2032
- Figure 90: Latin America Application Delivery Network Industry Volume Share (%), by Country 2024 & 2032
- Figure 91: Middle East Application Delivery Network Industry Revenue (Million), by Deployment Type 2024 & 2032
- Figure 92: Middle East Application Delivery Network Industry Volume (K Unit), by Deployment Type 2024 & 2032
- Figure 93: Middle East Application Delivery Network Industry Revenue Share (%), by Deployment Type 2024 & 2032
- Figure 94: Middle East Application Delivery Network Industry Volume Share (%), by Deployment Type 2024 & 2032
- Figure 95: Middle East Application Delivery Network Industry Revenue (Million), by Size of Enterprises 2024 & 2032
- Figure 96: Middle East Application Delivery Network Industry Volume (K Unit), by Size of Enterprises 2024 & 2032
- Figure 97: Middle East Application Delivery Network Industry Revenue Share (%), by Size of Enterprises 2024 & 2032
- Figure 98: Middle East Application Delivery Network Industry Volume Share (%), by Size of Enterprises 2024 & 2032
- Figure 99: Middle East Application Delivery Network Industry Revenue (Million), by End-user Vertical 2024 & 2032
- Figure 100: Middle East Application Delivery Network Industry Volume (K Unit), by End-user Vertical 2024 & 2032
- Figure 101: Middle East Application Delivery Network Industry Revenue Share (%), by End-user Vertical 2024 & 2032
- Figure 102: Middle East Application Delivery Network Industry Volume Share (%), by End-user Vertical 2024 & 2032
- Figure 103: Middle East Application Delivery Network Industry Revenue (Million), by Country 2024 & 2032
- Figure 104: Middle East Application Delivery Network Industry Volume (K Unit), by Country 2024 & 2032
- Figure 105: Middle East Application Delivery Network Industry Revenue Share (%), by Country 2024 & 2032
- Figure 106: Middle East Application Delivery Network Industry Volume Share (%), by Country 2024 & 2032
List of Tables
- Table 1: Global Application Delivery Network Industry Revenue Million Forecast, by Region 2019 & 2032
- Table 2: Global Application Delivery Network Industry Volume K Unit Forecast, by Region 2019 & 2032
- Table 3: Global Application Delivery Network Industry Revenue Million Forecast, by Deployment Type 2019 & 2032
- Table 4: Global Application Delivery Network Industry Volume K Unit Forecast, by Deployment Type 2019 & 2032
- Table 5: Global Application Delivery Network Industry Revenue Million Forecast, by Size of Enterprises 2019 & 2032
- Table 6: Global Application Delivery Network Industry Volume K Unit Forecast, by Size of Enterprises 2019 & 2032
- Table 7: Global Application Delivery Network Industry Revenue Million Forecast, by End-user Vertical 2019 & 2032
- Table 8: Global Application Delivery Network Industry Volume K Unit Forecast, by End-user Vertical 2019 & 2032
- Table 9: Global Application Delivery Network Industry Revenue Million Forecast, by Region 2019 & 2032
- Table 10: Global Application Delivery Network Industry Volume K Unit Forecast, by Region 2019 & 2032
- Table 11: Global Application Delivery Network Industry Revenue Million Forecast, by Country 2019 & 2032
- Table 12: Global Application Delivery Network Industry Volume K Unit Forecast, by Country 2019 & 2032
- Table 13: United States Application Delivery Network Industry Revenue (Million) Forecast, by Application 2019 & 2032
- Table 14: United States Application Delivery Network Industry Volume (K Unit) Forecast, by Application 2019 & 2032
- Table 15: Canada Application Delivery Network Industry Revenue (Million) Forecast, by Application 2019 & 2032
- Table 16: Canada Application Delivery Network Industry Volume (K Unit) Forecast, by Application 2019 & 2032
- Table 17: Mexico Application Delivery Network Industry Revenue (Million) Forecast, by Application 2019 & 2032
- Table 18: Mexico Application Delivery Network Industry Volume (K Unit) Forecast, by Application 2019 & 2032
- Table 19: Global Application Delivery Network Industry Revenue Million Forecast, by Country 2019 & 2032
- Table 20: Global Application Delivery Network Industry Volume K Unit Forecast, by Country 2019 & 2032
- Table 21: Germany Application Delivery Network Industry Revenue (Million) Forecast, by Application 2019 & 2032
- Table 22: Germany Application Delivery Network Industry Volume (K Unit) Forecast, by Application 2019 & 2032
- Table 23: United Kingdom Application Delivery Network Industry Revenue (Million) Forecast, by Application 2019 & 2032
- Table 24: United Kingdom Application Delivery Network Industry Volume (K Unit) Forecast, by Application 2019 & 2032
- Table 25: France Application Delivery Network Industry Revenue (Million) Forecast, by Application 2019 & 2032
- Table 26: France Application Delivery Network Industry Volume (K Unit) Forecast, by Application 2019 & 2032
- Table 27: Spain Application Delivery Network Industry Revenue (Million) Forecast, by Application 2019 & 2032
- Table 28: Spain Application Delivery Network Industry Volume (K Unit) Forecast, by Application 2019 & 2032
- Table 29: Italy Application Delivery Network Industry Revenue (Million) Forecast, by Application 2019 & 2032
- Table 30: Italy Application Delivery Network Industry Volume (K Unit) Forecast, by Application 2019 & 2032
- Table 31: Spain Application Delivery Network Industry Revenue (Million) Forecast, by Application 2019 & 2032
- Table 32: Spain Application Delivery Network Industry Volume (K Unit) Forecast, by Application 2019 & 2032
- Table 33: Belgium Application Delivery Network Industry Revenue (Million) Forecast, by Application 2019 & 2032
- Table 34: Belgium Application Delivery Network Industry Volume (K Unit) Forecast, by Application 2019 & 2032
- Table 35: Netherland Application Delivery Network Industry Revenue (Million) Forecast, by Application 2019 & 2032
- Table 36: Netherland Application Delivery Network Industry Volume (K Unit) Forecast, by Application 2019 & 2032
- Table 37: Nordics Application Delivery Network Industry Revenue (Million) Forecast, by Application 2019 & 2032
- Table 38: Nordics Application Delivery Network Industry Volume (K Unit) Forecast, by Application 2019 & 2032
- Table 39: Rest of Europe Application Delivery Network Industry Revenue (Million) Forecast, by Application 2019 & 2032
- Table 40: Rest of Europe Application Delivery Network Industry Volume (K Unit) Forecast, by Application 2019 & 2032
- Table 41: Global Application Delivery Network Industry Revenue Million Forecast, by Country 2019 & 2032
- Table 42: Global Application Delivery Network Industry Volume K Unit Forecast, by Country 2019 & 2032
- Table 43: China Application Delivery Network Industry Revenue (Million) Forecast, by Application 2019 & 2032
- Table 44: China Application Delivery Network Industry Volume (K Unit) Forecast, by Application 2019 & 2032
- Table 45: Japan Application Delivery Network Industry Revenue (Million) Forecast, by Application 2019 & 2032
- Table 46: Japan Application Delivery Network Industry Volume (K Unit) Forecast, by Application 2019 & 2032
- Table 47: India Application Delivery Network Industry Revenue (Million) Forecast, by Application 2019 & 2032
- Table 48: India Application Delivery Network Industry Volume (K Unit) Forecast, by Application 2019 & 2032
- Table 49: South Korea Application Delivery Network Industry Revenue (Million) Forecast, by Application 2019 & 2032
- Table 50: South Korea Application Delivery Network Industry Volume (K Unit) Forecast, by Application 2019 & 2032
- Table 51: Southeast Asia Application Delivery Network Industry Revenue (Million) Forecast, by Application 2019 & 2032
- Table 52: Southeast Asia Application Delivery Network Industry Volume (K Unit) Forecast, by Application 2019 & 2032
- Table 53: Australia Application Delivery Network Industry Revenue (Million) Forecast, by Application 2019 & 2032
- Table 54: Australia Application Delivery Network Industry Volume (K Unit) Forecast, by Application 2019 & 2032
- Table 55: Indonesia Application Delivery Network Industry Revenue (Million) Forecast, by Application 2019 & 2032
- Table 56: Indonesia Application Delivery Network Industry Volume (K Unit) Forecast, by Application 2019 & 2032
- Table 57: Phillipes Application Delivery Network Industry Revenue (Million) Forecast, by Application 2019 & 2032
- Table 58: Phillipes Application Delivery Network Industry Volume (K Unit) Forecast, by Application 2019 & 2032
- Table 59: Singapore Application Delivery Network Industry Revenue (Million) Forecast, by Application 2019 & 2032
- Table 60: Singapore Application Delivery Network Industry Volume (K Unit) Forecast, by Application 2019 & 2032
- Table 61: Thailandc Application Delivery Network Industry Revenue (Million) Forecast, by Application 2019 & 2032
- Table 62: Thailandc Application Delivery Network Industry Volume (K Unit) Forecast, by Application 2019 & 2032
- Table 63: Rest of Asia Pacific Application Delivery Network Industry Revenue (Million) Forecast, by Application 2019 & 2032
- Table 64: Rest of Asia Pacific Application Delivery Network Industry Volume (K Unit) Forecast, by Application 2019 & 2032
- Table 65: Global Application Delivery Network Industry Revenue Million Forecast, by Country 2019 & 2032
- Table 66: Global Application Delivery Network Industry Volume K Unit Forecast, by Country 2019 & 2032
- Table 67: Brazil Application Delivery Network Industry Revenue (Million) Forecast, by Application 2019 & 2032
- Table 68: Brazil Application Delivery Network Industry Volume (K Unit) Forecast, by Application 2019 & 2032
- Table 69: Argentina Application Delivery Network Industry Revenue (Million) Forecast, by Application 2019 & 2032
- Table 70: Argentina Application Delivery Network Industry Volume (K Unit) Forecast, by Application 2019 & 2032
- Table 71: Peru Application Delivery Network Industry Revenue (Million) Forecast, by Application 2019 & 2032
- Table 72: Peru Application Delivery Network Industry Volume (K Unit) Forecast, by Application 2019 & 2032
- Table 73: Chile Application Delivery Network Industry Revenue (Million) Forecast, by Application 2019 & 2032
- Table 74: Chile Application Delivery Network Industry Volume (K Unit) Forecast, by Application 2019 & 2032
- Table 75: Colombia Application Delivery Network Industry Revenue (Million) Forecast, by Application 2019 & 2032
- Table 76: Colombia Application Delivery Network Industry Volume (K Unit) Forecast, by Application 2019 & 2032
- Table 77: Ecuador Application Delivery Network Industry Revenue (Million) Forecast, by Application 2019 & 2032
- Table 78: Ecuador Application Delivery Network Industry Volume (K Unit) Forecast, by Application 2019 & 2032
- Table 79: Venezuela Application Delivery Network Industry Revenue (Million) Forecast, by Application 2019 & 2032
- Table 80: Venezuela Application Delivery Network Industry Volume (K Unit) Forecast, by Application 2019 & 2032
- Table 81: Rest of South America Application Delivery Network Industry Revenue (Million) Forecast, by Application 2019 & 2032
- Table 82: Rest of South America Application Delivery Network Industry Volume (K Unit) Forecast, by Application 2019 & 2032
- Table 83: Global Application Delivery Network Industry Revenue Million Forecast, by Country 2019 & 2032
- Table 84: Global Application Delivery Network Industry Volume K Unit Forecast, by Country 2019 & 2032
- Table 85: United States Application Delivery Network Industry Revenue (Million) Forecast, by Application 2019 & 2032
- Table 86: United States Application Delivery Network Industry Volume (K Unit) Forecast, by Application 2019 & 2032
- Table 87: Canada Application Delivery Network Industry Revenue (Million) Forecast, by Application 2019 & 2032
- Table 88: Canada Application Delivery Network Industry Volume (K Unit) Forecast, by Application 2019 & 2032
- Table 89: Mexico Application Delivery Network Industry Revenue (Million) Forecast, by Application 2019 & 2032
- Table 90: Mexico Application Delivery Network Industry Volume (K Unit) Forecast, by Application 2019 & 2032
- Table 91: Global Application Delivery Network Industry Revenue Million Forecast, by Country 2019 & 2032
- Table 92: Global Application Delivery Network Industry Volume K Unit Forecast, by Country 2019 & 2032
- Table 93: United Arab Emirates Application Delivery Network Industry Revenue (Million) Forecast, by Application 2019 & 2032
- Table 94: United Arab Emirates Application Delivery Network Industry Volume (K Unit) Forecast, by Application 2019 & 2032
- Table 95: Saudi Arabia Application Delivery Network Industry Revenue (Million) Forecast, by Application 2019 & 2032
- Table 96: Saudi Arabia Application Delivery Network Industry Volume (K Unit) Forecast, by Application 2019 & 2032
- Table 97: South Africa Application Delivery Network Industry Revenue (Million) Forecast, by Application 2019 & 2032
- Table 98: South Africa Application Delivery Network Industry Volume (K Unit) Forecast, by Application 2019 & 2032
- Table 99: Rest of Middle East and Africa Application Delivery Network Industry Revenue (Million) Forecast, by Application 2019 & 2032
- Table 100: Rest of Middle East and Africa Application Delivery Network Industry Volume (K Unit) Forecast, by Application 2019 & 2032
- Table 101: Global Application Delivery Network Industry Revenue Million Forecast, by Deployment Type 2019 & 2032
- Table 102: Global Application Delivery Network Industry Volume K Unit Forecast, by Deployment Type 2019 & 2032
- Table 103: Global Application Delivery Network Industry Revenue Million Forecast, by Size of Enterprises 2019 & 2032
- Table 104: Global Application Delivery Network Industry Volume K Unit Forecast, by Size of Enterprises 2019 & 2032
- Table 105: Global Application Delivery Network Industry Revenue Million Forecast, by End-user Vertical 2019 & 2032
- Table 106: Global Application Delivery Network Industry Volume K Unit Forecast, by End-user Vertical 2019 & 2032
- Table 107: Global Application Delivery Network Industry Revenue Million Forecast, by Country 2019 & 2032
- Table 108: Global Application Delivery Network Industry Volume K Unit Forecast, by Country 2019 & 2032
- Table 109: United States Application Delivery Network Industry Revenue (Million) Forecast, by Application 2019 & 2032
- Table 110: United States Application Delivery Network Industry Volume (K Unit) Forecast, by Application 2019 & 2032
- Table 111: Canada Application Delivery Network Industry Revenue (Million) Forecast, by Application 2019 & 2032
- Table 112: Canada Application Delivery Network Industry Volume (K Unit) Forecast, by Application 2019 & 2032
- Table 113: Global Application Delivery Network Industry Revenue Million Forecast, by Deployment Type 2019 & 2032
- Table 114: Global Application Delivery Network Industry Volume K Unit Forecast, by Deployment Type 2019 & 2032
- Table 115: Global Application Delivery Network Industry Revenue Million Forecast, by Size of Enterprises 2019 & 2032
- Table 116: Global Application Delivery Network Industry Volume K Unit Forecast, by Size of Enterprises 2019 & 2032
- Table 117: Global Application Delivery Network Industry Revenue Million Forecast, by End-user Vertical 2019 & 2032
- Table 118: Global Application Delivery Network Industry Volume K Unit Forecast, by End-user Vertical 2019 & 2032
- Table 119: Global Application Delivery Network Industry Revenue Million Forecast, by Country 2019 & 2032
- Table 120: Global Application Delivery Network Industry Volume K Unit Forecast, by Country 2019 & 2032
- Table 121: United Kingdom Application Delivery Network Industry Revenue (Million) Forecast, by Application 2019 & 2032
- Table 122: United Kingdom Application Delivery Network Industry Volume (K Unit) Forecast, by Application 2019 & 2032
- Table 123: Germany Application Delivery Network Industry Revenue (Million) Forecast, by Application 2019 & 2032
- Table 124: Germany Application Delivery Network Industry Volume (K Unit) Forecast, by Application 2019 & 2032
- Table 125: France Application Delivery Network Industry Revenue (Million) Forecast, by Application 2019 & 2032
- Table 126: France Application Delivery Network Industry Volume (K Unit) Forecast, by Application 2019 & 2032
- Table 127: Rest of Europe Application Delivery Network Industry Revenue (Million) Forecast, by Application 2019 & 2032
- Table 128: Rest of Europe Application Delivery Network Industry Volume (K Unit) Forecast, by Application 2019 & 2032
- Table 129: Global Application Delivery Network Industry Revenue Million Forecast, by Deployment Type 2019 & 2032
- Table 130: Global Application Delivery Network Industry Volume K Unit Forecast, by Deployment Type 2019 & 2032
- Table 131: Global Application Delivery Network Industry Revenue Million Forecast, by Size of Enterprises 2019 & 2032
- Table 132: Global Application Delivery Network Industry Volume K Unit Forecast, by Size of Enterprises 2019 & 2032
- Table 133: Global Application Delivery Network Industry Revenue Million Forecast, by End-user Vertical 2019 & 2032
- Table 134: Global Application Delivery Network Industry Volume K Unit Forecast, by End-user Vertical 2019 & 2032
- Table 135: Global Application Delivery Network Industry Revenue Million Forecast, by Country 2019 & 2032
- Table 136: Global Application Delivery Network Industry Volume K Unit Forecast, by Country 2019 & 2032
- Table 137: China Application Delivery Network Industry Revenue (Million) Forecast, by Application 2019 & 2032
- Table 138: China Application Delivery Network Industry Volume (K Unit) Forecast, by Application 2019 & 2032
- Table 139: India Application Delivery Network Industry Revenue (Million) Forecast, by Application 2019 & 2032
- Table 140: India Application Delivery Network Industry Volume (K Unit) Forecast, by Application 2019 & 2032
- Table 141: Japan Application Delivery Network Industry Revenue (Million) Forecast, by Application 2019 & 2032
- Table 142: Japan Application Delivery Network Industry Volume (K Unit) Forecast, by Application 2019 & 2032
- Table 143: Rest of Asia Pacific Application Delivery Network Industry Revenue (Million) Forecast, by Application 2019 & 2032
- Table 144: Rest of Asia Pacific Application Delivery Network Industry Volume (K Unit) Forecast, by Application 2019 & 2032
- Table 145: Global Application Delivery Network Industry Revenue Million Forecast, by Deployment Type 2019 & 2032
- Table 146: Global Application Delivery Network Industry Volume K Unit Forecast, by Deployment Type 2019 & 2032
- Table 147: Global Application Delivery Network Industry Revenue Million Forecast, by Size of Enterprises 2019 & 2032
- Table 148: Global Application Delivery Network Industry Volume K Unit Forecast, by Size of Enterprises 2019 & 2032
- Table 149: Global Application Delivery Network Industry Revenue Million Forecast, by End-user Vertical 2019 & 2032
- Table 150: Global Application Delivery Network Industry Volume K Unit Forecast, by End-user Vertical 2019 & 2032
- Table 151: Global Application Delivery Network Industry Revenue Million Forecast, by Country 2019 & 2032
- Table 152: Global Application Delivery Network Industry Volume K Unit Forecast, by Country 2019 & 2032
- Table 153: Global Application Delivery Network Industry Revenue Million Forecast, by Deployment Type 2019 & 2032
- Table 154: Global Application Delivery Network Industry Volume K Unit Forecast, by Deployment Type 2019 & 2032
- Table 155: Global Application Delivery Network Industry Revenue Million Forecast, by Size of Enterprises 2019 & 2032
- Table 156: Global Application Delivery Network Industry Volume K Unit Forecast, by Size of Enterprises 2019 & 2032
- Table 157: Global Application Delivery Network Industry Revenue Million Forecast, by End-user Vertical 2019 & 2032
- Table 158: Global Application Delivery Network Industry Volume K Unit Forecast, by End-user Vertical 2019 & 2032
- Table 159: Global Application Delivery Network Industry Revenue Million Forecast, by Country 2019 & 2032
- Table 160: Global Application Delivery Network Industry Volume K Unit Forecast, by Country 2019 & 2032
Frequently Asked Questions
1. What is the projected Compound Annual Growth Rate (CAGR) of the Application Delivery Network Industry?
The projected CAGR is approximately 10.92%.
2. Which companies are prominent players in the Application Delivery Network Industry?
Key companies in the market include Radware Corporation, Barracuda Networks Inc , Kemp Technologies, F5 Networks Inc, Array Networks, Avi Networks (Vmware), Cisco Systems Inc, Akamai Technologies, A10 Networks Inc, Broadcom Inc (Symantec Corporation), Citrix Systems Inc.
3. What are the main segments of the Application Delivery Network Industry?
The market segments include Deployment Type, Size of Enterprises, End-user Vertical.
4. Can you provide details about the market size?
The market size is estimated to be USD 8.67 Million as of 2022.
5. What are some drivers contributing to market growth?
Rising Need for Application Performance Scaling and Security; Growing Adoption of Cloud Based Applications; Increasing BYOD Trend.
6. What are the notable trends driving market growth?
Cloud-based Delivery to Witness the Highest Growth.
7. Are there any restraints impacting market growth?
Security Issues Associated with Cloud.
8. Can you provide examples of recent developments in the market?
February 2023 - Juniper Networks Inc has announced that Green energy data centers, the most significant and most energy data efficient company in the Baltics, has deployed Juniper's cloud-ready data center and AI-driven enterprise solutions to support its business and data center operations, the GDC data center is a 14,500-square-meter, 31.5-megawatt facility. Multiple levels of physical security keep the premises secure. Redundant power and digital infrastructure systems support highly reliable operations.
9. What pricing options are available for accessing the report?
Pricing options include single-user, multi-user, and enterprise licenses priced at USD 4750, USD 5250, and USD 8750 respectively.
10. Is the market size provided in terms of value or volume?
The market size is provided in terms of value, measured in Million and volume, measured in K Unit.
11. Are there any specific market keywords associated with the report?
Yes, the market keyword associated with the report is "Application Delivery Network Industry," which aids in identifying and referencing the specific market segment covered.
12. How do I determine which pricing option suits my needs best?
The pricing options vary based on user requirements and access needs. Individual users may opt for single-user licenses, while businesses requiring broader access may choose multi-user or enterprise licenses for cost-effective access to the report.
13. Are there any additional resources or data provided in the Application Delivery Network Industry report?
While the report offers comprehensive insights, it's advisable to review the specific contents or supplementary materials provided to ascertain if additional resources or data are available.
14. How can I stay updated on further developments or reports in the Application Delivery Network Industry?
To stay informed about further developments, trends, and reports in the Application Delivery Network Industry, consider subscribing to industry newsletters, following relevant companies and organizations, or regularly checking reputable industry news sources and publications.
Methodology
Step 1 - Identification of Relevant Samples Size from Population Database


Step 2 - Approaches for Defining Global Market Size (Value, Volume* & Price*)

Note*: In applicable scenarios
Step 3 - Data Sources
Primary Research
- Web Analytics
- Survey Reports
- Research Institute
- Latest Research Reports
- Opinion Leaders
Secondary Research
- Annual Reports
- White Paper
- Latest Press Release
- Industry Association
- Paid Database
- Investor Presentations

Step 4 - Data Triangulation
Involves using different sources of information in order to increase the validity of a study
These sources are likely to be stakeholders in a program - participants, other researchers, program staff, other community members, and so on.
Then we put all data in single framework & apply various statistical tools to find out the dynamic on the market.
During the analysis stage, feedback from the stakeholder groups would be compared to determine areas of agreement as well as areas of divergence


