
Key Insights
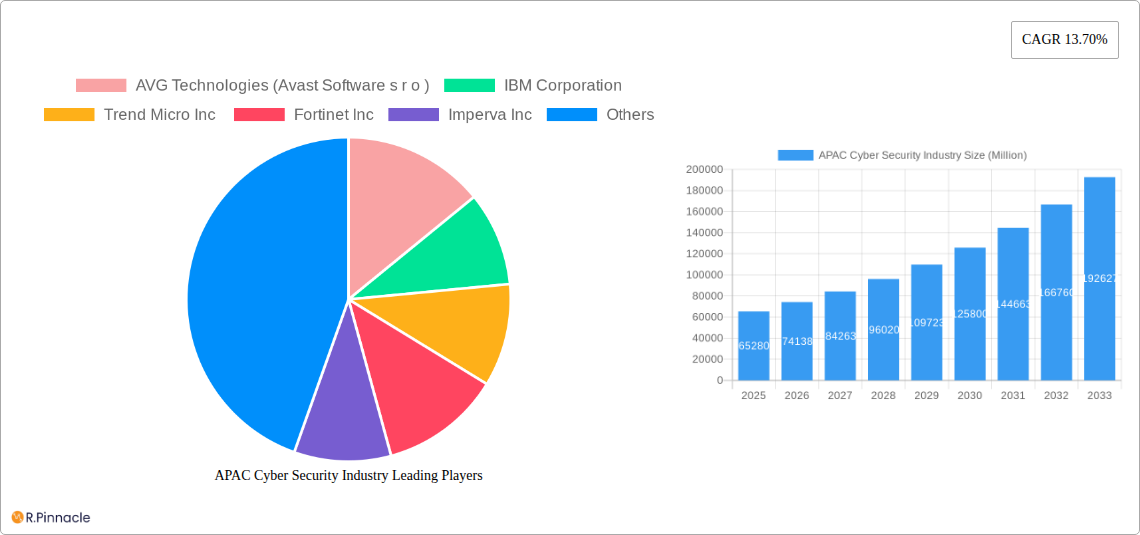
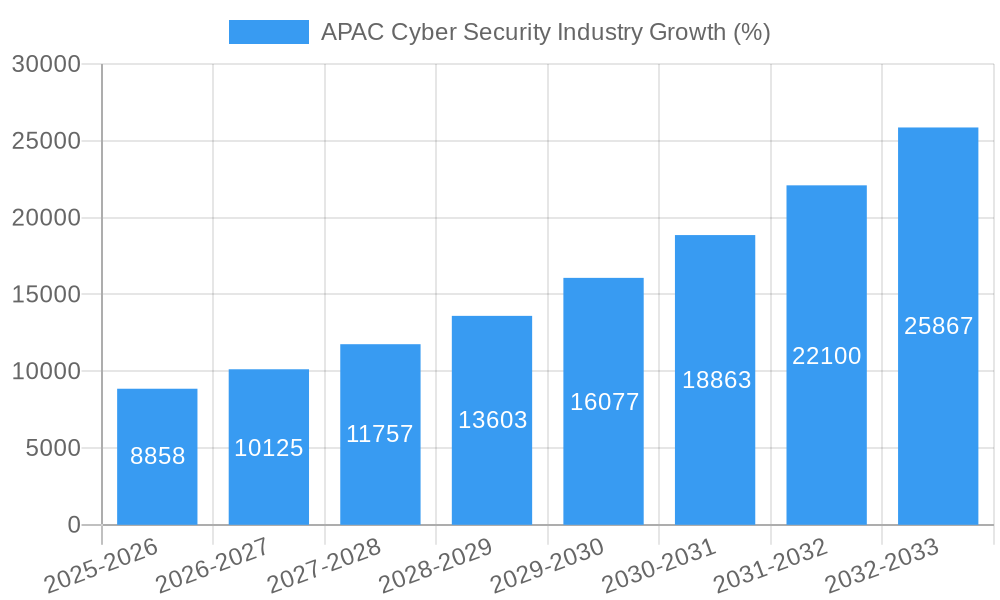
The Asia-Pacific (APAC) cybersecurity market, valued at $65.28 billion in 2025, is experiencing robust growth, projected to expand at a Compound Annual Growth Rate (CAGR) of 13.70% from 2025 to 2033. This surge is driven by several factors. Increasing digitalization across various sectors like banking, finance, healthcare, and e-commerce has created a vast attack surface, making robust cybersecurity crucial. The rising adoption of cloud computing, Internet of Things (IoT) devices, and sophisticated cyberattacks necessitates stronger security solutions. Furthermore, stringent government regulations aimed at data protection and privacy, coupled with heightened awareness among businesses about cybersecurity risks, are fueling market expansion. China, India, and Japan represent significant market segments within APAC, contributing substantially to the overall growth due to their large economies and expanding digital infrastructures. However, the market also faces challenges such as a shortage of skilled cybersecurity professionals and the evolving nature of cyber threats, which requires continuous adaptation and investment in advanced security technologies.
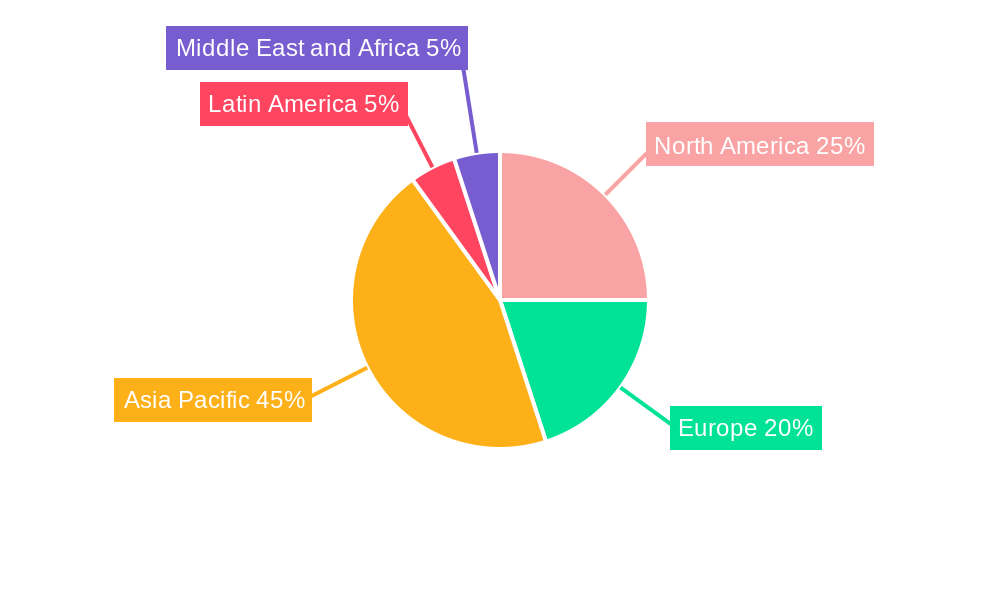
The segment breakdown reveals significant opportunities. The "Solutions" segment likely commands the largest market share, followed by "Services." Among deployment models, "On-cloud" solutions are anticipated to witness faster adoption compared to "On-premises" due to cost-effectiveness and scalability. Within end-user industries, banking, financial services, and insurance (BFSI) and healthcare are likely to invest heavily in cybersecurity due to the sensitive nature of the data they handle. While the provided data lacks specific regional breakdowns for APAC, a reasonable estimation based on global trends suggests that China and India will dominate the regional market, followed by Japan and South Korea. This regional disparity stems from varying levels of digital adoption, economic development, and regulatory frameworks across the region. The continued growth depends heavily on proactive measures to address the skill gap and the constant arms race against increasingly sophisticated cyber threats.
APAC Cyber Security Industry Report: 2019-2033
This comprehensive report provides a detailed analysis of the Asia-Pacific (APAC) cybersecurity industry, offering invaluable insights for industry professionals, investors, and strategic decision-makers. Covering the period 2019-2033, with a focus on 2025, this report unveils the market's structure, dynamics, dominant segments, and future outlook. The report leverages extensive market research and data analysis to provide actionable intelligence on a multi-billion dollar market.
APAC Cyber Security Industry Market Structure & Innovation Trends
The APAC cybersecurity market is characterized by a dynamic interplay of established players and emerging innovators. Market concentration is moderate, with a few dominant players holding significant market share, while numerous smaller firms compete in niche segments. The market size in 2025 is estimated at $XX Billion. Innovation is driven by increasing cyber threats, evolving regulatory landscapes, and the rising adoption of cloud and IoT technologies. Key innovation drivers include AI-powered threat detection, advanced endpoint protection, and zero-trust security architectures. Mergers and acquisitions (M&A) activity is substantial, with deal values reaching $XX Billion annually. Key M&A activities reflect the strategic consolidation of the market and the acquisition of specialized technologies.
- Market Concentration: Moderate, with top 5 players holding approximately xx% market share in 2025.
- M&A Activity: Significant, with annual deal values exceeding $XX Billion in recent years. Deals primarily involve the acquisition of smaller, specialized firms by larger players.
- Regulatory Frameworks: Vary across APAC nations, driving investments in compliance solutions.
- Product Substitutes: Limited, as cybersecurity solutions are often highly specialized and integrated into IT infrastructure.
- End-User Demographics: Predominantly large enterprises and government organizations, with increasing adoption among SMEs.
APAC Cyber Security Industry Market Dynamics & Trends
The APAC cybersecurity market is experiencing robust growth, driven by factors such as increasing digitalization, rising cyberattacks, stringent data privacy regulations, and government initiatives promoting cybersecurity awareness. The market is projected to witness a Compound Annual Growth Rate (CAGR) of xx% during the forecast period (2025-2033). Technological disruptions, such as the rise of cloud computing, IoT, and AI, are reshaping the competitive landscape. Consumer preferences are shifting towards integrated, cloud-based solutions that offer enhanced security and simplified management. Competitive dynamics are intense, with companies focusing on product differentiation, strategic partnerships, and expansion into new markets. Market penetration of advanced cybersecurity solutions remains relatively low, presenting significant growth opportunities.
Dominant Regions & Segments in APAC Cyber Security Industry
China and India are the leading markets in the APAC cybersecurity industry, driven by rapid digital transformation and growing government investments. Japan and South Korea also exhibit strong growth potential, owing to advanced technological infrastructure and robust regulatory frameworks.
By Country:
- China: Largest market, driven by increasing government spending and growing adoption of cloud solutions.
- India: High growth potential, fueled by rising digital adoption and outsourcing of IT services.
- Japan: Mature market with strong focus on data privacy and compliance.
- South Korea: Advanced technological infrastructure and high cybersecurity awareness.
- Rest of Asia Pacific: Exhibits diverse growth dynamics, influenced by regional economic conditions.
By End-user Industry: Banking, Financial Services, and Insurance (BFSI) sector holds the largest share, followed by IT and Telecommunication. Government sectors' demand is growing rapidly.
By Product Type: Solutions dominate the market, followed by services.
By Deployment: On-cloud deployment is witnessing rapid adoption, surpassing on-premises solutions.
Key drivers for dominant segments include: robust economic growth, increasing digital infrastructure development, and stringent data privacy regulations.
APAC Cyber Security Industry Product Innovations
Recent innovations in the APAC cybersecurity market focus on AI-powered threat detection, advanced endpoint protection, and cloud-based security solutions. These innovations offer enhanced threat prevention, detection, and response capabilities, addressing the evolving needs of organizations in a rapidly changing threat landscape. Products are increasingly integrated and leverage automation to improve efficiency and reduce the complexity of security management. The emphasis is on user-friendliness and ease of implementation.
Report Scope & Segmentation Analysis
This report segments the APAC cybersecurity market by end-user industry (Aerospace and Defense, BFSI, Healthcare, Manufacturing, Retail, IT and Telecommunication, Other), country (China, India, Japan, South Korea, Rest of Asia Pacific), product type (Solutions, Services), and deployment (On-cloud, On-premises). Each segment offers detailed analysis of market size, growth projections, and competitive dynamics, providing a granular view of the overall market. Market sizes are estimated at $XX Billion for each segment in 2025, with varying growth projections for the forecast period (2025-2033).
Key Drivers of APAC Cyber Security Industry Growth
Several factors drive the growth of the APAC cybersecurity industry: the increasing prevalence of cyberattacks targeting businesses and individuals, the growing adoption of cloud computing and IoT technologies, stringent data privacy regulations (like GDPR), and rising government investments in cybersecurity infrastructure. Furthermore, the increasing awareness of cybersecurity risks among businesses and individuals fuels demand for robust security solutions.
Challenges in the APAP Cyber Security Industry Sector
The APAC cybersecurity market faces several challenges including the shortage of skilled cybersecurity professionals, the high cost of implementing and maintaining sophisticated security solutions, the complexity of managing security across diverse IT environments, and the constant evolution of cyber threats. The varying levels of cybersecurity maturity across different APAC countries also pose a challenge. These factors hinder widespread adoption and contribute to significant financial losses annually.
Emerging Opportunities in APAC Cyber Security Industry
Significant opportunities exist in the APAC cybersecurity market, including the growing demand for cloud security solutions, the increasing adoption of AI and machine learning in threat detection, the expansion of managed security services (MSS), the rising adoption of zero-trust security models, and the development of specialized cybersecurity solutions for specific industries (e.g., healthcare, BFSI). The untapped potential in SMEs also presents a significant opportunity.
Leading Players in the APAC Cyber Security Industry Market
- AVG Technologies (Avast Software s r o )
- IBM Corporation
- Trend Micro Inc
- Fortinet Inc
- Imperva Inc
- Check Point Software Technologies Ltd
- Cisco Systems Inc
- Broadcom Inc
- Proofpoint Inc
- Rapid7 Inc
- Cyber Ark Software Ltd
- Intel Security (Intel Corporation)
- Dell Technologies Inc
- Palo Alto Networks Inc
Key Developments in APAC Cyber Security Industry Industry
- December 2022: VI Business launched VI Secure, a comprehensive cybersecurity portfolio in India, offering protection against network, cloud, and endpoint threats, including email, web, and virtualized firewall protection using Cisco's FirstWave CyberCision platform.
- July 2022: Cyware and CyberQ Group formed a partnership to enhance cybersecurity capabilities in the Asia-Pacific region, offering advanced managed security services and threat intelligence sharing.
Future Outlook for APAC Cyber Security Industry Market
The APAC cybersecurity market is poised for sustained growth, driven by continued digital transformation, increasing cyber threats, and heightened regulatory scrutiny. Strategic investments in advanced security technologies, partnerships, and talent acquisition will be critical for success. The market will see increased consolidation and a focus on integrated security solutions addressing evolving threats and compliance requirements. The focus on cloud security and AI-driven solutions will continue to shape the future of the industry.
APAC Cyber Security Industry Segmentation
-
1. Product Type
-
1.1. Solutions
- 1.1.1. Identity and Access Management
- 1.1.2. Threat D
- 1.1.3. Security and Vulnerability Management
- 1.1.4. DDoS Mitigation
- 1.1.5. Next Generation Firewall
- 1.1.6. IDS/IPS
- 1.1.7. Security Information and Event Management
- 1.1.8. Other Solutions
- 1.2. Services
-
1.1. Solutions
-
2. Deployment
- 2.1. On-cloud
- 2.2. On-premises
-
3. End-user Industry
- 3.1. Aerospace and Defense
- 3.2. Banking, Financial Services, and Insurance
- 3.3. Healthcare
- 3.4. Manufacturing
- 3.5. Retail
- 3.6. IT and Telecommunication
- 3.7. Other End-user Industries
APAC Cyber Security Industry Segmentation By Geography
-
1. North America
- 1.1. United States
- 1.2. Canada
- 1.3. Mexico
-
2. South America
- 2.1. Brazil
- 2.2. Argentina
- 2.3. Rest of South America
-
3. Europe
- 3.1. United Kingdom
- 3.2. Germany
- 3.3. France
- 3.4. Italy
- 3.5. Spain
- 3.6. Russia
- 3.7. Benelux
- 3.8. Nordics
- 3.9. Rest of Europe
-
4. Middle East & Africa
- 4.1. Turkey
- 4.2. Israel
- 4.3. GCC
- 4.4. North Africa
- 4.5. South Africa
- 4.6. Rest of Middle East & Africa
-
5. Asia Pacific
- 5.1. China
- 5.2. India
- 5.3. Japan
- 5.4. South Korea
- 5.5. ASEAN
- 5.6. Oceania
- 5.7. Rest of Asia Pacific
APAC Cyber Security Industry REPORT HIGHLIGHTS
| Aspects | Details |
|---|---|
| Study Period | 2019-2033 |
| Base Year | 2024 |
| Estimated Year | 2025 |
| Forecast Period | 2025-2033 |
| Historical Period | 2019-2024 |
| Growth Rate | CAGR of 13.70% from 2019-2033 |
| Segmentation |
|
Table of Contents
- 1. Introduction
- 1.1. Research Scope
- 1.2. Market Segmentation
- 1.3. Research Methodology
- 1.4. Definitions and Assumptions
- 2. Executive Summary
- 2.1. Introduction
- 3. Market Dynamics
- 3.1. Introduction
- 3.2. Market Drivers
- 3.2.1. Rapidly Increasing Cybersecurity Incidents and Regulations Requiring Their Reporting; Growing M2M/IoT Connections Demanding Strengthened Cybersecurity in Enterprises
- 3.3. Market Restrains
- 3.3.1. Lack of Cybersecurity Professionals; High Reliance on Traditional Authentication Methods and Low Preparedness
- 3.4. Market Trends
- 3.4.1. Cloud Deployment Drives Market Growth
- 4. Market Factor Analysis
- 4.1. Porters Five Forces
- 4.2. Supply/Value Chain
- 4.3. PESTEL analysis
- 4.4. Market Entropy
- 4.5. Patent/Trademark Analysis
- 5. Global APAC Cyber Security Industry Analysis, Insights and Forecast, 2019-2031
- 5.1. Market Analysis, Insights and Forecast - by Product Type
- 5.1.1. Solutions
- 5.1.1.1. Identity and Access Management
- 5.1.1.2. Threat D
- 5.1.1.3. Security and Vulnerability Management
- 5.1.1.4. DDoS Mitigation
- 5.1.1.5. Next Generation Firewall
- 5.1.1.6. IDS/IPS
- 5.1.1.7. Security Information and Event Management
- 5.1.1.8. Other Solutions
- 5.1.2. Services
- 5.1.1. Solutions
- 5.2. Market Analysis, Insights and Forecast - by Deployment
- 5.2.1. On-cloud
- 5.2.2. On-premises
- 5.3. Market Analysis, Insights and Forecast - by End-user Industry
- 5.3.1. Aerospace and Defense
- 5.3.2. Banking, Financial Services, and Insurance
- 5.3.3. Healthcare
- 5.3.4. Manufacturing
- 5.3.5. Retail
- 5.3.6. IT and Telecommunication
- 5.3.7. Other End-user Industries
- 5.4. Market Analysis, Insights and Forecast - by Region
- 5.4.1. North America
- 5.4.2. South America
- 5.4.3. Europe
- 5.4.4. Middle East & Africa
- 5.4.5. Asia Pacific
- 5.1. Market Analysis, Insights and Forecast - by Product Type
- 6. North America APAC Cyber Security Industry Analysis, Insights and Forecast, 2019-2031
- 6.1. Market Analysis, Insights and Forecast - by Product Type
- 6.1.1. Solutions
- 6.1.1.1. Identity and Access Management
- 6.1.1.2. Threat D
- 6.1.1.3. Security and Vulnerability Management
- 6.1.1.4. DDoS Mitigation
- 6.1.1.5. Next Generation Firewall
- 6.1.1.6. IDS/IPS
- 6.1.1.7. Security Information and Event Management
- 6.1.1.8. Other Solutions
- 6.1.2. Services
- 6.1.1. Solutions
- 6.2. Market Analysis, Insights and Forecast - by Deployment
- 6.2.1. On-cloud
- 6.2.2. On-premises
- 6.3. Market Analysis, Insights and Forecast - by End-user Industry
- 6.3.1. Aerospace and Defense
- 6.3.2. Banking, Financial Services, and Insurance
- 6.3.3. Healthcare
- 6.3.4. Manufacturing
- 6.3.5. Retail
- 6.3.6. IT and Telecommunication
- 6.3.7. Other End-user Industries
- 6.1. Market Analysis, Insights and Forecast - by Product Type
- 7. South America APAC Cyber Security Industry Analysis, Insights and Forecast, 2019-2031
- 7.1. Market Analysis, Insights and Forecast - by Product Type
- 7.1.1. Solutions
- 7.1.1.1. Identity and Access Management
- 7.1.1.2. Threat D
- 7.1.1.3. Security and Vulnerability Management
- 7.1.1.4. DDoS Mitigation
- 7.1.1.5. Next Generation Firewall
- 7.1.1.6. IDS/IPS
- 7.1.1.7. Security Information and Event Management
- 7.1.1.8. Other Solutions
- 7.1.2. Services
- 7.1.1. Solutions
- 7.2. Market Analysis, Insights and Forecast - by Deployment
- 7.2.1. On-cloud
- 7.2.2. On-premises
- 7.3. Market Analysis, Insights and Forecast - by End-user Industry
- 7.3.1. Aerospace and Defense
- 7.3.2. Banking, Financial Services, and Insurance
- 7.3.3. Healthcare
- 7.3.4. Manufacturing
- 7.3.5. Retail
- 7.3.6. IT and Telecommunication
- 7.3.7. Other End-user Industries
- 7.1. Market Analysis, Insights and Forecast - by Product Type
- 8. Europe APAC Cyber Security Industry Analysis, Insights and Forecast, 2019-2031
- 8.1. Market Analysis, Insights and Forecast - by Product Type
- 8.1.1. Solutions
- 8.1.1.1. Identity and Access Management
- 8.1.1.2. Threat D
- 8.1.1.3. Security and Vulnerability Management
- 8.1.1.4. DDoS Mitigation
- 8.1.1.5. Next Generation Firewall
- 8.1.1.6. IDS/IPS
- 8.1.1.7. Security Information and Event Management
- 8.1.1.8. Other Solutions
- 8.1.2. Services
- 8.1.1. Solutions
- 8.2. Market Analysis, Insights and Forecast - by Deployment
- 8.2.1. On-cloud
- 8.2.2. On-premises
- 8.3. Market Analysis, Insights and Forecast - by End-user Industry
- 8.3.1. Aerospace and Defense
- 8.3.2. Banking, Financial Services, and Insurance
- 8.3.3. Healthcare
- 8.3.4. Manufacturing
- 8.3.5. Retail
- 8.3.6. IT and Telecommunication
- 8.3.7. Other End-user Industries
- 8.1. Market Analysis, Insights and Forecast - by Product Type
- 9. Middle East & Africa APAC Cyber Security Industry Analysis, Insights and Forecast, 2019-2031
- 9.1. Market Analysis, Insights and Forecast - by Product Type
- 9.1.1. Solutions
- 9.1.1.1. Identity and Access Management
- 9.1.1.2. Threat D
- 9.1.1.3. Security and Vulnerability Management
- 9.1.1.4. DDoS Mitigation
- 9.1.1.5. Next Generation Firewall
- 9.1.1.6. IDS/IPS
- 9.1.1.7. Security Information and Event Management
- 9.1.1.8. Other Solutions
- 9.1.2. Services
- 9.1.1. Solutions
- 9.2. Market Analysis, Insights and Forecast - by Deployment
- 9.2.1. On-cloud
- 9.2.2. On-premises
- 9.3. Market Analysis, Insights and Forecast - by End-user Industry
- 9.3.1. Aerospace and Defense
- 9.3.2. Banking, Financial Services, and Insurance
- 9.3.3. Healthcare
- 9.3.4. Manufacturing
- 9.3.5. Retail
- 9.3.6. IT and Telecommunication
- 9.3.7. Other End-user Industries
- 9.1. Market Analysis, Insights and Forecast - by Product Type
- 10. Asia Pacific APAC Cyber Security Industry Analysis, Insights and Forecast, 2019-2031
- 10.1. Market Analysis, Insights and Forecast - by Product Type
- 10.1.1. Solutions
- 10.1.1.1. Identity and Access Management
- 10.1.1.2. Threat D
- 10.1.1.3. Security and Vulnerability Management
- 10.1.1.4. DDoS Mitigation
- 10.1.1.5. Next Generation Firewall
- 10.1.1.6. IDS/IPS
- 10.1.1.7. Security Information and Event Management
- 10.1.1.8. Other Solutions
- 10.1.2. Services
- 10.1.1. Solutions
- 10.2. Market Analysis, Insights and Forecast - by Deployment
- 10.2.1. On-cloud
- 10.2.2. On-premises
- 10.3. Market Analysis, Insights and Forecast - by End-user Industry
- 10.3.1. Aerospace and Defense
- 10.3.2. Banking, Financial Services, and Insurance
- 10.3.3. Healthcare
- 10.3.4. Manufacturing
- 10.3.5. Retail
- 10.3.6. IT and Telecommunication
- 10.3.7. Other End-user Industries
- 10.1. Market Analysis, Insights and Forecast - by Product Type
- 11. North America APAC Cyber Security Industry Analysis, Insights and Forecast, 2019-2031
- 11.1. Market Analysis, Insights and Forecast - By Country/Sub-region
- 11.1.1.
- 12. Europe APAC Cyber Security Industry Analysis, Insights and Forecast, 2019-2031
- 12.1. Market Analysis, Insights and Forecast - By Country/Sub-region
- 12.1.1.
- 13. Asia Pacific APAC Cyber Security Industry Analysis, Insights and Forecast, 2019-2031
- 13.1. Market Analysis, Insights and Forecast - By Country/Sub-region
- 13.1.1.
- 14. Latin America APAC Cyber Security Industry Analysis, Insights and Forecast, 2019-2031
- 14.1. Market Analysis, Insights and Forecast - By Country/Sub-region
- 14.1.1.
- 15. Middle East and Africa APAC Cyber Security Industry Analysis, Insights and Forecast, 2019-2031
- 15.1. Market Analysis, Insights and Forecast - By Country/Sub-region
- 15.1.1.
- 16. Competitive Analysis
- 16.1. Global Market Share Analysis 2024
- 16.2. Company Profiles
- 16.2.1 AVG Technologies (Avast Software s r o )
- 16.2.1.1. Overview
- 16.2.1.2. Products
- 16.2.1.3. SWOT Analysis
- 16.2.1.4. Recent Developments
- 16.2.1.5. Financials (Based on Availability)
- 16.2.2 IBM Corporation
- 16.2.2.1. Overview
- 16.2.2.2. Products
- 16.2.2.3. SWOT Analysis
- 16.2.2.4. Recent Developments
- 16.2.2.5. Financials (Based on Availability)
- 16.2.3 Trend Micro Inc
- 16.2.3.1. Overview
- 16.2.3.2. Products
- 16.2.3.3. SWOT Analysis
- 16.2.3.4. Recent Developments
- 16.2.3.5. Financials (Based on Availability)
- 16.2.4 Fortinet Inc
- 16.2.4.1. Overview
- 16.2.4.2. Products
- 16.2.4.3. SWOT Analysis
- 16.2.4.4. Recent Developments
- 16.2.4.5. Financials (Based on Availability)
- 16.2.5 Imperva Inc
- 16.2.5.1. Overview
- 16.2.5.2. Products
- 16.2.5.3. SWOT Analysis
- 16.2.5.4. Recent Developments
- 16.2.5.5. Financials (Based on Availability)
- 16.2.6 Check Point Software Technologies Ltd
- 16.2.6.1. Overview
- 16.2.6.2. Products
- 16.2.6.3. SWOT Analysis
- 16.2.6.4. Recent Developments
- 16.2.6.5. Financials (Based on Availability)
- 16.2.7 Cisco Systems Inc
- 16.2.7.1. Overview
- 16.2.7.2. Products
- 16.2.7.3. SWOT Analysis
- 16.2.7.4. Recent Developments
- 16.2.7.5. Financials (Based on Availability)
- 16.2.8 Broadcom Inc
- 16.2.8.1. Overview
- 16.2.8.2. Products
- 16.2.8.3. SWOT Analysis
- 16.2.8.4. Recent Developments
- 16.2.8.5. Financials (Based on Availability)
- 16.2.9 Proofpoint Inc
- 16.2.9.1. Overview
- 16.2.9.2. Products
- 16.2.9.3. SWOT Analysis
- 16.2.9.4. Recent Developments
- 16.2.9.5. Financials (Based on Availability)
- 16.2.10 Rapid7 Inc
- 16.2.10.1. Overview
- 16.2.10.2. Products
- 16.2.10.3. SWOT Analysis
- 16.2.10.4. Recent Developments
- 16.2.10.5. Financials (Based on Availability)
- 16.2.11 Cyber Ark Software Ltd
- 16.2.11.1. Overview
- 16.2.11.2. Products
- 16.2.11.3. SWOT Analysis
- 16.2.11.4. Recent Developments
- 16.2.11.5. Financials (Based on Availability)
- 16.2.12 Intel Security (Intel Corporation)
- 16.2.12.1. Overview
- 16.2.12.2. Products
- 16.2.12.3. SWOT Analysis
- 16.2.12.4. Recent Developments
- 16.2.12.5. Financials (Based on Availability)
- 16.2.13 Dell Technologies Inc
- 16.2.13.1. Overview
- 16.2.13.2. Products
- 16.2.13.3. SWOT Analysis
- 16.2.13.4. Recent Developments
- 16.2.13.5. Financials (Based on Availability)
- 16.2.14 Fireeye Inc
- 16.2.14.1. Overview
- 16.2.14.2. Products
- 16.2.14.3. SWOT Analysis
- 16.2.14.4. Recent Developments
- 16.2.14.5. Financials (Based on Availability)
- 16.2.15 Palo Alto Networks Inc
- 16.2.15.1. Overview
- 16.2.15.2. Products
- 16.2.15.3. SWOT Analysis
- 16.2.15.4. Recent Developments
- 16.2.15.5. Financials (Based on Availability)
- 16.2.1 AVG Technologies (Avast Software s r o )
List of Figures
- Figure 1: Global APAC Cyber Security Industry Revenue Breakdown (Million, %) by Region 2024 & 2032
- Figure 2: Global APAC Cyber Security Industry Volume Breakdown (K Unit, %) by Region 2024 & 2032
- Figure 3: North America APAC Cyber Security Industry Revenue (Million), by Country 2024 & 2032
- Figure 4: North America APAC Cyber Security Industry Volume (K Unit), by Country 2024 & 2032
- Figure 5: North America APAC Cyber Security Industry Revenue Share (%), by Country 2024 & 2032
- Figure 6: North America APAC Cyber Security Industry Volume Share (%), by Country 2024 & 2032
- Figure 7: Europe APAC Cyber Security Industry Revenue (Million), by Country 2024 & 2032
- Figure 8: Europe APAC Cyber Security Industry Volume (K Unit), by Country 2024 & 2032
- Figure 9: Europe APAC Cyber Security Industry Revenue Share (%), by Country 2024 & 2032
- Figure 10: Europe APAC Cyber Security Industry Volume Share (%), by Country 2024 & 2032
- Figure 11: Asia Pacific APAC Cyber Security Industry Revenue (Million), by Country 2024 & 2032
- Figure 12: Asia Pacific APAC Cyber Security Industry Volume (K Unit), by Country 2024 & 2032
- Figure 13: Asia Pacific APAC Cyber Security Industry Revenue Share (%), by Country 2024 & 2032
- Figure 14: Asia Pacific APAC Cyber Security Industry Volume Share (%), by Country 2024 & 2032
- Figure 15: Latin America APAC Cyber Security Industry Revenue (Million), by Country 2024 & 2032
- Figure 16: Latin America APAC Cyber Security Industry Volume (K Unit), by Country 2024 & 2032
- Figure 17: Latin America APAC Cyber Security Industry Revenue Share (%), by Country 2024 & 2032
- Figure 18: Latin America APAC Cyber Security Industry Volume Share (%), by Country 2024 & 2032
- Figure 19: Middle East and Africa APAC Cyber Security Industry Revenue (Million), by Country 2024 & 2032
- Figure 20: Middle East and Africa APAC Cyber Security Industry Volume (K Unit), by Country 2024 & 2032
- Figure 21: Middle East and Africa APAC Cyber Security Industry Revenue Share (%), by Country 2024 & 2032
- Figure 22: Middle East and Africa APAC Cyber Security Industry Volume Share (%), by Country 2024 & 2032
- Figure 23: North America APAC Cyber Security Industry Revenue (Million), by Product Type 2024 & 2032
- Figure 24: North America APAC Cyber Security Industry Volume (K Unit), by Product Type 2024 & 2032
- Figure 25: North America APAC Cyber Security Industry Revenue Share (%), by Product Type 2024 & 2032
- Figure 26: North America APAC Cyber Security Industry Volume Share (%), by Product Type 2024 & 2032
- Figure 27: North America APAC Cyber Security Industry Revenue (Million), by Deployment 2024 & 2032
- Figure 28: North America APAC Cyber Security Industry Volume (K Unit), by Deployment 2024 & 2032
- Figure 29: North America APAC Cyber Security Industry Revenue Share (%), by Deployment 2024 & 2032
- Figure 30: North America APAC Cyber Security Industry Volume Share (%), by Deployment 2024 & 2032
- Figure 31: North America APAC Cyber Security Industry Revenue (Million), by End-user Industry 2024 & 2032
- Figure 32: North America APAC Cyber Security Industry Volume (K Unit), by End-user Industry 2024 & 2032
- Figure 33: North America APAC Cyber Security Industry Revenue Share (%), by End-user Industry 2024 & 2032
- Figure 34: North America APAC Cyber Security Industry Volume Share (%), by End-user Industry 2024 & 2032
- Figure 35: North America APAC Cyber Security Industry Revenue (Million), by Country 2024 & 2032
- Figure 36: North America APAC Cyber Security Industry Volume (K Unit), by Country 2024 & 2032
- Figure 37: North America APAC Cyber Security Industry Revenue Share (%), by Country 2024 & 2032
- Figure 38: North America APAC Cyber Security Industry Volume Share (%), by Country 2024 & 2032
- Figure 39: South America APAC Cyber Security Industry Revenue (Million), by Product Type 2024 & 2032
- Figure 40: South America APAC Cyber Security Industry Volume (K Unit), by Product Type 2024 & 2032
- Figure 41: South America APAC Cyber Security Industry Revenue Share (%), by Product Type 2024 & 2032
- Figure 42: South America APAC Cyber Security Industry Volume Share (%), by Product Type 2024 & 2032
- Figure 43: South America APAC Cyber Security Industry Revenue (Million), by Deployment 2024 & 2032
- Figure 44: South America APAC Cyber Security Industry Volume (K Unit), by Deployment 2024 & 2032
- Figure 45: South America APAC Cyber Security Industry Revenue Share (%), by Deployment 2024 & 2032
- Figure 46: South America APAC Cyber Security Industry Volume Share (%), by Deployment 2024 & 2032
- Figure 47: South America APAC Cyber Security Industry Revenue (Million), by End-user Industry 2024 & 2032
- Figure 48: South America APAC Cyber Security Industry Volume (K Unit), by End-user Industry 2024 & 2032
- Figure 49: South America APAC Cyber Security Industry Revenue Share (%), by End-user Industry 2024 & 2032
- Figure 50: South America APAC Cyber Security Industry Volume Share (%), by End-user Industry 2024 & 2032
- Figure 51: South America APAC Cyber Security Industry Revenue (Million), by Country 2024 & 2032
- Figure 52: South America APAC Cyber Security Industry Volume (K Unit), by Country 2024 & 2032
- Figure 53: South America APAC Cyber Security Industry Revenue Share (%), by Country 2024 & 2032
- Figure 54: South America APAC Cyber Security Industry Volume Share (%), by Country 2024 & 2032
- Figure 55: Europe APAC Cyber Security Industry Revenue (Million), by Product Type 2024 & 2032
- Figure 56: Europe APAC Cyber Security Industry Volume (K Unit), by Product Type 2024 & 2032
- Figure 57: Europe APAC Cyber Security Industry Revenue Share (%), by Product Type 2024 & 2032
- Figure 58: Europe APAC Cyber Security Industry Volume Share (%), by Product Type 2024 & 2032
- Figure 59: Europe APAC Cyber Security Industry Revenue (Million), by Deployment 2024 & 2032
- Figure 60: Europe APAC Cyber Security Industry Volume (K Unit), by Deployment 2024 & 2032
- Figure 61: Europe APAC Cyber Security Industry Revenue Share (%), by Deployment 2024 & 2032
- Figure 62: Europe APAC Cyber Security Industry Volume Share (%), by Deployment 2024 & 2032
- Figure 63: Europe APAC Cyber Security Industry Revenue (Million), by End-user Industry 2024 & 2032
- Figure 64: Europe APAC Cyber Security Industry Volume (K Unit), by End-user Industry 2024 & 2032
- Figure 65: Europe APAC Cyber Security Industry Revenue Share (%), by End-user Industry 2024 & 2032
- Figure 66: Europe APAC Cyber Security Industry Volume Share (%), by End-user Industry 2024 & 2032
- Figure 67: Europe APAC Cyber Security Industry Revenue (Million), by Country 2024 & 2032
- Figure 68: Europe APAC Cyber Security Industry Volume (K Unit), by Country 2024 & 2032
- Figure 69: Europe APAC Cyber Security Industry Revenue Share (%), by Country 2024 & 2032
- Figure 70: Europe APAC Cyber Security Industry Volume Share (%), by Country 2024 & 2032
- Figure 71: Middle East & Africa APAC Cyber Security Industry Revenue (Million), by Product Type 2024 & 2032
- Figure 72: Middle East & Africa APAC Cyber Security Industry Volume (K Unit), by Product Type 2024 & 2032
- Figure 73: Middle East & Africa APAC Cyber Security Industry Revenue Share (%), by Product Type 2024 & 2032
- Figure 74: Middle East & Africa APAC Cyber Security Industry Volume Share (%), by Product Type 2024 & 2032
- Figure 75: Middle East & Africa APAC Cyber Security Industry Revenue (Million), by Deployment 2024 & 2032
- Figure 76: Middle East & Africa APAC Cyber Security Industry Volume (K Unit), by Deployment 2024 & 2032
- Figure 77: Middle East & Africa APAC Cyber Security Industry Revenue Share (%), by Deployment 2024 & 2032
- Figure 78: Middle East & Africa APAC Cyber Security Industry Volume Share (%), by Deployment 2024 & 2032
- Figure 79: Middle East & Africa APAC Cyber Security Industry Revenue (Million), by End-user Industry 2024 & 2032
- Figure 80: Middle East & Africa APAC Cyber Security Industry Volume (K Unit), by End-user Industry 2024 & 2032
- Figure 81: Middle East & Africa APAC Cyber Security Industry Revenue Share (%), by End-user Industry 2024 & 2032
- Figure 82: Middle East & Africa APAC Cyber Security Industry Volume Share (%), by End-user Industry 2024 & 2032
- Figure 83: Middle East & Africa APAC Cyber Security Industry Revenue (Million), by Country 2024 & 2032
- Figure 84: Middle East & Africa APAC Cyber Security Industry Volume (K Unit), by Country 2024 & 2032
- Figure 85: Middle East & Africa APAC Cyber Security Industry Revenue Share (%), by Country 2024 & 2032
- Figure 86: Middle East & Africa APAC Cyber Security Industry Volume Share (%), by Country 2024 & 2032
- Figure 87: Asia Pacific APAC Cyber Security Industry Revenue (Million), by Product Type 2024 & 2032
- Figure 88: Asia Pacific APAC Cyber Security Industry Volume (K Unit), by Product Type 2024 & 2032
- Figure 89: Asia Pacific APAC Cyber Security Industry Revenue Share (%), by Product Type 2024 & 2032
- Figure 90: Asia Pacific APAC Cyber Security Industry Volume Share (%), by Product Type 2024 & 2032
- Figure 91: Asia Pacific APAC Cyber Security Industry Revenue (Million), by Deployment 2024 & 2032
- Figure 92: Asia Pacific APAC Cyber Security Industry Volume (K Unit), by Deployment 2024 & 2032
- Figure 93: Asia Pacific APAC Cyber Security Industry Revenue Share (%), by Deployment 2024 & 2032
- Figure 94: Asia Pacific APAC Cyber Security Industry Volume Share (%), by Deployment 2024 & 2032
- Figure 95: Asia Pacific APAC Cyber Security Industry Revenue (Million), by End-user Industry 2024 & 2032
- Figure 96: Asia Pacific APAC Cyber Security Industry Volume (K Unit), by End-user Industry 2024 & 2032
- Figure 97: Asia Pacific APAC Cyber Security Industry Revenue Share (%), by End-user Industry 2024 & 2032
- Figure 98: Asia Pacific APAC Cyber Security Industry Volume Share (%), by End-user Industry 2024 & 2032
- Figure 99: Asia Pacific APAC Cyber Security Industry Revenue (Million), by Country 2024 & 2032
- Figure 100: Asia Pacific APAC Cyber Security Industry Volume (K Unit), by Country 2024 & 2032
- Figure 101: Asia Pacific APAC Cyber Security Industry Revenue Share (%), by Country 2024 & 2032
- Figure 102: Asia Pacific APAC Cyber Security Industry Volume Share (%), by Country 2024 & 2032
List of Tables
- Table 1: Global APAC Cyber Security Industry Revenue Million Forecast, by Region 2019 & 2032
- Table 2: Global APAC Cyber Security Industry Volume K Unit Forecast, by Region 2019 & 2032
- Table 3: Global APAC Cyber Security Industry Revenue Million Forecast, by Product Type 2019 & 2032
- Table 4: Global APAC Cyber Security Industry Volume K Unit Forecast, by Product Type 2019 & 2032
- Table 5: Global APAC Cyber Security Industry Revenue Million Forecast, by Deployment 2019 & 2032
- Table 6: Global APAC Cyber Security Industry Volume K Unit Forecast, by Deployment 2019 & 2032
- Table 7: Global APAC Cyber Security Industry Revenue Million Forecast, by End-user Industry 2019 & 2032
- Table 8: Global APAC Cyber Security Industry Volume K Unit Forecast, by End-user Industry 2019 & 2032
- Table 9: Global APAC Cyber Security Industry Revenue Million Forecast, by Region 2019 & 2032
- Table 10: Global APAC Cyber Security Industry Volume K Unit Forecast, by Region 2019 & 2032
- Table 11: Global APAC Cyber Security Industry Revenue Million Forecast, by Country 2019 & 2032
- Table 12: Global APAC Cyber Security Industry Volume K Unit Forecast, by Country 2019 & 2032
- Table 13: APAC Cyber Security Industry Revenue (Million) Forecast, by Application 2019 & 2032
- Table 14: APAC Cyber Security Industry Volume (K Unit) Forecast, by Application 2019 & 2032
- Table 15: Global APAC Cyber Security Industry Revenue Million Forecast, by Country 2019 & 2032
- Table 16: Global APAC Cyber Security Industry Volume K Unit Forecast, by Country 2019 & 2032
- Table 17: APAC Cyber Security Industry Revenue (Million) Forecast, by Application 2019 & 2032
- Table 18: APAC Cyber Security Industry Volume (K Unit) Forecast, by Application 2019 & 2032
- Table 19: Global APAC Cyber Security Industry Revenue Million Forecast, by Country 2019 & 2032
- Table 20: Global APAC Cyber Security Industry Volume K Unit Forecast, by Country 2019 & 2032
- Table 21: APAC Cyber Security Industry Revenue (Million) Forecast, by Application 2019 & 2032
- Table 22: APAC Cyber Security Industry Volume (K Unit) Forecast, by Application 2019 & 2032
- Table 23: Global APAC Cyber Security Industry Revenue Million Forecast, by Country 2019 & 2032
- Table 24: Global APAC Cyber Security Industry Volume K Unit Forecast, by Country 2019 & 2032
- Table 25: APAC Cyber Security Industry Revenue (Million) Forecast, by Application 2019 & 2032
- Table 26: APAC Cyber Security Industry Volume (K Unit) Forecast, by Application 2019 & 2032
- Table 27: Global APAC Cyber Security Industry Revenue Million Forecast, by Country 2019 & 2032
- Table 28: Global APAC Cyber Security Industry Volume K Unit Forecast, by Country 2019 & 2032
- Table 29: APAC Cyber Security Industry Revenue (Million) Forecast, by Application 2019 & 2032
- Table 30: APAC Cyber Security Industry Volume (K Unit) Forecast, by Application 2019 & 2032
- Table 31: Global APAC Cyber Security Industry Revenue Million Forecast, by Product Type 2019 & 2032
- Table 32: Global APAC Cyber Security Industry Volume K Unit Forecast, by Product Type 2019 & 2032
- Table 33: Global APAC Cyber Security Industry Revenue Million Forecast, by Deployment 2019 & 2032
- Table 34: Global APAC Cyber Security Industry Volume K Unit Forecast, by Deployment 2019 & 2032
- Table 35: Global APAC Cyber Security Industry Revenue Million Forecast, by End-user Industry 2019 & 2032
- Table 36: Global APAC Cyber Security Industry Volume K Unit Forecast, by End-user Industry 2019 & 2032
- Table 37: Global APAC Cyber Security Industry Revenue Million Forecast, by Country 2019 & 2032
- Table 38: Global APAC Cyber Security Industry Volume K Unit Forecast, by Country 2019 & 2032
- Table 39: United States APAC Cyber Security Industry Revenue (Million) Forecast, by Application 2019 & 2032
- Table 40: United States APAC Cyber Security Industry Volume (K Unit) Forecast, by Application 2019 & 2032
- Table 41: Canada APAC Cyber Security Industry Revenue (Million) Forecast, by Application 2019 & 2032
- Table 42: Canada APAC Cyber Security Industry Volume (K Unit) Forecast, by Application 2019 & 2032
- Table 43: Mexico APAC Cyber Security Industry Revenue (Million) Forecast, by Application 2019 & 2032
- Table 44: Mexico APAC Cyber Security Industry Volume (K Unit) Forecast, by Application 2019 & 2032
- Table 45: Global APAC Cyber Security Industry Revenue Million Forecast, by Product Type 2019 & 2032
- Table 46: Global APAC Cyber Security Industry Volume K Unit Forecast, by Product Type 2019 & 2032
- Table 47: Global APAC Cyber Security Industry Revenue Million Forecast, by Deployment 2019 & 2032
- Table 48: Global APAC Cyber Security Industry Volume K Unit Forecast, by Deployment 2019 & 2032
- Table 49: Global APAC Cyber Security Industry Revenue Million Forecast, by End-user Industry 2019 & 2032
- Table 50: Global APAC Cyber Security Industry Volume K Unit Forecast, by End-user Industry 2019 & 2032
- Table 51: Global APAC Cyber Security Industry Revenue Million Forecast, by Country 2019 & 2032
- Table 52: Global APAC Cyber Security Industry Volume K Unit Forecast, by Country 2019 & 2032
- Table 53: Brazil APAC Cyber Security Industry Revenue (Million) Forecast, by Application 2019 & 2032
- Table 54: Brazil APAC Cyber Security Industry Volume (K Unit) Forecast, by Application 2019 & 2032
- Table 55: Argentina APAC Cyber Security Industry Revenue (Million) Forecast, by Application 2019 & 2032
- Table 56: Argentina APAC Cyber Security Industry Volume (K Unit) Forecast, by Application 2019 & 2032
- Table 57: Rest of South America APAC Cyber Security Industry Revenue (Million) Forecast, by Application 2019 & 2032
- Table 58: Rest of South America APAC Cyber Security Industry Volume (K Unit) Forecast, by Application 2019 & 2032
- Table 59: Global APAC Cyber Security Industry Revenue Million Forecast, by Product Type 2019 & 2032
- Table 60: Global APAC Cyber Security Industry Volume K Unit Forecast, by Product Type 2019 & 2032
- Table 61: Global APAC Cyber Security Industry Revenue Million Forecast, by Deployment 2019 & 2032
- Table 62: Global APAC Cyber Security Industry Volume K Unit Forecast, by Deployment 2019 & 2032
- Table 63: Global APAC Cyber Security Industry Revenue Million Forecast, by End-user Industry 2019 & 2032
- Table 64: Global APAC Cyber Security Industry Volume K Unit Forecast, by End-user Industry 2019 & 2032
- Table 65: Global APAC Cyber Security Industry Revenue Million Forecast, by Country 2019 & 2032
- Table 66: Global APAC Cyber Security Industry Volume K Unit Forecast, by Country 2019 & 2032
- Table 67: United Kingdom APAC Cyber Security Industry Revenue (Million) Forecast, by Application 2019 & 2032
- Table 68: United Kingdom APAC Cyber Security Industry Volume (K Unit) Forecast, by Application 2019 & 2032
- Table 69: Germany APAC Cyber Security Industry Revenue (Million) Forecast, by Application 2019 & 2032
- Table 70: Germany APAC Cyber Security Industry Volume (K Unit) Forecast, by Application 2019 & 2032
- Table 71: France APAC Cyber Security Industry Revenue (Million) Forecast, by Application 2019 & 2032
- Table 72: France APAC Cyber Security Industry Volume (K Unit) Forecast, by Application 2019 & 2032
- Table 73: Italy APAC Cyber Security Industry Revenue (Million) Forecast, by Application 2019 & 2032
- Table 74: Italy APAC Cyber Security Industry Volume (K Unit) Forecast, by Application 2019 & 2032
- Table 75: Spain APAC Cyber Security Industry Revenue (Million) Forecast, by Application 2019 & 2032
- Table 76: Spain APAC Cyber Security Industry Volume (K Unit) Forecast, by Application 2019 & 2032
- Table 77: Russia APAC Cyber Security Industry Revenue (Million) Forecast, by Application 2019 & 2032
- Table 78: Russia APAC Cyber Security Industry Volume (K Unit) Forecast, by Application 2019 & 2032
- Table 79: Benelux APAC Cyber Security Industry Revenue (Million) Forecast, by Application 2019 & 2032
- Table 80: Benelux APAC Cyber Security Industry Volume (K Unit) Forecast, by Application 2019 & 2032
- Table 81: Nordics APAC Cyber Security Industry Revenue (Million) Forecast, by Application 2019 & 2032
- Table 82: Nordics APAC Cyber Security Industry Volume (K Unit) Forecast, by Application 2019 & 2032
- Table 83: Rest of Europe APAC Cyber Security Industry Revenue (Million) Forecast, by Application 2019 & 2032
- Table 84: Rest of Europe APAC Cyber Security Industry Volume (K Unit) Forecast, by Application 2019 & 2032
- Table 85: Global APAC Cyber Security Industry Revenue Million Forecast, by Product Type 2019 & 2032
- Table 86: Global APAC Cyber Security Industry Volume K Unit Forecast, by Product Type 2019 & 2032
- Table 87: Global APAC Cyber Security Industry Revenue Million Forecast, by Deployment 2019 & 2032
- Table 88: Global APAC Cyber Security Industry Volume K Unit Forecast, by Deployment 2019 & 2032
- Table 89: Global APAC Cyber Security Industry Revenue Million Forecast, by End-user Industry 2019 & 2032
- Table 90: Global APAC Cyber Security Industry Volume K Unit Forecast, by End-user Industry 2019 & 2032
- Table 91: Global APAC Cyber Security Industry Revenue Million Forecast, by Country 2019 & 2032
- Table 92: Global APAC Cyber Security Industry Volume K Unit Forecast, by Country 2019 & 2032
- Table 93: Turkey APAC Cyber Security Industry Revenue (Million) Forecast, by Application 2019 & 2032
- Table 94: Turkey APAC Cyber Security Industry Volume (K Unit) Forecast, by Application 2019 & 2032
- Table 95: Israel APAC Cyber Security Industry Revenue (Million) Forecast, by Application 2019 & 2032
- Table 96: Israel APAC Cyber Security Industry Volume (K Unit) Forecast, by Application 2019 & 2032
- Table 97: GCC APAC Cyber Security Industry Revenue (Million) Forecast, by Application 2019 & 2032
- Table 98: GCC APAC Cyber Security Industry Volume (K Unit) Forecast, by Application 2019 & 2032
- Table 99: North Africa APAC Cyber Security Industry Revenue (Million) Forecast, by Application 2019 & 2032
- Table 100: North Africa APAC Cyber Security Industry Volume (K Unit) Forecast, by Application 2019 & 2032
- Table 101: South Africa APAC Cyber Security Industry Revenue (Million) Forecast, by Application 2019 & 2032
- Table 102: South Africa APAC Cyber Security Industry Volume (K Unit) Forecast, by Application 2019 & 2032
- Table 103: Rest of Middle East & Africa APAC Cyber Security Industry Revenue (Million) Forecast, by Application 2019 & 2032
- Table 104: Rest of Middle East & Africa APAC Cyber Security Industry Volume (K Unit) Forecast, by Application 2019 & 2032
- Table 105: Global APAC Cyber Security Industry Revenue Million Forecast, by Product Type 2019 & 2032
- Table 106: Global APAC Cyber Security Industry Volume K Unit Forecast, by Product Type 2019 & 2032
- Table 107: Global APAC Cyber Security Industry Revenue Million Forecast, by Deployment 2019 & 2032
- Table 108: Global APAC Cyber Security Industry Volume K Unit Forecast, by Deployment 2019 & 2032
- Table 109: Global APAC Cyber Security Industry Revenue Million Forecast, by End-user Industry 2019 & 2032
- Table 110: Global APAC Cyber Security Industry Volume K Unit Forecast, by End-user Industry 2019 & 2032
- Table 111: Global APAC Cyber Security Industry Revenue Million Forecast, by Country 2019 & 2032
- Table 112: Global APAC Cyber Security Industry Volume K Unit Forecast, by Country 2019 & 2032
- Table 113: China APAC Cyber Security Industry Revenue (Million) Forecast, by Application 2019 & 2032
- Table 114: China APAC Cyber Security Industry Volume (K Unit) Forecast, by Application 2019 & 2032
- Table 115: India APAC Cyber Security Industry Revenue (Million) Forecast, by Application 2019 & 2032
- Table 116: India APAC Cyber Security Industry Volume (K Unit) Forecast, by Application 2019 & 2032
- Table 117: Japan APAC Cyber Security Industry Revenue (Million) Forecast, by Application 2019 & 2032
- Table 118: Japan APAC Cyber Security Industry Volume (K Unit) Forecast, by Application 2019 & 2032
- Table 119: South Korea APAC Cyber Security Industry Revenue (Million) Forecast, by Application 2019 & 2032
- Table 120: South Korea APAC Cyber Security Industry Volume (K Unit) Forecast, by Application 2019 & 2032
- Table 121: ASEAN APAC Cyber Security Industry Revenue (Million) Forecast, by Application 2019 & 2032
- Table 122: ASEAN APAC Cyber Security Industry Volume (K Unit) Forecast, by Application 2019 & 2032
- Table 123: Oceania APAC Cyber Security Industry Revenue (Million) Forecast, by Application 2019 & 2032
- Table 124: Oceania APAC Cyber Security Industry Volume (K Unit) Forecast, by Application 2019 & 2032
- Table 125: Rest of Asia Pacific APAC Cyber Security Industry Revenue (Million) Forecast, by Application 2019 & 2032
- Table 126: Rest of Asia Pacific APAC Cyber Security Industry Volume (K Unit) Forecast, by Application 2019 & 2032
Frequently Asked Questions
1. What is the projected Compound Annual Growth Rate (CAGR) of the APAC Cyber Security Industry?
The projected CAGR is approximately 13.70%.
2. Which companies are prominent players in the APAC Cyber Security Industry?
Key companies in the market include AVG Technologies (Avast Software s r o ), IBM Corporation, Trend Micro Inc , Fortinet Inc, Imperva Inc, Check Point Software Technologies Ltd, Cisco Systems Inc, Broadcom Inc, Proofpoint Inc, Rapid7 Inc, Cyber Ark Software Ltd, Intel Security (Intel Corporation), Dell Technologies Inc, Fireeye Inc, Palo Alto Networks Inc.
3. What are the main segments of the APAC Cyber Security Industry?
The market segments include Product Type, Deployment, End-user Industry.
4. Can you provide details about the market size?
The market size is estimated to be USD 65.28 Million as of 2022.
5. What are some drivers contributing to market growth?
Rapidly Increasing Cybersecurity Incidents and Regulations Requiring Their Reporting; Growing M2M/IoT Connections Demanding Strengthened Cybersecurity in Enterprises.
6. What are the notable trends driving market growth?
Cloud Deployment Drives Market Growth.
7. Are there any restraints impacting market growth?
Lack of Cybersecurity Professionals; High Reliance on Traditional Authentication Methods and Low Preparedness.
8. Can you provide examples of recent developments in the market?
December 2022: VI Business introduced VI Secure, a new cybersecurity offering for enterprises, which has been developed as a complete cybersecurity portfolio with various trustworthy solutions that protect against several threats originating from networks, clouds, and endpoints in India. Additionally, the company has planned to provide email, web, and virtualized firewall protection using Cisco's FirstWave CyberCision platform.
9. What pricing options are available for accessing the report?
Pricing options include single-user, multi-user, and enterprise licenses priced at USD 3800, USD 4500, and USD 5800 respectively.
10. Is the market size provided in terms of value or volume?
The market size is provided in terms of value, measured in Million and volume, measured in K Unit.
11. Are there any specific market keywords associated with the report?
Yes, the market keyword associated with the report is "APAC Cyber Security Industry," which aids in identifying and referencing the specific market segment covered.
12. How do I determine which pricing option suits my needs best?
The pricing options vary based on user requirements and access needs. Individual users may opt for single-user licenses, while businesses requiring broader access may choose multi-user or enterprise licenses for cost-effective access to the report.
13. Are there any additional resources or data provided in the APAC Cyber Security Industry report?
While the report offers comprehensive insights, it's advisable to review the specific contents or supplementary materials provided to ascertain if additional resources or data are available.
14. How can I stay updated on further developments or reports in the APAC Cyber Security Industry?
To stay informed about further developments, trends, and reports in the APAC Cyber Security Industry, consider subscribing to industry newsletters, following relevant companies and organizations, or regularly checking reputable industry news sources and publications.
Methodology
Step 1 - Identification of Relevant Samples Size from Population Database


Step 2 - Approaches for Defining Global Market Size (Value, Volume* & Price*)

Note*: In applicable scenarios
Step 3 - Data Sources
Primary Research
- Web Analytics
- Survey Reports
- Research Institute
- Latest Research Reports
- Opinion Leaders
Secondary Research
- Annual Reports
- White Paper
- Latest Press Release
- Industry Association
- Paid Database
- Investor Presentations

Step 4 - Data Triangulation
Involves using different sources of information in order to increase the validity of a study
These sources are likely to be stakeholders in a program - participants, other researchers, program staff, other community members, and so on.
Then we put all data in single framework & apply various statistical tools to find out the dynamic on the market.
During the analysis stage, feedback from the stakeholder groups would be compared to determine areas of agreement as well as areas of divergence


