
Key Insights
The Asia-Pacific (APAC) green data center market is experiencing robust growth, driven by increasing energy costs, stringent environmental regulations, and the rising adoption of cloud computing and digital transformation initiatives across various industries. The region's burgeoning economies, particularly in China, India, and Japan, are significantly contributing to this expansion. The market's strong Compound Annual Growth Rate (CAGR) of 20.87% indicates a substantial increase in demand for energy-efficient data center solutions. Key drivers include the growing need for sustainable IT infrastructure, government incentives promoting green technologies, and the increasing awareness among businesses about their environmental footprint. Furthermore, advancements in cooling technologies, renewable energy integration, and efficient power management systems are fueling market expansion. While the market faces challenges like high initial investment costs for green technologies and the need for skilled professionals to implement and maintain these systems, the long-term benefits of reduced operational expenses and improved brand image outweigh these restraints. The market segmentation highlights the significant contributions of various services (system integration, monitoring, professional services), solutions (power, servers, management software), users (colocation providers, cloud service providers, enterprises), and end-user industries (healthcare, financial services, government, telecom). This diverse landscape suggests significant opportunities for both established players and new entrants. The APAC region's diverse economic landscape and varying levels of technological adoption across countries present both opportunities and complexities for businesses operating in this market.
The APAC green data center market is poised for continued expansion throughout the forecast period (2025-2033). While precise figures for market size in specific years are unavailable, we can project logical growth based on the provided CAGR. The dominance of specific countries like China and India will continue, driven by their large and rapidly growing IT sectors. The market's evolution will be shaped by further technological advancements, including artificial intelligence-powered optimization of energy consumption, advancements in liquid cooling, and wider adoption of renewable energy sources within data centers. The increasing focus on data sovereignty and localized data processing will also influence market trends, creating further opportunities for regionally focused service providers. Competitive pressures will likely increase, with established players focusing on innovation and expansion while new companies enter the market with niche offerings. Regulatory frameworks aimed at promoting sustainable practices will play a critical role in shaping the trajectory of this rapidly evolving market.
APAC Green Data Center Market Report: 2019-2033
This comprehensive report provides an in-depth analysis of the Asia-Pacific (APAC) green data center market, offering invaluable insights for industry professionals, investors, and strategic decision-makers. Covering the period from 2019 to 2033, with a base year of 2025, this report unveils the market's structure, dynamics, key players, and future outlook. It leverages robust data and analysis to forecast market growth and identify lucrative opportunities within this rapidly expanding sector.
APAC Green Data Center Market Structure & Innovation Trends
This section analyzes the competitive landscape of the APAC green data center market, exploring market concentration, innovation drivers, regulatory frameworks, and key industry developments. The study period is 2019-2033, with 2025 as the base and estimated year.
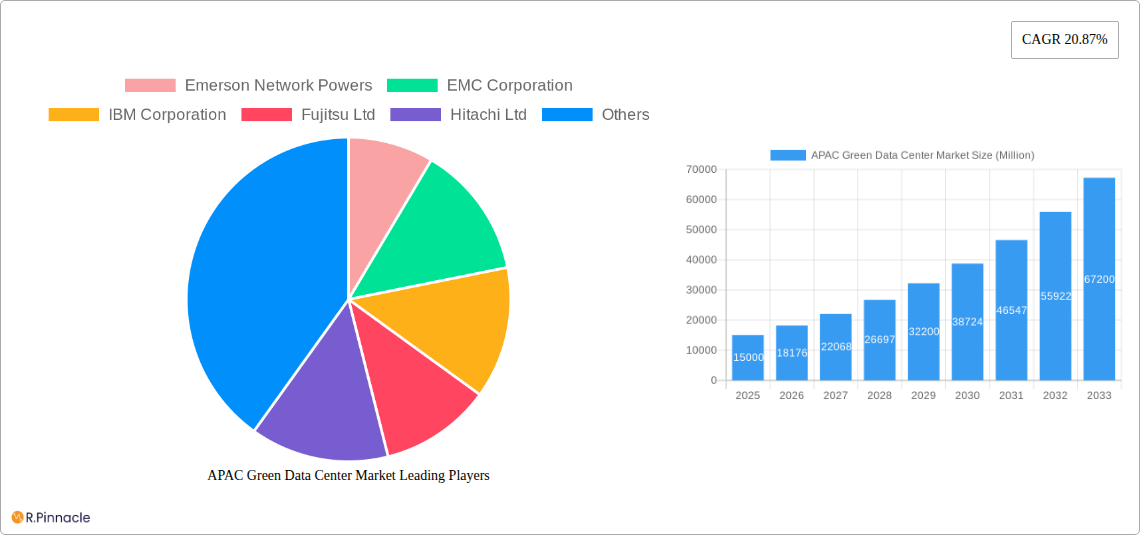
The market exhibits a moderately concentrated structure with several key players commanding significant market share. Emerson Network Powers, EMC Corporation, IBM Corporation, Fujitsu Ltd, Hitachi Ltd, Schneider Electric SE, HP Inc, Dell Inc, Cisco Technology Inc, GoGrid LLC, and Eaton Corporation are prominent examples. While precise market share figures are proprietary to the full report, analysis reveals a dynamic competitive environment with ongoing mergers and acquisitions (M&A) impacting the market landscape. Recent M&A deals, while not publicly disclosed in specific monetary values (xx Million), demonstrate aggressive consolidation amongst major players seeking to enhance their product portfolios and geographical reach.
- Innovation Drivers: Stringent environmental regulations, the rising adoption of sustainable technologies, and increasing demand for energy-efficient data center solutions are key drivers of innovation.
- Regulatory Frameworks: Government initiatives promoting renewable energy sources and sustainable infrastructure are shaping the market, particularly in countries like China, India, and Japan.
- Product Substitutes: While there are no direct substitutes for green data center technologies, the market faces competition from traditional data centers that are not as energy efficient.
- End-User Demographics: The APAC green data center market is primarily driven by the growing needs of colocation providers, cloud service providers, and large enterprises across diverse industries.
- M&A Activity: Significant M&A activity is reshaping the market, leading to increased consolidation and potentially higher barriers to entry for smaller companies.
APAC Green Data Center Market Dynamics & Trends
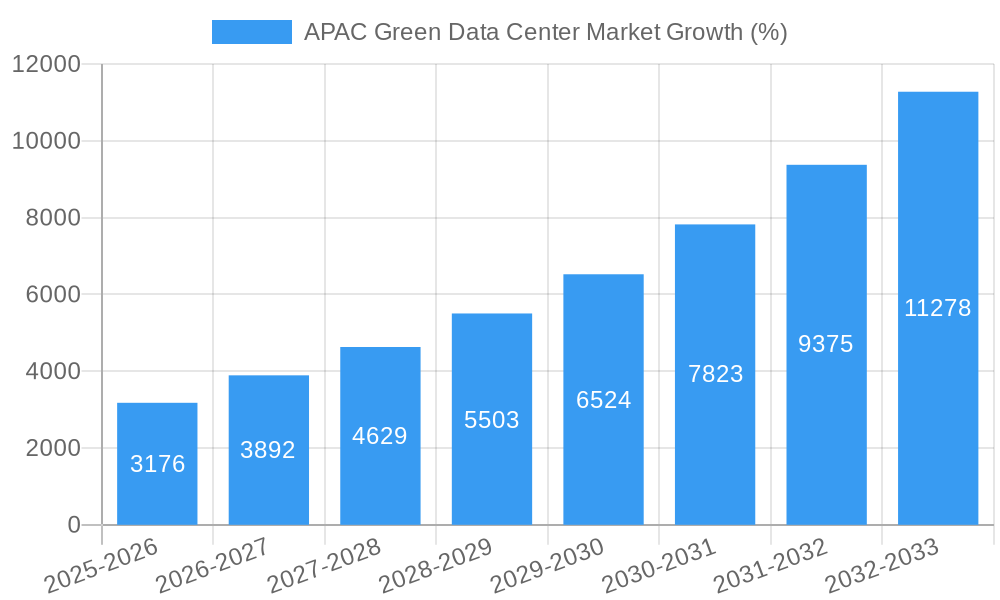
The APAC green data center market is experiencing robust growth, driven by factors such as the increasing adoption of cloud computing, rising digitalization across industries, and escalating concerns regarding environmental sustainability. The market is expected to witness a Compound Annual Growth Rate (CAGR) of xx% during the forecast period (2025-2033). This growth is further fueled by technological advancements in areas like liquid immersion cooling, AI-powered energy management systems, and renewable energy integration.
Market penetration of green data center technologies is steadily increasing, particularly in major economies like China and India. However, challenges remain in terms of infrastructure development, high upfront investment costs, and the need for skilled workforce to manage these sophisticated systems. Competitive dynamics are intense, with established players vying for market share and new entrants leveraging innovative technologies to gain traction. Consumer preferences are shifting towards environmentally friendly and energy-efficient data center solutions, further bolstering market growth.
Dominant Regions & Segments in APAC Green Data Center Market
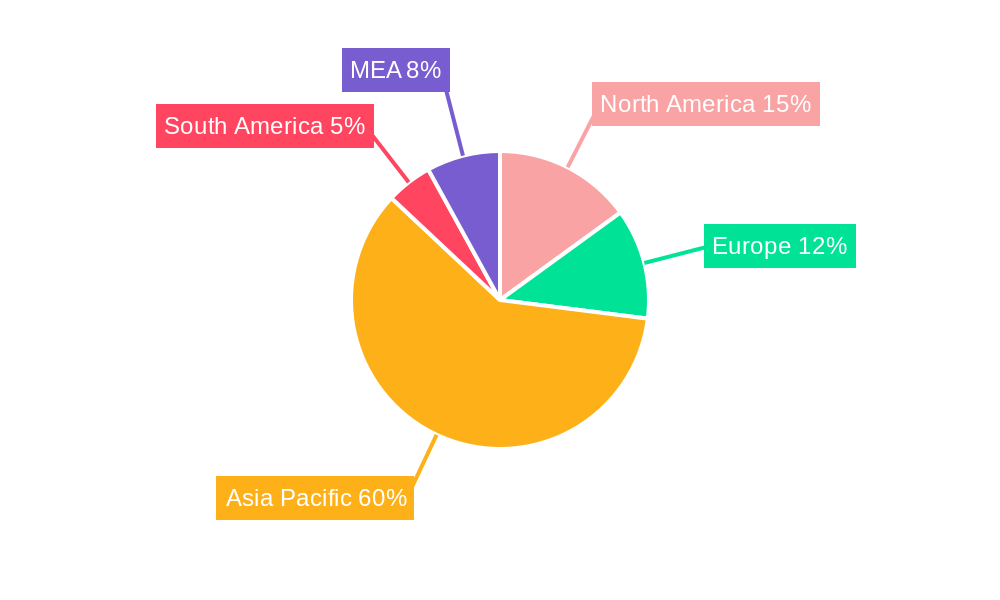
China dominates the APAC green data center market, driven by significant investments in infrastructure, supportive government policies, and the burgeoning digital economy. India is another rapidly growing market, fueled by its expanding IT sector and increasing demand for cloud services. Japan and South Korea also contribute significantly to the market’s overall growth.
Key Drivers by Region:
- China: Government initiatives promoting renewable energy, substantial investments in digital infrastructure, and the large presence of major technology companies.
- India: Rapid growth of the IT sector, rising demand for cloud services, and government focus on digital transformation.
- Japan: High levels of technological innovation, strong focus on energy efficiency, and mature IT infrastructure.
- South Korea: Advanced technology adoption, strong presence of global technology companies, and government support for green technologies.
- Rest of Asia Pacific: Steady growth driven by increasing digitalization and government investments in infrastructure.
Dominant Segments:
- By Services: System Integration holds the largest market share due to the complexity of green data center deployments.
- By Solutions: Power solutions dominate, owing to the high energy consumption of data centers.
- By Users: Cloud Service Providers and Colocation Providers are major users, driving demand for scalable and efficient infrastructure.
- By End-user Industries: The Telecom and IT sector is the leading end-user industry, followed by Financial Services and Healthcare.
APAC Green Data Center Market Product Innovations
Recent advancements in liquid immersion cooling, AI-driven energy management, and renewable energy integration are significantly impacting the market. These innovations offer improved energy efficiency, reduced carbon footprint, and enhanced operational efficiency. The market is witnessing a surge in products that combine these technologies to offer comprehensive green data center solutions tailored to the specific needs of different end-users. This trend aligns with the growing demand for sustainable and environmentally responsible data center operations.
Report Scope & Segmentation Analysis
This report segments the APAC green data center market by Services (System Integration, Monitoring Services, Professional Services, Other Services), Solutions (Power, Servers, Management Software, Networking Technologies, Cooling, Other Solutions), Users (Colocation Providers, Cloud Service Providers, Enterprises), End-user Industries (Healthcare, Financial Services, Government, Telecom and IT, Other Industries), and Country (China, India, Japan, South Korea, Rest of Asia Pacific). Each segment's growth projections, market size, and competitive dynamics are meticulously analyzed, providing a comprehensive understanding of the market's structure and potential. The report projects substantial growth across all segments during the forecast period, driven by factors such as increasing digitization, growing cloud adoption, and the rising need for sustainable data center infrastructure.
Key Drivers of APAC Green Data Center Market Growth
The APAC green data center market is fueled by several key factors: the escalating adoption of cloud computing and big data analytics, stringent environmental regulations promoting sustainable practices, government support for renewable energy initiatives, and the growing awareness of environmental sustainability among businesses. These factors are creating significant demand for energy-efficient and eco-friendly data center solutions across various industries. Furthermore, advancements in cooling technologies and energy management systems are contributing to the market's growth.
Challenges in the APAC Green Data Center Market Sector
Despite its immense potential, the APAC green data center market faces challenges including the high initial investment costs associated with implementing green technologies, the lack of skilled professionals to manage and maintain these complex systems, and potential supply chain disruptions. Furthermore, varying regulatory frameworks across different countries can create complexities for businesses operating across the region. These hurdles can impact market growth and necessitate strategic planning and adaptation from market players.
Emerging Opportunities in APAP Green Data Center Market
The market presents compelling opportunities for companies offering innovative solutions such as AI-powered energy optimization, advanced cooling systems, and integration of renewable energy sources. The rising demand for edge computing and the growth of hyperscale data centers are also creating new market opportunities. Moreover, the increasing focus on data center sustainability presents significant potential for companies developing and implementing eco-friendly data center solutions.
Leading Players in the APAC Green Data Center Market Market
- Emerson Network Power
- EMC Corporation
- IBM Corporation
- Fujitsu Ltd
- Hitachi Ltd
- Schneider Electric SE
- HP Inc
- Dell Inc
- Cisco Technology Inc
- GoGrid LLC
- Eaton Corporation
Key Developments in APAC Green Data Center Market Industry
- October 2022: PhonePe launched its first green data center in India using liquid immersion technology with Dell Technologies and NTT Ltd., significantly reducing its carbon footprint.
- April 2022: YTL Power International Berhad and GDS Holdings Limited partnered to develop a 168MW green data center park in Johor, Malaysia, with the first phase launching in 2024.
Future Outlook for APAC Green Data Center Market Market
The APAC green data center market is poised for substantial growth in the coming years. Driven by increasing digitalization, stringent environmental regulations, and technological advancements, the market is expected to witness significant expansion. Companies that can effectively leverage innovative technologies, offer tailored solutions, and navigate regulatory complexities will be best positioned to capitalize on the abundant growth opportunities within this dynamic market. The focus on sustainability and energy efficiency will continue to shape the industry's trajectory, driving further innovation and market expansion.
APAC Green Data Center Market Segmentation
-
1. Services
- 1.1. System Integration
- 1.2. Monitoring Services
- 1.3. Professional Services
- 1.4. Other Services
-
2. Solutions
- 2.1. Power
- 2.2. Servers
- 2.3. Management Software
- 2.4. Networking Technologies
- 2.5. Cooling
- 2.6. Other Solutions
-
3. Users
- 3.1. Colocation Providers
- 3.2. Cloud Service Providers
- 3.3. Enterprises
-
4. End-user Industries
- 4.1. Healthcare
- 4.2. Financial Services
- 4.3. Government
- 4.4. Telecom and IT
- 4.5. Other Industries
APAC Green Data Center Market Segmentation By Geography
-
1. North America
- 1.1. United States
- 1.2. Canada
- 1.3. Mexico
-
2. South America
- 2.1. Brazil
- 2.2. Argentina
- 2.3. Rest of South America
-
3. Europe
- 3.1. United Kingdom
- 3.2. Germany
- 3.3. France
- 3.4. Italy
- 3.5. Spain
- 3.6. Russia
- 3.7. Benelux
- 3.8. Nordics
- 3.9. Rest of Europe
-
4. Middle East & Africa
- 4.1. Turkey
- 4.2. Israel
- 4.3. GCC
- 4.4. North Africa
- 4.5. South Africa
- 4.6. Rest of Middle East & Africa
-
5. Asia Pacific
- 5.1. China
- 5.2. India
- 5.3. Japan
- 5.4. South Korea
- 5.5. ASEAN
- 5.6. Oceania
- 5.7. Rest of Asia Pacific
APAC Green Data Center Market REPORT HIGHLIGHTS
| Aspects | Details |
|---|---|
| Study Period | 2019-2033 |
| Base Year | 2024 |
| Estimated Year | 2025 |
| Forecast Period | 2025-2033 |
| Historical Period | 2019-2024 |
| Growth Rate | CAGR of 20.87% from 2019-2033 |
| Segmentation |
|
Table of Contents
- 1. Introduction
- 1.1. Research Scope
- 1.2. Market Segmentation
- 1.3. Research Methodology
- 1.4. Definitions and Assumptions
- 2. Executive Summary
- 2.1. Introduction
- 3. Market Dynamics
- 3.1. Introduction
- 3.2. Market Drivers
- 3.2.1. Increasing use of Cloud Managed Infrastructure Services; Technological Proliferation and Advancement of Cloud Based Technology Boosting the Demand; Improved cost and Operational Efficiency and Update of Outdated Hardware
- 3.3. Market Restrains
- 3.3.1. Declining Profit Margins and Integration and Reliability Concerns
- 3.4. Market Trends
- 3.4.1. Rise in Electricity Prices Affecting the Market Negatively
- 4. Market Factor Analysis
- 4.1. Porters Five Forces
- 4.2. Supply/Value Chain
- 4.3. PESTEL analysis
- 4.4. Market Entropy
- 4.5. Patent/Trademark Analysis
- 5. Global APAC Green Data Center Market Analysis, Insights and Forecast, 2019-2031
- 5.1. Market Analysis, Insights and Forecast - by Services
- 5.1.1. System Integration
- 5.1.2. Monitoring Services
- 5.1.3. Professional Services
- 5.1.4. Other Services
- 5.2. Market Analysis, Insights and Forecast - by Solutions
- 5.2.1. Power
- 5.2.2. Servers
- 5.2.3. Management Software
- 5.2.4. Networking Technologies
- 5.2.5. Cooling
- 5.2.6. Other Solutions
- 5.3. Market Analysis, Insights and Forecast - by Users
- 5.3.1. Colocation Providers
- 5.3.2. Cloud Service Providers
- 5.3.3. Enterprises
- 5.4. Market Analysis, Insights and Forecast - by End-user Industries
- 5.4.1. Healthcare
- 5.4.2. Financial Services
- 5.4.3. Government
- 5.4.4. Telecom and IT
- 5.4.5. Other Industries
- 5.5. Market Analysis, Insights and Forecast - by Region
- 5.5.1. North America
- 5.5.2. South America
- 5.5.3. Europe
- 5.5.4. Middle East & Africa
- 5.5.5. Asia Pacific
- 5.1. Market Analysis, Insights and Forecast - by Services
- 6. North America APAC Green Data Center Market Analysis, Insights and Forecast, 2019-2031
- 6.1. Market Analysis, Insights and Forecast - by Services
- 6.1.1. System Integration
- 6.1.2. Monitoring Services
- 6.1.3. Professional Services
- 6.1.4. Other Services
- 6.2. Market Analysis, Insights and Forecast - by Solutions
- 6.2.1. Power
- 6.2.2. Servers
- 6.2.3. Management Software
- 6.2.4. Networking Technologies
- 6.2.5. Cooling
- 6.2.6. Other Solutions
- 6.3. Market Analysis, Insights and Forecast - by Users
- 6.3.1. Colocation Providers
- 6.3.2. Cloud Service Providers
- 6.3.3. Enterprises
- 6.4. Market Analysis, Insights and Forecast - by End-user Industries
- 6.4.1. Healthcare
- 6.4.2. Financial Services
- 6.4.3. Government
- 6.4.4. Telecom and IT
- 6.4.5. Other Industries
- 6.1. Market Analysis, Insights and Forecast - by Services
- 7. South America APAC Green Data Center Market Analysis, Insights and Forecast, 2019-2031
- 7.1. Market Analysis, Insights and Forecast - by Services
- 7.1.1. System Integration
- 7.1.2. Monitoring Services
- 7.1.3. Professional Services
- 7.1.4. Other Services
- 7.2. Market Analysis, Insights and Forecast - by Solutions
- 7.2.1. Power
- 7.2.2. Servers
- 7.2.3. Management Software
- 7.2.4. Networking Technologies
- 7.2.5. Cooling
- 7.2.6. Other Solutions
- 7.3. Market Analysis, Insights and Forecast - by Users
- 7.3.1. Colocation Providers
- 7.3.2. Cloud Service Providers
- 7.3.3. Enterprises
- 7.4. Market Analysis, Insights and Forecast - by End-user Industries
- 7.4.1. Healthcare
- 7.4.2. Financial Services
- 7.4.3. Government
- 7.4.4. Telecom and IT
- 7.4.5. Other Industries
- 7.1. Market Analysis, Insights and Forecast - by Services
- 8. Europe APAC Green Data Center Market Analysis, Insights and Forecast, 2019-2031
- 8.1. Market Analysis, Insights and Forecast - by Services
- 8.1.1. System Integration
- 8.1.2. Monitoring Services
- 8.1.3. Professional Services
- 8.1.4. Other Services
- 8.2. Market Analysis, Insights and Forecast - by Solutions
- 8.2.1. Power
- 8.2.2. Servers
- 8.2.3. Management Software
- 8.2.4. Networking Technologies
- 8.2.5. Cooling
- 8.2.6. Other Solutions
- 8.3. Market Analysis, Insights and Forecast - by Users
- 8.3.1. Colocation Providers
- 8.3.2. Cloud Service Providers
- 8.3.3. Enterprises
- 8.4. Market Analysis, Insights and Forecast - by End-user Industries
- 8.4.1. Healthcare
- 8.4.2. Financial Services
- 8.4.3. Government
- 8.4.4. Telecom and IT
- 8.4.5. Other Industries
- 8.1. Market Analysis, Insights and Forecast - by Services
- 9. Middle East & Africa APAC Green Data Center Market Analysis, Insights and Forecast, 2019-2031
- 9.1. Market Analysis, Insights and Forecast - by Services
- 9.1.1. System Integration
- 9.1.2. Monitoring Services
- 9.1.3. Professional Services
- 9.1.4. Other Services
- 9.2. Market Analysis, Insights and Forecast - by Solutions
- 9.2.1. Power
- 9.2.2. Servers
- 9.2.3. Management Software
- 9.2.4. Networking Technologies
- 9.2.5. Cooling
- 9.2.6. Other Solutions
- 9.3. Market Analysis, Insights and Forecast - by Users
- 9.3.1. Colocation Providers
- 9.3.2. Cloud Service Providers
- 9.3.3. Enterprises
- 9.4. Market Analysis, Insights and Forecast - by End-user Industries
- 9.4.1. Healthcare
- 9.4.2. Financial Services
- 9.4.3. Government
- 9.4.4. Telecom and IT
- 9.4.5. Other Industries
- 9.1. Market Analysis, Insights and Forecast - by Services
- 10. Asia Pacific APAC Green Data Center Market Analysis, Insights and Forecast, 2019-2031
- 10.1. Market Analysis, Insights and Forecast - by Services
- 10.1.1. System Integration
- 10.1.2. Monitoring Services
- 10.1.3. Professional Services
- 10.1.4. Other Services
- 10.2. Market Analysis, Insights and Forecast - by Solutions
- 10.2.1. Power
- 10.2.2. Servers
- 10.2.3. Management Software
- 10.2.4. Networking Technologies
- 10.2.5. Cooling
- 10.2.6. Other Solutions
- 10.3. Market Analysis, Insights and Forecast - by Users
- 10.3.1. Colocation Providers
- 10.3.2. Cloud Service Providers
- 10.3.3. Enterprises
- 10.4. Market Analysis, Insights and Forecast - by End-user Industries
- 10.4.1. Healthcare
- 10.4.2. Financial Services
- 10.4.3. Government
- 10.4.4. Telecom and IT
- 10.4.5. Other Industries
- 10.1. Market Analysis, Insights and Forecast - by Services
- 11. North America APAC Green Data Center Market Analysis, Insights and Forecast, 2019-2031
- 11.1. Market Analysis, Insights and Forecast - By Country/Sub-region
- 11.1.1 United States
- 11.1.2 Canada
- 11.1.3 Mexico
- 12. Europe APAC Green Data Center Market Analysis, Insights and Forecast, 2019-2031
- 12.1. Market Analysis, Insights and Forecast - By Country/Sub-region
- 12.1.1 Germany
- 12.1.2 United Kingdom
- 12.1.3 France
- 12.1.4 Spain
- 12.1.5 Italy
- 12.1.6 Spain
- 12.1.7 Belgium
- 12.1.8 Netherland
- 12.1.9 Nordics
- 12.1.10 Rest of Europe
- 13. Asia Pacific APAC Green Data Center Market Analysis, Insights and Forecast, 2019-2031
- 13.1. Market Analysis, Insights and Forecast - By Country/Sub-region
- 13.1.1 China
- 13.1.2 Japan
- 13.1.3 India
- 13.1.4 South Korea
- 13.1.5 Southeast Asia
- 13.1.6 Australia
- 13.1.7 Indonesia
- 13.1.8 Phillipes
- 13.1.9 Singapore
- 13.1.10 Thailandc
- 13.1.11 Rest of Asia Pacific
- 14. South America APAC Green Data Center Market Analysis, Insights and Forecast, 2019-2031
- 14.1. Market Analysis, Insights and Forecast - By Country/Sub-region
- 14.1.1 Brazil
- 14.1.2 Argentina
- 14.1.3 Peru
- 14.1.4 Chile
- 14.1.5 Colombia
- 14.1.6 Ecuador
- 14.1.7 Venezuela
- 14.1.8 Rest of South America
- 15. North America APAC Green Data Center Market Analysis, Insights and Forecast, 2019-2031
- 15.1. Market Analysis, Insights and Forecast - By Country/Sub-region
- 15.1.1 United States
- 15.1.2 Canada
- 15.1.3 Mexico
- 16. MEA APAC Green Data Center Market Analysis, Insights and Forecast, 2019-2031
- 16.1. Market Analysis, Insights and Forecast - By Country/Sub-region
- 16.1.1 United Arab Emirates
- 16.1.2 Saudi Arabia
- 16.1.3 South Africa
- 16.1.4 Rest of Middle East and Africa
- 17. Competitive Analysis
- 17.1. Global Market Share Analysis 2024
- 17.2. Company Profiles
- 17.2.1 Emerson Network Powers
- 17.2.1.1. Overview
- 17.2.1.2. Products
- 17.2.1.3. SWOT Analysis
- 17.2.1.4. Recent Developments
- 17.2.1.5. Financials (Based on Availability)
- 17.2.2 EMC Corporation
- 17.2.2.1. Overview
- 17.2.2.2. Products
- 17.2.2.3. SWOT Analysis
- 17.2.2.4. Recent Developments
- 17.2.2.5. Financials (Based on Availability)
- 17.2.3 IBM Corporation
- 17.2.3.1. Overview
- 17.2.3.2. Products
- 17.2.3.3. SWOT Analysis
- 17.2.3.4. Recent Developments
- 17.2.3.5. Financials (Based on Availability)
- 17.2.4 Fujitsu Ltd
- 17.2.4.1. Overview
- 17.2.4.2. Products
- 17.2.4.3. SWOT Analysis
- 17.2.4.4. Recent Developments
- 17.2.4.5. Financials (Based on Availability)
- 17.2.5 Hitachi Ltd
- 17.2.5.1. Overview
- 17.2.5.2. Products
- 17.2.5.3. SWOT Analysis
- 17.2.5.4. Recent Developments
- 17.2.5.5. Financials (Based on Availability)
- 17.2.6 Schneider Electric SE
- 17.2.6.1. Overview
- 17.2.6.2. Products
- 17.2.6.3. SWOT Analysis
- 17.2.6.4. Recent Developments
- 17.2.6.5. Financials (Based on Availability)
- 17.2.7 HP Inc
- 17.2.7.1. Overview
- 17.2.7.2. Products
- 17.2.7.3. SWOT Analysis
- 17.2.7.4. Recent Developments
- 17.2.7.5. Financials (Based on Availability)
- 17.2.8 Dell Inc
- 17.2.8.1. Overview
- 17.2.8.2. Products
- 17.2.8.3. SWOT Analysis
- 17.2.8.4. Recent Developments
- 17.2.8.5. Financials (Based on Availability)
- 17.2.9 Cisco Technology Inc
- 17.2.9.1. Overview
- 17.2.9.2. Products
- 17.2.9.3. SWOT Analysis
- 17.2.9.4. Recent Developments
- 17.2.9.5. Financials (Based on Availability)
- 17.2.10 GoGrid LLC
- 17.2.10.1. Overview
- 17.2.10.2. Products
- 17.2.10.3. SWOT Analysis
- 17.2.10.4. Recent Developments
- 17.2.10.5. Financials (Based on Availability)
- 17.2.11 Eaton Corporation
- 17.2.11.1. Overview
- 17.2.11.2. Products
- 17.2.11.3. SWOT Analysis
- 17.2.11.4. Recent Developments
- 17.2.11.5. Financials (Based on Availability)
- 17.2.1 Emerson Network Powers
List of Figures
- Figure 1: Global APAC Green Data Center Market Revenue Breakdown (Million, %) by Region 2024 & 2032
- Figure 2: North America APAC Green Data Center Market Revenue (Million), by Country 2024 & 2032
- Figure 3: North America APAC Green Data Center Market Revenue Share (%), by Country 2024 & 2032
- Figure 4: Europe APAC Green Data Center Market Revenue (Million), by Country 2024 & 2032
- Figure 5: Europe APAC Green Data Center Market Revenue Share (%), by Country 2024 & 2032
- Figure 6: Asia Pacific APAC Green Data Center Market Revenue (Million), by Country 2024 & 2032
- Figure 7: Asia Pacific APAC Green Data Center Market Revenue Share (%), by Country 2024 & 2032
- Figure 8: South America APAC Green Data Center Market Revenue (Million), by Country 2024 & 2032
- Figure 9: South America APAC Green Data Center Market Revenue Share (%), by Country 2024 & 2032
- Figure 10: North America APAC Green Data Center Market Revenue (Million), by Country 2024 & 2032
- Figure 11: North America APAC Green Data Center Market Revenue Share (%), by Country 2024 & 2032
- Figure 12: MEA APAC Green Data Center Market Revenue (Million), by Country 2024 & 2032
- Figure 13: MEA APAC Green Data Center Market Revenue Share (%), by Country 2024 & 2032
- Figure 14: North America APAC Green Data Center Market Revenue (Million), by Services 2024 & 2032
- Figure 15: North America APAC Green Data Center Market Revenue Share (%), by Services 2024 & 2032
- Figure 16: North America APAC Green Data Center Market Revenue (Million), by Solutions 2024 & 2032
- Figure 17: North America APAC Green Data Center Market Revenue Share (%), by Solutions 2024 & 2032
- Figure 18: North America APAC Green Data Center Market Revenue (Million), by Users 2024 & 2032
- Figure 19: North America APAC Green Data Center Market Revenue Share (%), by Users 2024 & 2032
- Figure 20: North America APAC Green Data Center Market Revenue (Million), by End-user Industries 2024 & 2032
- Figure 21: North America APAC Green Data Center Market Revenue Share (%), by End-user Industries 2024 & 2032
- Figure 22: North America APAC Green Data Center Market Revenue (Million), by Country 2024 & 2032
- Figure 23: North America APAC Green Data Center Market Revenue Share (%), by Country 2024 & 2032
- Figure 24: South America APAC Green Data Center Market Revenue (Million), by Services 2024 & 2032
- Figure 25: South America APAC Green Data Center Market Revenue Share (%), by Services 2024 & 2032
- Figure 26: South America APAC Green Data Center Market Revenue (Million), by Solutions 2024 & 2032
- Figure 27: South America APAC Green Data Center Market Revenue Share (%), by Solutions 2024 & 2032
- Figure 28: South America APAC Green Data Center Market Revenue (Million), by Users 2024 & 2032
- Figure 29: South America APAC Green Data Center Market Revenue Share (%), by Users 2024 & 2032
- Figure 30: South America APAC Green Data Center Market Revenue (Million), by End-user Industries 2024 & 2032
- Figure 31: South America APAC Green Data Center Market Revenue Share (%), by End-user Industries 2024 & 2032
- Figure 32: South America APAC Green Data Center Market Revenue (Million), by Country 2024 & 2032
- Figure 33: South America APAC Green Data Center Market Revenue Share (%), by Country 2024 & 2032
- Figure 34: Europe APAC Green Data Center Market Revenue (Million), by Services 2024 & 2032
- Figure 35: Europe APAC Green Data Center Market Revenue Share (%), by Services 2024 & 2032
- Figure 36: Europe APAC Green Data Center Market Revenue (Million), by Solutions 2024 & 2032
- Figure 37: Europe APAC Green Data Center Market Revenue Share (%), by Solutions 2024 & 2032
- Figure 38: Europe APAC Green Data Center Market Revenue (Million), by Users 2024 & 2032
- Figure 39: Europe APAC Green Data Center Market Revenue Share (%), by Users 2024 & 2032
- Figure 40: Europe APAC Green Data Center Market Revenue (Million), by End-user Industries 2024 & 2032
- Figure 41: Europe APAC Green Data Center Market Revenue Share (%), by End-user Industries 2024 & 2032
- Figure 42: Europe APAC Green Data Center Market Revenue (Million), by Country 2024 & 2032
- Figure 43: Europe APAC Green Data Center Market Revenue Share (%), by Country 2024 & 2032
- Figure 44: Middle East & Africa APAC Green Data Center Market Revenue (Million), by Services 2024 & 2032
- Figure 45: Middle East & Africa APAC Green Data Center Market Revenue Share (%), by Services 2024 & 2032
- Figure 46: Middle East & Africa APAC Green Data Center Market Revenue (Million), by Solutions 2024 & 2032
- Figure 47: Middle East & Africa APAC Green Data Center Market Revenue Share (%), by Solutions 2024 & 2032
- Figure 48: Middle East & Africa APAC Green Data Center Market Revenue (Million), by Users 2024 & 2032
- Figure 49: Middle East & Africa APAC Green Data Center Market Revenue Share (%), by Users 2024 & 2032
- Figure 50: Middle East & Africa APAC Green Data Center Market Revenue (Million), by End-user Industries 2024 & 2032
- Figure 51: Middle East & Africa APAC Green Data Center Market Revenue Share (%), by End-user Industries 2024 & 2032
- Figure 52: Middle East & Africa APAC Green Data Center Market Revenue (Million), by Country 2024 & 2032
- Figure 53: Middle East & Africa APAC Green Data Center Market Revenue Share (%), by Country 2024 & 2032
- Figure 54: Asia Pacific APAC Green Data Center Market Revenue (Million), by Services 2024 & 2032
- Figure 55: Asia Pacific APAC Green Data Center Market Revenue Share (%), by Services 2024 & 2032
- Figure 56: Asia Pacific APAC Green Data Center Market Revenue (Million), by Solutions 2024 & 2032
- Figure 57: Asia Pacific APAC Green Data Center Market Revenue Share (%), by Solutions 2024 & 2032
- Figure 58: Asia Pacific APAC Green Data Center Market Revenue (Million), by Users 2024 & 2032
- Figure 59: Asia Pacific APAC Green Data Center Market Revenue Share (%), by Users 2024 & 2032
- Figure 60: Asia Pacific APAC Green Data Center Market Revenue (Million), by End-user Industries 2024 & 2032
- Figure 61: Asia Pacific APAC Green Data Center Market Revenue Share (%), by End-user Industries 2024 & 2032
- Figure 62: Asia Pacific APAC Green Data Center Market Revenue (Million), by Country 2024 & 2032
- Figure 63: Asia Pacific APAC Green Data Center Market Revenue Share (%), by Country 2024 & 2032
List of Tables
- Table 1: Global APAC Green Data Center Market Revenue Million Forecast, by Region 2019 & 2032
- Table 2: Global APAC Green Data Center Market Revenue Million Forecast, by Services 2019 & 2032
- Table 3: Global APAC Green Data Center Market Revenue Million Forecast, by Solutions 2019 & 2032
- Table 4: Global APAC Green Data Center Market Revenue Million Forecast, by Users 2019 & 2032
- Table 5: Global APAC Green Data Center Market Revenue Million Forecast, by End-user Industries 2019 & 2032
- Table 6: Global APAC Green Data Center Market Revenue Million Forecast, by Region 2019 & 2032
- Table 7: Global APAC Green Data Center Market Revenue Million Forecast, by Country 2019 & 2032
- Table 8: United States APAC Green Data Center Market Revenue (Million) Forecast, by Application 2019 & 2032
- Table 9: Canada APAC Green Data Center Market Revenue (Million) Forecast, by Application 2019 & 2032
- Table 10: Mexico APAC Green Data Center Market Revenue (Million) Forecast, by Application 2019 & 2032
- Table 11: Global APAC Green Data Center Market Revenue Million Forecast, by Country 2019 & 2032
- Table 12: Germany APAC Green Data Center Market Revenue (Million) Forecast, by Application 2019 & 2032
- Table 13: United Kingdom APAC Green Data Center Market Revenue (Million) Forecast, by Application 2019 & 2032
- Table 14: France APAC Green Data Center Market Revenue (Million) Forecast, by Application 2019 & 2032
- Table 15: Spain APAC Green Data Center Market Revenue (Million) Forecast, by Application 2019 & 2032
- Table 16: Italy APAC Green Data Center Market Revenue (Million) Forecast, by Application 2019 & 2032
- Table 17: Spain APAC Green Data Center Market Revenue (Million) Forecast, by Application 2019 & 2032
- Table 18: Belgium APAC Green Data Center Market Revenue (Million) Forecast, by Application 2019 & 2032
- Table 19: Netherland APAC Green Data Center Market Revenue (Million) Forecast, by Application 2019 & 2032
- Table 20: Nordics APAC Green Data Center Market Revenue (Million) Forecast, by Application 2019 & 2032
- Table 21: Rest of Europe APAC Green Data Center Market Revenue (Million) Forecast, by Application 2019 & 2032
- Table 22: Global APAC Green Data Center Market Revenue Million Forecast, by Country 2019 & 2032
- Table 23: China APAC Green Data Center Market Revenue (Million) Forecast, by Application 2019 & 2032
- Table 24: Japan APAC Green Data Center Market Revenue (Million) Forecast, by Application 2019 & 2032
- Table 25: India APAC Green Data Center Market Revenue (Million) Forecast, by Application 2019 & 2032
- Table 26: South Korea APAC Green Data Center Market Revenue (Million) Forecast, by Application 2019 & 2032
- Table 27: Southeast Asia APAC Green Data Center Market Revenue (Million) Forecast, by Application 2019 & 2032
- Table 28: Australia APAC Green Data Center Market Revenue (Million) Forecast, by Application 2019 & 2032
- Table 29: Indonesia APAC Green Data Center Market Revenue (Million) Forecast, by Application 2019 & 2032
- Table 30: Phillipes APAC Green Data Center Market Revenue (Million) Forecast, by Application 2019 & 2032
- Table 31: Singapore APAC Green Data Center Market Revenue (Million) Forecast, by Application 2019 & 2032
- Table 32: Thailandc APAC Green Data Center Market Revenue (Million) Forecast, by Application 2019 & 2032
- Table 33: Rest of Asia Pacific APAC Green Data Center Market Revenue (Million) Forecast, by Application 2019 & 2032
- Table 34: Global APAC Green Data Center Market Revenue Million Forecast, by Country 2019 & 2032
- Table 35: Brazil APAC Green Data Center Market Revenue (Million) Forecast, by Application 2019 & 2032
- Table 36: Argentina APAC Green Data Center Market Revenue (Million) Forecast, by Application 2019 & 2032
- Table 37: Peru APAC Green Data Center Market Revenue (Million) Forecast, by Application 2019 & 2032
- Table 38: Chile APAC Green Data Center Market Revenue (Million) Forecast, by Application 2019 & 2032
- Table 39: Colombia APAC Green Data Center Market Revenue (Million) Forecast, by Application 2019 & 2032
- Table 40: Ecuador APAC Green Data Center Market Revenue (Million) Forecast, by Application 2019 & 2032
- Table 41: Venezuela APAC Green Data Center Market Revenue (Million) Forecast, by Application 2019 & 2032
- Table 42: Rest of South America APAC Green Data Center Market Revenue (Million) Forecast, by Application 2019 & 2032
- Table 43: Global APAC Green Data Center Market Revenue Million Forecast, by Country 2019 & 2032
- Table 44: United States APAC Green Data Center Market Revenue (Million) Forecast, by Application 2019 & 2032
- Table 45: Canada APAC Green Data Center Market Revenue (Million) Forecast, by Application 2019 & 2032
- Table 46: Mexico APAC Green Data Center Market Revenue (Million) Forecast, by Application 2019 & 2032
- Table 47: Global APAC Green Data Center Market Revenue Million Forecast, by Country 2019 & 2032
- Table 48: United Arab Emirates APAC Green Data Center Market Revenue (Million) Forecast, by Application 2019 & 2032
- Table 49: Saudi Arabia APAC Green Data Center Market Revenue (Million) Forecast, by Application 2019 & 2032
- Table 50: South Africa APAC Green Data Center Market Revenue (Million) Forecast, by Application 2019 & 2032
- Table 51: Rest of Middle East and Africa APAC Green Data Center Market Revenue (Million) Forecast, by Application 2019 & 2032
- Table 52: Global APAC Green Data Center Market Revenue Million Forecast, by Services 2019 & 2032
- Table 53: Global APAC Green Data Center Market Revenue Million Forecast, by Solutions 2019 & 2032
- Table 54: Global APAC Green Data Center Market Revenue Million Forecast, by Users 2019 & 2032
- Table 55: Global APAC Green Data Center Market Revenue Million Forecast, by End-user Industries 2019 & 2032
- Table 56: Global APAC Green Data Center Market Revenue Million Forecast, by Country 2019 & 2032
- Table 57: United States APAC Green Data Center Market Revenue (Million) Forecast, by Application 2019 & 2032
- Table 58: Canada APAC Green Data Center Market Revenue (Million) Forecast, by Application 2019 & 2032
- Table 59: Mexico APAC Green Data Center Market Revenue (Million) Forecast, by Application 2019 & 2032
- Table 60: Global APAC Green Data Center Market Revenue Million Forecast, by Services 2019 & 2032
- Table 61: Global APAC Green Data Center Market Revenue Million Forecast, by Solutions 2019 & 2032
- Table 62: Global APAC Green Data Center Market Revenue Million Forecast, by Users 2019 & 2032
- Table 63: Global APAC Green Data Center Market Revenue Million Forecast, by End-user Industries 2019 & 2032
- Table 64: Global APAC Green Data Center Market Revenue Million Forecast, by Country 2019 & 2032
- Table 65: Brazil APAC Green Data Center Market Revenue (Million) Forecast, by Application 2019 & 2032
- Table 66: Argentina APAC Green Data Center Market Revenue (Million) Forecast, by Application 2019 & 2032
- Table 67: Rest of South America APAC Green Data Center Market Revenue (Million) Forecast, by Application 2019 & 2032
- Table 68: Global APAC Green Data Center Market Revenue Million Forecast, by Services 2019 & 2032
- Table 69: Global APAC Green Data Center Market Revenue Million Forecast, by Solutions 2019 & 2032
- Table 70: Global APAC Green Data Center Market Revenue Million Forecast, by Users 2019 & 2032
- Table 71: Global APAC Green Data Center Market Revenue Million Forecast, by End-user Industries 2019 & 2032
- Table 72: Global APAC Green Data Center Market Revenue Million Forecast, by Country 2019 & 2032
- Table 73: United Kingdom APAC Green Data Center Market Revenue (Million) Forecast, by Application 2019 & 2032
- Table 74: Germany APAC Green Data Center Market Revenue (Million) Forecast, by Application 2019 & 2032
- Table 75: France APAC Green Data Center Market Revenue (Million) Forecast, by Application 2019 & 2032
- Table 76: Italy APAC Green Data Center Market Revenue (Million) Forecast, by Application 2019 & 2032
- Table 77: Spain APAC Green Data Center Market Revenue (Million) Forecast, by Application 2019 & 2032
- Table 78: Russia APAC Green Data Center Market Revenue (Million) Forecast, by Application 2019 & 2032
- Table 79: Benelux APAC Green Data Center Market Revenue (Million) Forecast, by Application 2019 & 2032
- Table 80: Nordics APAC Green Data Center Market Revenue (Million) Forecast, by Application 2019 & 2032
- Table 81: Rest of Europe APAC Green Data Center Market Revenue (Million) Forecast, by Application 2019 & 2032
- Table 82: Global APAC Green Data Center Market Revenue Million Forecast, by Services 2019 & 2032
- Table 83: Global APAC Green Data Center Market Revenue Million Forecast, by Solutions 2019 & 2032
- Table 84: Global APAC Green Data Center Market Revenue Million Forecast, by Users 2019 & 2032
- Table 85: Global APAC Green Data Center Market Revenue Million Forecast, by End-user Industries 2019 & 2032
- Table 86: Global APAC Green Data Center Market Revenue Million Forecast, by Country 2019 & 2032
- Table 87: Turkey APAC Green Data Center Market Revenue (Million) Forecast, by Application 2019 & 2032
- Table 88: Israel APAC Green Data Center Market Revenue (Million) Forecast, by Application 2019 & 2032
- Table 89: GCC APAC Green Data Center Market Revenue (Million) Forecast, by Application 2019 & 2032
- Table 90: North Africa APAC Green Data Center Market Revenue (Million) Forecast, by Application 2019 & 2032
- Table 91: South Africa APAC Green Data Center Market Revenue (Million) Forecast, by Application 2019 & 2032
- Table 92: Rest of Middle East & Africa APAC Green Data Center Market Revenue (Million) Forecast, by Application 2019 & 2032
- Table 93: Global APAC Green Data Center Market Revenue Million Forecast, by Services 2019 & 2032
- Table 94: Global APAC Green Data Center Market Revenue Million Forecast, by Solutions 2019 & 2032
- Table 95: Global APAC Green Data Center Market Revenue Million Forecast, by Users 2019 & 2032
- Table 96: Global APAC Green Data Center Market Revenue Million Forecast, by End-user Industries 2019 & 2032
- Table 97: Global APAC Green Data Center Market Revenue Million Forecast, by Country 2019 & 2032
- Table 98: China APAC Green Data Center Market Revenue (Million) Forecast, by Application 2019 & 2032
- Table 99: India APAC Green Data Center Market Revenue (Million) Forecast, by Application 2019 & 2032
- Table 100: Japan APAC Green Data Center Market Revenue (Million) Forecast, by Application 2019 & 2032
- Table 101: South Korea APAC Green Data Center Market Revenue (Million) Forecast, by Application 2019 & 2032
- Table 102: ASEAN APAC Green Data Center Market Revenue (Million) Forecast, by Application 2019 & 2032
- Table 103: Oceania APAC Green Data Center Market Revenue (Million) Forecast, by Application 2019 & 2032
- Table 104: Rest of Asia Pacific APAC Green Data Center Market Revenue (Million) Forecast, by Application 2019 & 2032
Frequently Asked Questions
1. What is the projected Compound Annual Growth Rate (CAGR) of the APAC Green Data Center Market?
The projected CAGR is approximately 20.87%.
2. Which companies are prominent players in the APAC Green Data Center Market?
Key companies in the market include Emerson Network Powers, EMC Corporation, IBM Corporation, Fujitsu Ltd, Hitachi Ltd, Schneider Electric SE, HP Inc, Dell Inc, Cisco Technology Inc, GoGrid LLC, Eaton Corporation.
3. What are the main segments of the APAC Green Data Center Market?
The market segments include Services, Solutions, Users, End-user Industries.
4. Can you provide details about the market size?
The market size is estimated to be USD XX Million as of 2022.
5. What are some drivers contributing to market growth?
Increasing use of Cloud Managed Infrastructure Services; Technological Proliferation and Advancement of Cloud Based Technology Boosting the Demand; Improved cost and Operational Efficiency and Update of Outdated Hardware.
6. What are the notable trends driving market growth?
Rise in Electricity Prices Affecting the Market Negatively.
7. Are there any restraints impacting market growth?
Declining Profit Margins and Integration and Reliability Concerns.
8. Can you provide examples of recent developments in the market?
October 2022: PhonePe launched its first green data center with Dell Technologies and NTT Ltd. in India based on the liquid immersion technology, which will help the fintech in reducing its carbon emissions to meet sustainability goals by saving a significant amount of power savings, therefore relatively reducing carbon footprint in the data center.
9. What pricing options are available for accessing the report?
Pricing options include single-user, multi-user, and enterprise licenses priced at USD 4750, USD 5250, and USD 8750 respectively.
10. Is the market size provided in terms of value or volume?
The market size is provided in terms of value, measured in Million.
11. Are there any specific market keywords associated with the report?
Yes, the market keyword associated with the report is "APAC Green Data Center Market," which aids in identifying and referencing the specific market segment covered.
12. How do I determine which pricing option suits my needs best?
The pricing options vary based on user requirements and access needs. Individual users may opt for single-user licenses, while businesses requiring broader access may choose multi-user or enterprise licenses for cost-effective access to the report.
13. Are there any additional resources or data provided in the APAC Green Data Center Market report?
While the report offers comprehensive insights, it's advisable to review the specific contents or supplementary materials provided to ascertain if additional resources or data are available.
14. How can I stay updated on further developments or reports in the APAC Green Data Center Market?
To stay informed about further developments, trends, and reports in the APAC Green Data Center Market, consider subscribing to industry newsletters, following relevant companies and organizations, or regularly checking reputable industry news sources and publications.
Methodology
Step 1 - Identification of Relevant Samples Size from Population Database


Step 2 - Approaches for Defining Global Market Size (Value, Volume* & Price*)

Note*: In applicable scenarios
Step 3 - Data Sources
Primary Research
- Web Analytics
- Survey Reports
- Research Institute
- Latest Research Reports
- Opinion Leaders
Secondary Research
- Annual Reports
- White Paper
- Latest Press Release
- Industry Association
- Paid Database
- Investor Presentations

Step 4 - Data Triangulation
Involves using different sources of information in order to increase the validity of a study
These sources are likely to be stakeholders in a program - participants, other researchers, program staff, other community members, and so on.
Then we put all data in single framework & apply various statistical tools to find out the dynamic on the market.
During the analysis stage, feedback from the stakeholder groups would be compared to determine areas of agreement as well as areas of divergence


