
Key Insights
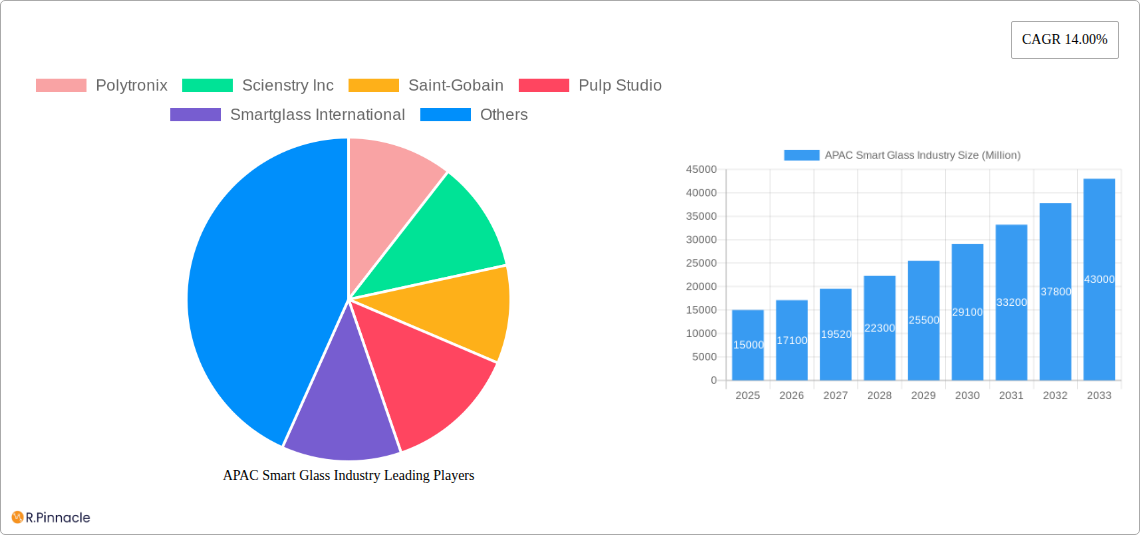
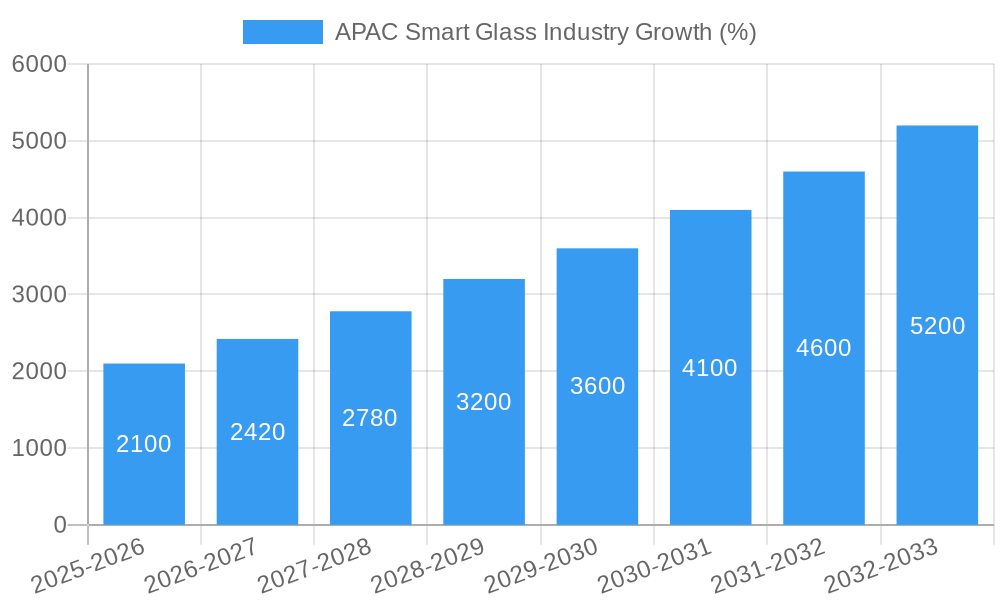
The Asia-Pacific (APAC) smart glass market is experiencing robust growth, driven by increasing demand from the construction, commercial buildings, and transportation sectors. The region's burgeoning infrastructure development, coupled with a rising focus on energy efficiency and aesthetically advanced building designs, fuels this expansion. A compound annual growth rate (CAGR) of 14% from 2019 to 2033 indicates a significant market trajectory. Key technological advancements, such as improvements in electro-chromic glass and suspended particle devices, are enhancing smart glass functionalities, including light control, privacy, and thermal management. This leads to wider adoption across various applications, further boosting market size. China, Japan, South Korea, and India are major contributors to this growth, representing significant market shares due to their robust economies and significant construction activities. However, factors like high initial investment costs and limited awareness in certain segments could act as restraints. The market segmentation reveals significant opportunities in both technology types (e.g., the increasing prevalence of active smart glass solutions over passive ones) and applications (e.g., the ongoing shift toward energy-efficient building materials in the construction industry). Companies like Saint-Gobain, Asahi Glass Corporation, and PPG Industries are leading the market, leveraging their established presence and technological capabilities to cater to the growing demand. The forecast period, from 2025 to 2033, anticipates even stronger growth, driven by ongoing technological innovations and increasing government support for sustainable building practices across the region.
The continued expansion of the APAC smart glass market is anticipated to be fueled by several factors. Firstly, the rising adoption of smart buildings and sustainable urban development initiatives across the region is driving demand. Secondly, the increasing integration of smart glass into consumer electronics and other applications is broadening its market reach. Thirdly, technological advancements leading to improved performance, reduced costs, and enhanced functionalities are increasing the attractiveness of smart glass. While challenges remain, such as overcoming the initial high investment costs associated with smart glass implementation, the overall market outlook is highly positive. The continuous innovation and the growing adoption of smart glass in various applications suggest a promising future for this technology in the APAC region. This positive trend is likely to attract more investors and encourage further technological advancements, leading to a wider range of applications and an even more robust market growth in the coming years.
APAC Smart Glass Industry: A Comprehensive Market Report (2019-2033)
This comprehensive report provides an in-depth analysis of the Asia-Pacific (APAC) smart glass industry, offering invaluable insights for industry professionals, investors, and strategic decision-makers. Covering the period from 2019 to 2033, with a base year of 2025 and a forecast period of 2025-2033, this report meticulously examines market dynamics, technological advancements, and key players shaping the future of smart glass in the region. The market is projected to reach xx Million by 2033, exhibiting a robust CAGR.
APAC Smart Glass Industry Market Structure & Innovation Trends
This section analyzes the APAC smart glass market structure, highlighting its concentration levels and identifying key innovation drivers. We delve into the regulatory landscape, explore product substitutes, examine end-user demographics, and review significant mergers and acquisitions (M&A) activities.
Market Concentration: The APAC smart glass market exhibits a moderately concentrated structure, with key players such as Saint-Gobain, Asahi Glass Corporation, and PPG Industries holding significant market share. However, the presence of numerous smaller, innovative companies indicates a dynamic and competitive landscape. We estimate that the top 5 players collectively hold approximately xx% of the market share in 2025.
Innovation Drivers: Technological advancements in electro-chromic glass, suspended particle devices, and liquid crystal technologies are primary drivers of innovation. Government initiatives promoting energy efficiency and sustainable building practices further fuel the adoption of smart glass solutions.
Regulatory Frameworks: Stringent building codes and energy efficiency standards in several APAC countries, particularly in China and Japan, are creating a favorable regulatory environment for smart glass adoption.
M&A Activities: The APAC smart glass industry has witnessed a moderate level of M&A activity in recent years, with deal values averaging xx Million per transaction. These activities reflect the industry's consolidation trend and the strategic efforts of established players to expand their market presence. We identify xx major M&A deals within the study period.
Product Substitutes: Traditional window glazing remains a significant substitute for smart glass, though its limitations in energy efficiency and light control are driving increased demand for smart glass alternatives.
APAC Smart Glass Industry Market Dynamics & Trends
This section explores the key market growth drivers, technological disruptions, evolving consumer preferences, and competitive dynamics shaping the APAC smart glass market. We provide a detailed analysis of market trends, including market penetration rates and compound annual growth rates (CAGR).
The APAC smart glass market is experiencing significant growth driven by increasing demand for energy-efficient buildings, rising consumer awareness of smart home technologies, and advancements in smart glass technologies. The market is expected to exhibit a CAGR of xx% during the forecast period (2025-2033). This growth is particularly noticeable in the commercial building sector, driven by the need to reduce energy consumption and enhance building aesthetics. Technological disruptions, such as the integration of IoT capabilities and advancements in electrochromic technology, are further accelerating market growth. Changing consumer preferences toward smart and sustainable living also play a significant role. The competitive landscape is characterized by both established players and emerging innovative companies, resulting in a dynamic and competitive environment. Market penetration is highest in China and Japan, due to strong government support and early adoption.
Dominant Regions & Segments in APAP Smart Glass Industry
This section identifies the leading regions, countries, and market segments within the APAC smart glass industry.
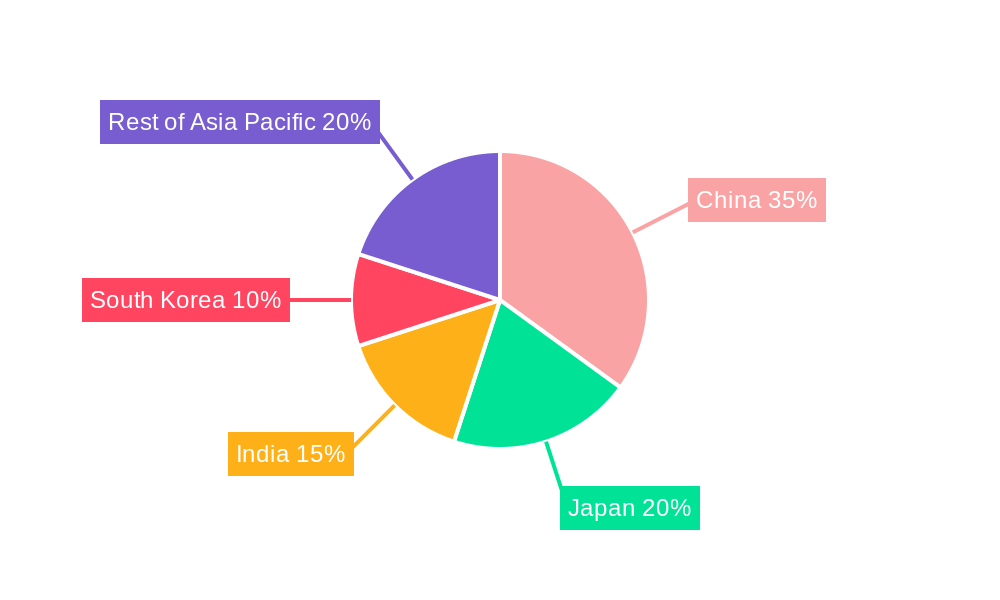
Leading Regions: China dominates the APAC smart glass market due to its substantial construction sector, favorable government policies, and significant manufacturing capabilities. Japan follows closely, driven by strong technological advancements and a focus on energy efficiency.
Leading Countries:
- China: High construction activity, government support for green building initiatives, and a large manufacturing base drive strong growth.
- Japan: Technological advancements, energy efficiency regulations, and a high adoption rate among consumers contribute to its market dominance.
- India: Growing urbanization and infrastructure development are creating significant growth opportunities.
- South Korea: High technological capabilities and a focus on innovation contribute to moderate growth.
- Rest of Asia Pacific: This region demonstrates moderate growth, with variations across individual countries based on economic development and infrastructure.
Leading Segments:
- Technology: Electro-chromic glass holds a significant market share due to its versatility and energy-saving capabilities. Liquid crystal technology is also gaining traction, particularly in consumer electronics applications.
- Applications: The construction sector, particularly commercial buildings, accounts for the largest segment of the market. The transportation sector is also showing notable growth, driven by increasing demand for smart windows in automobiles and public transportation.
APAC Smart Glass Industry Product Innovations
Recent years have witnessed notable product developments in the APAC smart glass industry, with a focus on enhanced energy efficiency, improved aesthetics, and integrated smart functionalities. Electrochromic glass, with its ability to dynamically adjust light transmission, is witnessing significant advancements. Suspended particle devices and liquid crystal technologies are also being refined to offer improved performance and affordability. These innovations are primarily driven by the need for energy-efficient building solutions and the increasing demand for smart home and automotive applications. The market is seeing a trend towards integrated smart features, such as self-cleaning capabilities and improved insulation, enhancing the value proposition of smart glass products.
Report Scope & Segmentation Analysis
This report provides a comprehensive segmentation analysis of the APAC smart glass market based on technology (Suspended Particle Devices, Liquid Crystals, Electro-chromic Glass, Passive Smart glass, Active Smart glass, Others), applications (Construction, Commercial Buildings, Transportation, Energy, Consumer Electronics, Others), and country (China, Japan, India, South Korea, Rest of Asia Pacific). Each segment is analyzed based on its growth projections, market size, and competitive dynamics. Growth projections vary significantly across segments, with electro-chromic glass and the commercial building application showing the highest growth potential. Market sizes are estimated using a bottom-up approach, incorporating data from various sources. Competitive dynamics are analyzed by assessing the market share and competitive strategies of key players in each segment.
Key Drivers of APAC Smart Glass Industry Growth
The growth of the APAC smart glass industry is fueled by several key drivers:
Rising Demand for Energy-Efficient Buildings: Stringent energy regulations and growing environmental concerns are driving the adoption of smart glass in new and retrofit construction projects.
Technological Advancements: Continuous innovation in smart glass technologies, including electrochromic glass and liquid crystal devices, is enhancing product performance and expanding application possibilities.
Government Support and Incentives: Several APAC governments are promoting the adoption of smart glass through various initiatives, including subsidies and tax breaks.
Growing Adoption of Smart Home Technologies: The increasing popularity of smart home automation systems is creating a demand for integrated smart glass solutions.
Challenges in the APAP Smart Glass Industry Sector
Despite the significant growth potential, the APAC smart glass industry faces several challenges:
High Initial Costs: The relatively high cost of smart glass compared to traditional glazing can hinder adoption, particularly in cost-sensitive markets.
Supply Chain Disruptions: Global supply chain disruptions can affect the availability and price of raw materials and components, impacting production costs and timelines.
Competition from Traditional Window Glazing: Smart glass competes with traditional window glazing, which remains a cost-effective alternative.
Emerging Opportunities in APAC Smart Glass Industry
The APAC smart glass industry presents several emerging opportunities:
Integration with IoT Platforms: The integration of smart glass with IoT platforms offers new functionalities and enhanced user experiences.
Expansion into New Applications: Smart glass is finding applications in various emerging sectors, including automotive, aerospace, and healthcare.
Development of Innovative Products: Continuous innovation in materials and manufacturing processes can lead to the development of more efficient, durable, and affordable smart glass products.
Leading Players in the APAC Smart Glass Industry Market
- Polytronix
- Scienstry Inc
- Saint-Gobain (https://www.saint-gobain.com/)
- Pulp Studio
- Smartglass International
- Citala
- Pro Display
- Asahi Glass Corporation (https://www.agc.com/)
- Gentex Corporation (https://www.gentex.com/)
- Nippon
- Ravenbrick
- Hitachi Chemical (https://www.hitachi-chem.co.jp/en/)
- LTI Smart Glass
- PPG Industries (https://www.ppg.com/)
- View Inc (https://www.view.com/)
Key Developments in APAC Smart Glass Industry
September 2021: Xiaomi launched its own smart glasses with features like photo taking, message display, call making, navigation, and real-time text translation.
September 2021: Facebook Inc., in partnership with Ray-Ban, launched "Ray-Ban Stories" smart glasses enabling music listening, calls, photo and video capture, and sharing via a companion app.
Future Outlook for APAC Smart Glass Industry Market
The future of the APAC smart glass market looks promising. Continued technological advancements, increasing demand for energy-efficient buildings, and expanding applications in various sectors will drive significant growth. Strategic partnerships and collaborations between smart glass manufacturers and technology companies will further accelerate innovation and market expansion. The market is poised for substantial growth, driven by both established players and new entrants seeking to capitalize on the rising demand for innovative smart glass solutions.
APAC Smart Glass Industry Segmentation
-
1. Technology
- 1.1. Suspended Particle Devices
- 1.2. Liquid Crystals
- 1.3. Electro-chromic Glass
- 1.4. Passive Smart glass
- 1.5. Active Smart glass
- 1.6. Others
-
2. Applications
-
2.1. Construction
- 2.1.1. Residential Buildings
- 2.1.2. Commercial Buildings
-
2.2. Transportation
- 2.2.1. Aerospace
- 2.2.2. Rail
- 2.2.3. Automotive
- 2.2.4. Others
- 2.3. Energy
- 2.4. Consumer Electronics
-
2.1. Construction
APAC Smart Glass Industry Segmentation By Geography
-
1. North America
- 1.1. United States
- 1.2. Canada
- 1.3. Mexico
-
2. South America
- 2.1. Brazil
- 2.2. Argentina
- 2.3. Rest of South America
-
3. Europe
- 3.1. United Kingdom
- 3.2. Germany
- 3.3. France
- 3.4. Italy
- 3.5. Spain
- 3.6. Russia
- 3.7. Benelux
- 3.8. Nordics
- 3.9. Rest of Europe
-
4. Middle East & Africa
- 4.1. Turkey
- 4.2. Israel
- 4.3. GCC
- 4.4. North Africa
- 4.5. South Africa
- 4.6. Rest of Middle East & Africa
-
5. Asia Pacific
- 5.1. China
- 5.2. India
- 5.3. Japan
- 5.4. South Korea
- 5.5. ASEAN
- 5.6. Oceania
- 5.7. Rest of Asia Pacific
APAC Smart Glass Industry REPORT HIGHLIGHTS
| Aspects | Details |
|---|---|
| Study Period | 2019-2033 |
| Base Year | 2024 |
| Estimated Year | 2025 |
| Forecast Period | 2025-2033 |
| Historical Period | 2019-2024 |
| Growth Rate | CAGR of 14.00% from 2019-2033 |
| Segmentation |
|
Table of Contents
- 1. Introduction
- 1.1. Research Scope
- 1.2. Market Segmentation
- 1.3. Research Methodology
- 1.4. Definitions and Assumptions
- 2. Executive Summary
- 2.1. Introduction
- 3. Market Dynamics
- 3.1. Introduction
- 3.2. Market Drivers
- 3.2.1. Increasing focus on Energy Conservation and Environment Friendly Technologies; Government Regulations; Increasing demand for energy savings techniques
- 3.3. Market Restrains
- 3.3.1. Lack of Awareness of Smart Glass Benefits; Technical Issues with the Usage of Large Size Smart Glass
- 3.4. Market Trends
- 3.4.1. Construction industry is expected to have further growth opportunities in the market
- 4. Market Factor Analysis
- 4.1. Porters Five Forces
- 4.2. Supply/Value Chain
- 4.3. PESTEL analysis
- 4.4. Market Entropy
- 4.5. Patent/Trademark Analysis
- 5. Global APAC Smart Glass Industry Analysis, Insights and Forecast, 2019-2031
- 5.1. Market Analysis, Insights and Forecast - by Technology
- 5.1.1. Suspended Particle Devices
- 5.1.2. Liquid Crystals
- 5.1.3. Electro-chromic Glass
- 5.1.4. Passive Smart glass
- 5.1.5. Active Smart glass
- 5.1.6. Others
- 5.2. Market Analysis, Insights and Forecast - by Applications
- 5.2.1. Construction
- 5.2.1.1. Residential Buildings
- 5.2.1.2. Commercial Buildings
- 5.2.2. Transportation
- 5.2.2.1. Aerospace
- 5.2.2.2. Rail
- 5.2.2.3. Automotive
- 5.2.2.4. Others
- 5.2.3. Energy
- 5.2.4. Consumer Electronics
- 5.2.1. Construction
- 5.3. Market Analysis, Insights and Forecast - by Region
- 5.3.1. North America
- 5.3.2. South America
- 5.3.3. Europe
- 5.3.4. Middle East & Africa
- 5.3.5. Asia Pacific
- 5.1. Market Analysis, Insights and Forecast - by Technology
- 6. North America APAC Smart Glass Industry Analysis, Insights and Forecast, 2019-2031
- 6.1. Market Analysis, Insights and Forecast - by Technology
- 6.1.1. Suspended Particle Devices
- 6.1.2. Liquid Crystals
- 6.1.3. Electro-chromic Glass
- 6.1.4. Passive Smart glass
- 6.1.5. Active Smart glass
- 6.1.6. Others
- 6.2. Market Analysis, Insights and Forecast - by Applications
- 6.2.1. Construction
- 6.2.1.1. Residential Buildings
- 6.2.1.2. Commercial Buildings
- 6.2.2. Transportation
- 6.2.2.1. Aerospace
- 6.2.2.2. Rail
- 6.2.2.3. Automotive
- 6.2.2.4. Others
- 6.2.3. Energy
- 6.2.4. Consumer Electronics
- 6.2.1. Construction
- 6.1. Market Analysis, Insights and Forecast - by Technology
- 7. South America APAC Smart Glass Industry Analysis, Insights and Forecast, 2019-2031
- 7.1. Market Analysis, Insights and Forecast - by Technology
- 7.1.1. Suspended Particle Devices
- 7.1.2. Liquid Crystals
- 7.1.3. Electro-chromic Glass
- 7.1.4. Passive Smart glass
- 7.1.5. Active Smart glass
- 7.1.6. Others
- 7.2. Market Analysis, Insights and Forecast - by Applications
- 7.2.1. Construction
- 7.2.1.1. Residential Buildings
- 7.2.1.2. Commercial Buildings
- 7.2.2. Transportation
- 7.2.2.1. Aerospace
- 7.2.2.2. Rail
- 7.2.2.3. Automotive
- 7.2.2.4. Others
- 7.2.3. Energy
- 7.2.4. Consumer Electronics
- 7.2.1. Construction
- 7.1. Market Analysis, Insights and Forecast - by Technology
- 8. Europe APAC Smart Glass Industry Analysis, Insights and Forecast, 2019-2031
- 8.1. Market Analysis, Insights and Forecast - by Technology
- 8.1.1. Suspended Particle Devices
- 8.1.2. Liquid Crystals
- 8.1.3. Electro-chromic Glass
- 8.1.4. Passive Smart glass
- 8.1.5. Active Smart glass
- 8.1.6. Others
- 8.2. Market Analysis, Insights and Forecast - by Applications
- 8.2.1. Construction
- 8.2.1.1. Residential Buildings
- 8.2.1.2. Commercial Buildings
- 8.2.2. Transportation
- 8.2.2.1. Aerospace
- 8.2.2.2. Rail
- 8.2.2.3. Automotive
- 8.2.2.4. Others
- 8.2.3. Energy
- 8.2.4. Consumer Electronics
- 8.2.1. Construction
- 8.1. Market Analysis, Insights and Forecast - by Technology
- 9. Middle East & Africa APAC Smart Glass Industry Analysis, Insights and Forecast, 2019-2031
- 9.1. Market Analysis, Insights and Forecast - by Technology
- 9.1.1. Suspended Particle Devices
- 9.1.2. Liquid Crystals
- 9.1.3. Electro-chromic Glass
- 9.1.4. Passive Smart glass
- 9.1.5. Active Smart glass
- 9.1.6. Others
- 9.2. Market Analysis, Insights and Forecast - by Applications
- 9.2.1. Construction
- 9.2.1.1. Residential Buildings
- 9.2.1.2. Commercial Buildings
- 9.2.2. Transportation
- 9.2.2.1. Aerospace
- 9.2.2.2. Rail
- 9.2.2.3. Automotive
- 9.2.2.4. Others
- 9.2.3. Energy
- 9.2.4. Consumer Electronics
- 9.2.1. Construction
- 9.1. Market Analysis, Insights and Forecast - by Technology
- 10. Asia Pacific APAC Smart Glass Industry Analysis, Insights and Forecast, 2019-2031
- 10.1. Market Analysis, Insights and Forecast - by Technology
- 10.1.1. Suspended Particle Devices
- 10.1.2. Liquid Crystals
- 10.1.3. Electro-chromic Glass
- 10.1.4. Passive Smart glass
- 10.1.5. Active Smart glass
- 10.1.6. Others
- 10.2. Market Analysis, Insights and Forecast - by Applications
- 10.2.1. Construction
- 10.2.1.1. Residential Buildings
- 10.2.1.2. Commercial Buildings
- 10.2.2. Transportation
- 10.2.2.1. Aerospace
- 10.2.2.2. Rail
- 10.2.2.3. Automotive
- 10.2.2.4. Others
- 10.2.3. Energy
- 10.2.4. Consumer Electronics
- 10.2.1. Construction
- 10.1. Market Analysis, Insights and Forecast - by Technology
- 11. Competitive Analysis
- 11.1. Global Market Share Analysis 2024
- 11.2. Company Profiles
- 11.2.1 Polytronix
- 11.2.1.1. Overview
- 11.2.1.2. Products
- 11.2.1.3. SWOT Analysis
- 11.2.1.4. Recent Developments
- 11.2.1.5. Financials (Based on Availability)
- 11.2.2 Scienstry Inc
- 11.2.2.1. Overview
- 11.2.2.2. Products
- 11.2.2.3. SWOT Analysis
- 11.2.2.4. Recent Developments
- 11.2.2.5. Financials (Based on Availability)
- 11.2.3 Saint-Gobain
- 11.2.3.1. Overview
- 11.2.3.2. Products
- 11.2.3.3. SWOT Analysis
- 11.2.3.4. Recent Developments
- 11.2.3.5. Financials (Based on Availability)
- 11.2.4 Pulp Studio
- 11.2.4.1. Overview
- 11.2.4.2. Products
- 11.2.4.3. SWOT Analysis
- 11.2.4.4. Recent Developments
- 11.2.4.5. Financials (Based on Availability)
- 11.2.5 Smartglass International
- 11.2.5.1. Overview
- 11.2.5.2. Products
- 11.2.5.3. SWOT Analysis
- 11.2.5.4. Recent Developments
- 11.2.5.5. Financials (Based on Availability)
- 11.2.6 Citala
- 11.2.6.1. Overview
- 11.2.6.2. Products
- 11.2.6.3. SWOT Analysis
- 11.2.6.4. Recent Developments
- 11.2.6.5. Financials (Based on Availability)
- 11.2.7 Pro Display
- 11.2.7.1. Overview
- 11.2.7.2. Products
- 11.2.7.3. SWOT Analysis
- 11.2.7.4. Recent Developments
- 11.2.7.5. Financials (Based on Availability)
- 11.2.8 Asahi Glass Corporation
- 11.2.8.1. Overview
- 11.2.8.2. Products
- 11.2.8.3. SWOT Analysis
- 11.2.8.4. Recent Developments
- 11.2.8.5. Financials (Based on Availability)
- 11.2.9 Gentex Corporation
- 11.2.9.1. Overview
- 11.2.9.2. Products
- 11.2.9.3. SWOT Analysis
- 11.2.9.4. Recent Developments
- 11.2.9.5. Financials (Based on Availability)
- 11.2.10 Nippon
- 11.2.10.1. Overview
- 11.2.10.2. Products
- 11.2.10.3. SWOT Analysis
- 11.2.10.4. Recent Developments
- 11.2.10.5. Financials (Based on Availability)
- 11.2.11 Ravenbrick
- 11.2.11.1. Overview
- 11.2.11.2. Products
- 11.2.11.3. SWOT Analysis
- 11.2.11.4. Recent Developments
- 11.2.11.5. Financials (Based on Availability)
- 11.2.12 Hitachi Chemical
- 11.2.12.1. Overview
- 11.2.12.2. Products
- 11.2.12.3. SWOT Analysis
- 11.2.12.4. Recent Developments
- 11.2.12.5. Financials (Based on Availability)
- 11.2.13 LTI Smart Glass
- 11.2.13.1. Overview
- 11.2.13.2. Products
- 11.2.13.3. SWOT Analysis
- 11.2.13.4. Recent Developments
- 11.2.13.5. Financials (Based on Availability)
- 11.2.14 PPG Industries
- 11.2.14.1. Overview
- 11.2.14.2. Products
- 11.2.14.3. SWOT Analysis
- 11.2.14.4. Recent Developments
- 11.2.14.5. Financials (Based on Availability)
- 11.2.15 View Inc
- 11.2.15.1. Overview
- 11.2.15.2. Products
- 11.2.15.3. SWOT Analysis
- 11.2.15.4. Recent Developments
- 11.2.15.5. Financials (Based on Availability)
- 11.2.1 Polytronix
List of Figures
- Figure 1: Global APAC Smart Glass Industry Revenue Breakdown (Million, %) by Region 2024 & 2032
- Figure 2: North America APAC Smart Glass Industry Revenue (Million), by Technology 2024 & 2032
- Figure 3: North America APAC Smart Glass Industry Revenue Share (%), by Technology 2024 & 2032
- Figure 4: North America APAC Smart Glass Industry Revenue (Million), by Applications 2024 & 2032
- Figure 5: North America APAC Smart Glass Industry Revenue Share (%), by Applications 2024 & 2032
- Figure 6: North America APAC Smart Glass Industry Revenue (Million), by Country 2024 & 2032
- Figure 7: North America APAC Smart Glass Industry Revenue Share (%), by Country 2024 & 2032
- Figure 8: South America APAC Smart Glass Industry Revenue (Million), by Technology 2024 & 2032
- Figure 9: South America APAC Smart Glass Industry Revenue Share (%), by Technology 2024 & 2032
- Figure 10: South America APAC Smart Glass Industry Revenue (Million), by Applications 2024 & 2032
- Figure 11: South America APAC Smart Glass Industry Revenue Share (%), by Applications 2024 & 2032
- Figure 12: South America APAC Smart Glass Industry Revenue (Million), by Country 2024 & 2032
- Figure 13: South America APAC Smart Glass Industry Revenue Share (%), by Country 2024 & 2032
- Figure 14: Europe APAC Smart Glass Industry Revenue (Million), by Technology 2024 & 2032
- Figure 15: Europe APAC Smart Glass Industry Revenue Share (%), by Technology 2024 & 2032
- Figure 16: Europe APAC Smart Glass Industry Revenue (Million), by Applications 2024 & 2032
- Figure 17: Europe APAC Smart Glass Industry Revenue Share (%), by Applications 2024 & 2032
- Figure 18: Europe APAC Smart Glass Industry Revenue (Million), by Country 2024 & 2032
- Figure 19: Europe APAC Smart Glass Industry Revenue Share (%), by Country 2024 & 2032
- Figure 20: Middle East & Africa APAC Smart Glass Industry Revenue (Million), by Technology 2024 & 2032
- Figure 21: Middle East & Africa APAC Smart Glass Industry Revenue Share (%), by Technology 2024 & 2032
- Figure 22: Middle East & Africa APAC Smart Glass Industry Revenue (Million), by Applications 2024 & 2032
- Figure 23: Middle East & Africa APAC Smart Glass Industry Revenue Share (%), by Applications 2024 & 2032
- Figure 24: Middle East & Africa APAC Smart Glass Industry Revenue (Million), by Country 2024 & 2032
- Figure 25: Middle East & Africa APAC Smart Glass Industry Revenue Share (%), by Country 2024 & 2032
- Figure 26: Asia Pacific APAC Smart Glass Industry Revenue (Million), by Technology 2024 & 2032
- Figure 27: Asia Pacific APAC Smart Glass Industry Revenue Share (%), by Technology 2024 & 2032
- Figure 28: Asia Pacific APAC Smart Glass Industry Revenue (Million), by Applications 2024 & 2032
- Figure 29: Asia Pacific APAC Smart Glass Industry Revenue Share (%), by Applications 2024 & 2032
- Figure 30: Asia Pacific APAC Smart Glass Industry Revenue (Million), by Country 2024 & 2032
- Figure 31: Asia Pacific APAC Smart Glass Industry Revenue Share (%), by Country 2024 & 2032
List of Tables
- Table 1: Global APAC Smart Glass Industry Revenue Million Forecast, by Region 2019 & 2032
- Table 2: Global APAC Smart Glass Industry Revenue Million Forecast, by Technology 2019 & 2032
- Table 3: Global APAC Smart Glass Industry Revenue Million Forecast, by Applications 2019 & 2032
- Table 4: Global APAC Smart Glass Industry Revenue Million Forecast, by Region 2019 & 2032
- Table 5: Global APAC Smart Glass Industry Revenue Million Forecast, by Technology 2019 & 2032
- Table 6: Global APAC Smart Glass Industry Revenue Million Forecast, by Applications 2019 & 2032
- Table 7: Global APAC Smart Glass Industry Revenue Million Forecast, by Country 2019 & 2032
- Table 8: United States APAC Smart Glass Industry Revenue (Million) Forecast, by Application 2019 & 2032
- Table 9: Canada APAC Smart Glass Industry Revenue (Million) Forecast, by Application 2019 & 2032
- Table 10: Mexico APAC Smart Glass Industry Revenue (Million) Forecast, by Application 2019 & 2032
- Table 11: Global APAC Smart Glass Industry Revenue Million Forecast, by Technology 2019 & 2032
- Table 12: Global APAC Smart Glass Industry Revenue Million Forecast, by Applications 2019 & 2032
- Table 13: Global APAC Smart Glass Industry Revenue Million Forecast, by Country 2019 & 2032
- Table 14: Brazil APAC Smart Glass Industry Revenue (Million) Forecast, by Application 2019 & 2032
- Table 15: Argentina APAC Smart Glass Industry Revenue (Million) Forecast, by Application 2019 & 2032
- Table 16: Rest of South America APAC Smart Glass Industry Revenue (Million) Forecast, by Application 2019 & 2032
- Table 17: Global APAC Smart Glass Industry Revenue Million Forecast, by Technology 2019 & 2032
- Table 18: Global APAC Smart Glass Industry Revenue Million Forecast, by Applications 2019 & 2032
- Table 19: Global APAC Smart Glass Industry Revenue Million Forecast, by Country 2019 & 2032
- Table 20: United Kingdom APAC Smart Glass Industry Revenue (Million) Forecast, by Application 2019 & 2032
- Table 21: Germany APAC Smart Glass Industry Revenue (Million) Forecast, by Application 2019 & 2032
- Table 22: France APAC Smart Glass Industry Revenue (Million) Forecast, by Application 2019 & 2032
- Table 23: Italy APAC Smart Glass Industry Revenue (Million) Forecast, by Application 2019 & 2032
- Table 24: Spain APAC Smart Glass Industry Revenue (Million) Forecast, by Application 2019 & 2032
- Table 25: Russia APAC Smart Glass Industry Revenue (Million) Forecast, by Application 2019 & 2032
- Table 26: Benelux APAC Smart Glass Industry Revenue (Million) Forecast, by Application 2019 & 2032
- Table 27: Nordics APAC Smart Glass Industry Revenue (Million) Forecast, by Application 2019 & 2032
- Table 28: Rest of Europe APAC Smart Glass Industry Revenue (Million) Forecast, by Application 2019 & 2032
- Table 29: Global APAC Smart Glass Industry Revenue Million Forecast, by Technology 2019 & 2032
- Table 30: Global APAC Smart Glass Industry Revenue Million Forecast, by Applications 2019 & 2032
- Table 31: Global APAC Smart Glass Industry Revenue Million Forecast, by Country 2019 & 2032
- Table 32: Turkey APAC Smart Glass Industry Revenue (Million) Forecast, by Application 2019 & 2032
- Table 33: Israel APAC Smart Glass Industry Revenue (Million) Forecast, by Application 2019 & 2032
- Table 34: GCC APAC Smart Glass Industry Revenue (Million) Forecast, by Application 2019 & 2032
- Table 35: North Africa APAC Smart Glass Industry Revenue (Million) Forecast, by Application 2019 & 2032
- Table 36: South Africa APAC Smart Glass Industry Revenue (Million) Forecast, by Application 2019 & 2032
- Table 37: Rest of Middle East & Africa APAC Smart Glass Industry Revenue (Million) Forecast, by Application 2019 & 2032
- Table 38: Global APAC Smart Glass Industry Revenue Million Forecast, by Technology 2019 & 2032
- Table 39: Global APAC Smart Glass Industry Revenue Million Forecast, by Applications 2019 & 2032
- Table 40: Global APAC Smart Glass Industry Revenue Million Forecast, by Country 2019 & 2032
- Table 41: China APAC Smart Glass Industry Revenue (Million) Forecast, by Application 2019 & 2032
- Table 42: India APAC Smart Glass Industry Revenue (Million) Forecast, by Application 2019 & 2032
- Table 43: Japan APAC Smart Glass Industry Revenue (Million) Forecast, by Application 2019 & 2032
- Table 44: South Korea APAC Smart Glass Industry Revenue (Million) Forecast, by Application 2019 & 2032
- Table 45: ASEAN APAC Smart Glass Industry Revenue (Million) Forecast, by Application 2019 & 2032
- Table 46: Oceania APAC Smart Glass Industry Revenue (Million) Forecast, by Application 2019 & 2032
- Table 47: Rest of Asia Pacific APAC Smart Glass Industry Revenue (Million) Forecast, by Application 2019 & 2032
Frequently Asked Questions
1. What is the projected Compound Annual Growth Rate (CAGR) of the APAC Smart Glass Industry?
The projected CAGR is approximately 14.00%.
2. Which companies are prominent players in the APAC Smart Glass Industry?
Key companies in the market include Polytronix, Scienstry Inc, Saint-Gobain, Pulp Studio, Smartglass International, Citala, Pro Display, Asahi Glass Corporation, Gentex Corporation, Nippon, Ravenbrick, Hitachi Chemical, LTI Smart Glass, PPG Industries, View Inc.
3. What are the main segments of the APAC Smart Glass Industry?
The market segments include Technology, Applications.
4. Can you provide details about the market size?
The market size is estimated to be USD XX Million as of 2022.
5. What are some drivers contributing to market growth?
Increasing focus on Energy Conservation and Environment Friendly Technologies; Government Regulations; Increasing demand for energy savings techniques.
6. What are the notable trends driving market growth?
Construction industry is expected to have further growth opportunities in the market.
7. Are there any restraints impacting market growth?
Lack of Awareness of Smart Glass Benefits; Technical Issues with the Usage of Large Size Smart Glass.
8. Can you provide examples of recent developments in the market?
September 2021: Xiaomi launched its own smart glasses, which are capable of taking photos, displaying messages and notifications, making calls, providing navigation, and translating text right in real-time in front of eyes. The glasses also have an indicator light that shows when the 5-megapixel camera is in use.
9. What pricing options are available for accessing the report?
Pricing options include single-user, multi-user, and enterprise licenses priced at USD 4750, USD 4950, and USD 6800 respectively.
10. Is the market size provided in terms of value or volume?
The market size is provided in terms of value, measured in Million.
11. Are there any specific market keywords associated with the report?
Yes, the market keyword associated with the report is "APAC Smart Glass Industry," which aids in identifying and referencing the specific market segment covered.
12. How do I determine which pricing option suits my needs best?
The pricing options vary based on user requirements and access needs. Individual users may opt for single-user licenses, while businesses requiring broader access may choose multi-user or enterprise licenses for cost-effective access to the report.
13. Are there any additional resources or data provided in the APAC Smart Glass Industry report?
While the report offers comprehensive insights, it's advisable to review the specific contents or supplementary materials provided to ascertain if additional resources or data are available.
14. How can I stay updated on further developments or reports in the APAC Smart Glass Industry?
To stay informed about further developments, trends, and reports in the APAC Smart Glass Industry, consider subscribing to industry newsletters, following relevant companies and organizations, or regularly checking reputable industry news sources and publications.
Methodology
Step 1 - Identification of Relevant Samples Size from Population Database


Step 2 - Approaches for Defining Global Market Size (Value, Volume* & Price*)

Note*: In applicable scenarios
Step 3 - Data Sources
Primary Research
- Web Analytics
- Survey Reports
- Research Institute
- Latest Research Reports
- Opinion Leaders
Secondary Research
- Annual Reports
- White Paper
- Latest Press Release
- Industry Association
- Paid Database
- Investor Presentations

Step 4 - Data Triangulation
Involves using different sources of information in order to increase the validity of a study
These sources are likely to be stakeholders in a program - participants, other researchers, program staff, other community members, and so on.
Then we put all data in single framework & apply various statistical tools to find out the dynamic on the market.
During the analysis stage, feedback from the stakeholder groups would be compared to determine areas of agreement as well as areas of divergence


