

Key Insights
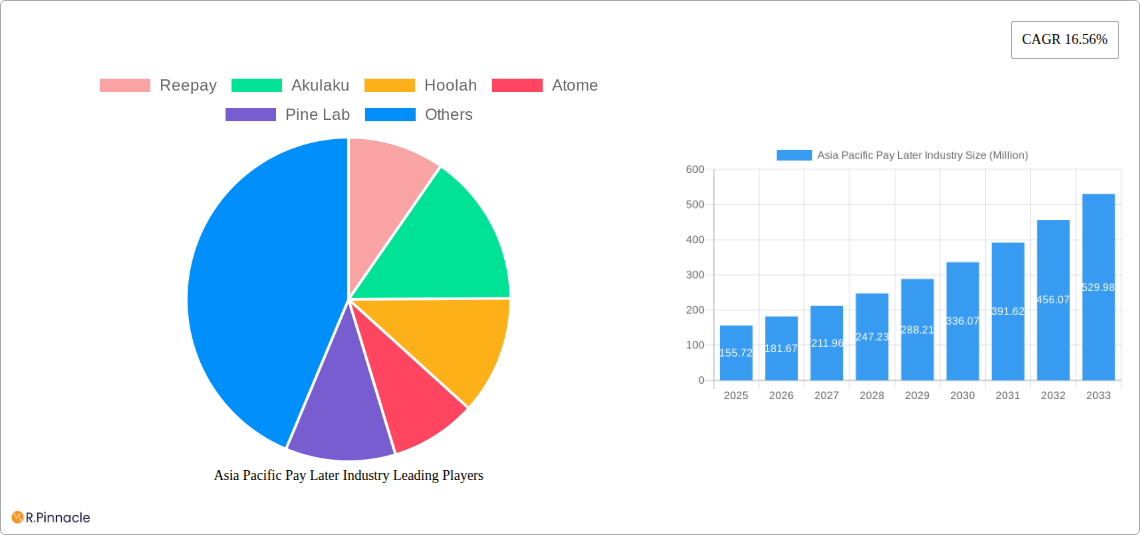
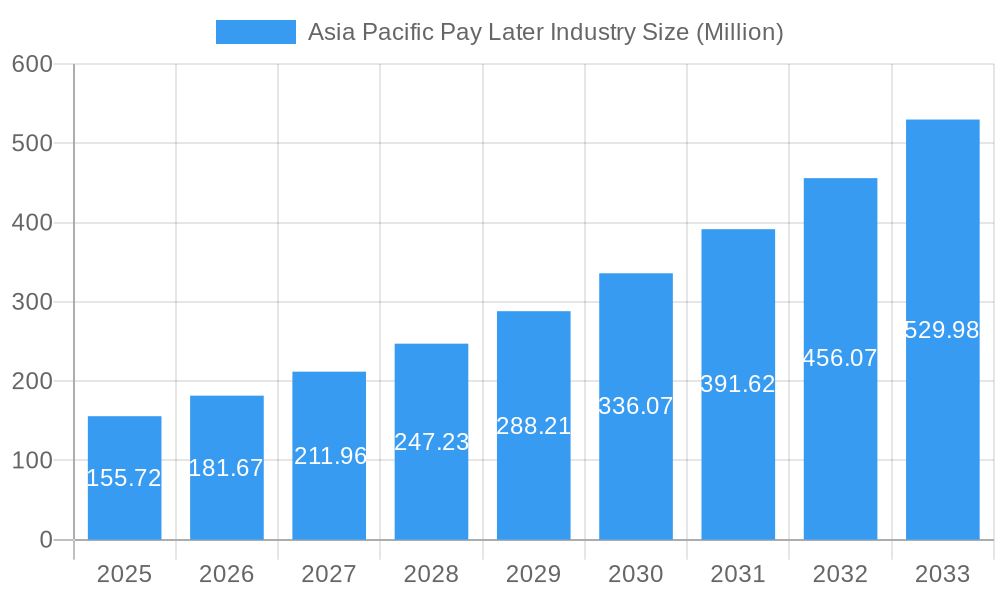
The Asia Pacific Buy Now, Pay Later (BNPL) market is experiencing explosive growth, projected to reach \$155.72 million in 2025 and maintain a Compound Annual Growth Rate (CAGR) of 16.56% from 2025 to 2033. This rapid expansion is driven by several key factors. Increasing smartphone penetration and e-commerce adoption across the region fuel consumer demand for flexible payment options. A young, digitally savvy population readily embraces BNPL services, while a lack of access to traditional credit lines in certain areas creates a significant untapped market. Furthermore, the increasing prevalence of mobile wallets and seamless integration with e-commerce platforms are further streamlining the BNPL user experience, encouraging wider adoption. Competitive rivalry amongst established players like Reepay, Akulaku, Hoolah, Atome, Pine Labs, Zest Money, Openpay, Rely, Limepay, and PayRight, coupled with the emergence of new entrants, fuels innovation and drives down costs, making BNPL even more attractive to consumers.
Asia Pacific Pay Later Industry Market Size (In Million)
However, challenges remain. Regulatory scrutiny is intensifying globally concerning consumer protection and responsible lending practices within the BNPL sector. This regulatory uncertainty could potentially stifle growth if stringent regulations are implemented. Furthermore, concerns about increasing consumer debt and potential risks associated with impulsive spending need to be addressed to ensure the long-term sustainability and responsible growth of the BNPL market. Strategic partnerships between BNPL providers and financial institutions will be crucial to navigate these challenges, enhance risk management, and build trust amongst consumers and regulators. The future success of the Asia Pacific BNPL market hinges on a balance between rapid expansion, sustainable growth, and the implementation of responsible lending practices.
Asia Pacific Pay Later Industry Company Market Share
Asia Pacific Pay Later Industry Report: 2019-2033
This comprehensive report provides an in-depth analysis of the Asia Pacific Pay Later industry, offering actionable insights for industry professionals, investors, and strategists. With a study period spanning 2019-2033, a base year of 2025, and an estimated and forecast period of 2025-2033, this report leverages historical data (2019-2024) to project future market trends. The report covers key market segments, leading players like Reepay, Akulaku, Hoolah, Atome, Pine Lab, Zest Money BNPL, Openpay (Australia), Rely (Singapore), Limepay (Australia), and PayRight (Australia), and significant industry developments to provide a complete picture of this rapidly evolving market. The total market size is projected to reach xx Million by 2033.
Asia Pacific Pay Later Industry Market Structure & Innovation Trends
The Asia Pacific Pay Later market exhibits a moderately concentrated structure, with a few dominant players and a large number of smaller, regional players. Market share is dynamic, influenced by aggressive expansion strategies, technological innovations, and evolving regulatory landscapes. Innovation is driven primarily by the need for enhanced security, personalized customer experiences, and seamless integration with existing e-commerce platforms. Regulatory frameworks vary significantly across countries, creating both opportunities and challenges for businesses. The primary product substitutes are traditional credit cards and other forms of financing, however, the convenience and accessibility of BNPL solutions are leading to market share gains. The end-user demographic skews towards younger, tech-savvy consumers, with a growing adoption rate among older demographics. M&A activity has been significant, with deal values ranging from xx Million to xx Million, demonstrating consolidation and expansion strategies within the industry.
- Market Concentration: Moderately concentrated, with top 5 players holding approximately xx% market share in 2024.
- Innovation Drivers: Enhanced security, personalized experiences, seamless e-commerce integration.
- Regulatory Frameworks: Vary significantly across countries, impacting market entry and operation.
- Product Substitutes: Traditional credit cards, other financing options.
- End-User Demographics: Primarily younger, tech-savvy consumers, expanding to older demographics.
- M&A Activity: Significant, with deal values ranging from xx Million to xx Million.
Asia Pacific Pay Later Industry Market Dynamics & Trends
The Asia Pacific Pay Later market is experiencing robust growth, driven by increasing e-commerce adoption, rising smartphone penetration, and a preference for flexible payment options among consumers. Technological disruptions such as open banking and embedded finance are further fueling market expansion. Consumer preferences are shifting towards convenient and transparent payment solutions, with a focus on personalized offers and rewards programs. Competitive dynamics are intense, with players focusing on differentiated offerings, strategic partnerships, and aggressive marketing campaigns. The Compound Annual Growth Rate (CAGR) is estimated at xx% during the forecast period (2025-2033), and market penetration is expected to reach xx% by 2033.
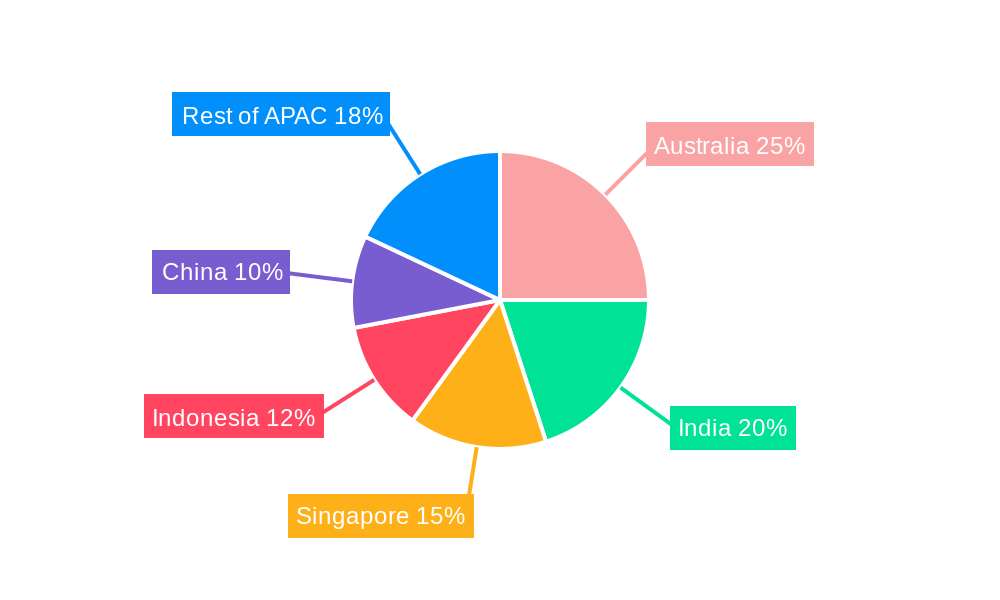
Dominant Regions & Segments in Asia Pacific Pay Later Industry
China and India are currently the dominant markets within the Asia-Pacific region, fueled by large and rapidly growing e-commerce sectors and a rising middle class. However, other countries like Australia, Singapore, and Indonesia are also exhibiting significant growth potential.
- Key Drivers in China: Strong e-commerce infrastructure, high smartphone penetration, supportive government policies.
- Key Drivers in India: Rapidly expanding digital economy, increasing financial inclusion, favorable demographic trends.
- Dominance Analysis: China and India account for approximately xx% of the total market, driven by factors such as large populations, high internet penetration, and the increasing popularity of online shopping. The market is fragmented across the region, with other countries showing promising potential.
Asia Pacific Pay Later Industry Product Innovations
Recent product innovations include the integration of AI-powered risk assessment tools, enhanced fraud detection mechanisms, and personalized payment plans tailored to individual customer needs. These advancements are enhancing the user experience and reducing the risk of defaults. The market is also seeing the integration of BNPL solutions into a wider range of platforms and applications, including social commerce and in-store payments. This increasing accessibility and convenience fuels market growth.
Report Scope & Segmentation Analysis
This report segments the Asia Pacific Pay Later market based on payment method (e.g., credit card, debit card), transaction value, deployment mode (online, offline), end-user (e.g., individual, business), and country. Each segment exhibits unique growth trajectories and competitive dynamics. For instance, the online segment currently holds a larger market share compared to offline. Growth projections vary across segments, with the online and high transaction value segments experiencing the most rapid growth. Competitive intensity is higher in the online segment due to the larger number of players.
Key Drivers of Asia Pacific Pay Later Industry Growth
The growth of the Asia Pacific Pay Later industry is fueled by several key factors:
- Rising E-commerce: Increased online shopping drives the need for convenient payment options.
- Smartphone Penetration: High smartphone adoption facilitates access to BNPL services.
- Financial Inclusion: BNPL solutions extend credit to underbanked populations.
- Favorable Regulatory Environment (in certain markets): Supportive policies encourage industry growth.
Challenges in the Asia Pacific Pay Later Industry Sector
The industry faces challenges, including:
- Regulatory Uncertainty: Varying regulations across countries create complexities for businesses.
- Credit Risk Management: High default rates pose a significant challenge.
- Competition: Intense competition from established players and new entrants.
Emerging Opportunities in Asia Pacific Pay Later Industry
Emerging opportunities include:
- Expansion into Underserved Markets: Reaching new customer segments in less developed regions.
- Integration with Fintech Platforms: Leveraging partnerships to expand reach and functionality.
- Development of Innovative Products: Creating tailored solutions to meet diverse consumer needs.
Leading Players in the Asia Pacific Pay Later Industry Market
- Reepay
- Akulaku
- Hoolah
- Atome
- Pine Lab
- Zest Money BNPL
- Openpay (Australia)
- Rely (Singapore)
- Limepay (Australia)
- PayRight (Australia)
- List Not Exhaustive
Key Developments in Asia Pacific Pay Later Industry
- June 2022: Kuaishou launched Sesame Credit's BNPL service in China.
- February 2023: CRED launched its BNPL service in India.
Future Outlook for Asia Pacific Pay Later Industry Market
The Asia Pacific Pay Later market is poised for continued strong growth, driven by increasing digitalization, favorable demographics, and ongoing technological innovation. Strategic partnerships, expansion into new markets, and the development of innovative products will be key success factors for companies operating in this dynamic market. The market is expected to witness significant consolidation and further technological advancements in the coming years.
Asia Pacific Pay Later Industry Segmentation
-
1. Channel
- 1.1. Online
- 1.2. POS
-
2. Enterprise
- 2.1. Large Enterprises
- 2.2. Small & Medium Enterprises
- 2.3. Others
-
3. End User
- 3.1. Consmer electronics
- 3.2. Fashion & garments
- 3.3. Healthcare
- 3.4. Leisure & entertainment
- 3.5. Retail
- 3.6. Others
Asia Pacific Pay Later Industry Segmentation By Geography
-
1. Asia Pacific
- 1.1. China
- 1.2. Japan
- 1.3. South Korea
- 1.4. India
- 1.5. Australia
- 1.6. New Zealand
- 1.7. Indonesia
- 1.8. Malaysia
- 1.9. Singapore
- 1.10. Thailand
- 1.11. Vietnam
- 1.12. Philippines
Asia Pacific Pay Later Industry Regional Market Share
Geographic Coverage of Asia Pacific Pay Later Industry
Asia Pacific Pay Later Industry REPORT HIGHLIGHTS
| Aspects | Details |
|---|---|
| Study Period | 2020-2034 |
| Base Year | 2025 |
| Estimated Year | 2026 |
| Forecast Period | 2026-2034 |
| Historical Period | 2020-2025 |
| Growth Rate | CAGR of 16.56% from 2020-2034 |
| Segmentation |
|
Table of Contents
- 1. Introduction
- 1.1. Research Scope
- 1.2. Market Segmentation
- 1.3. Research Objective
- 1.4. Definitions and Assumptions
- 2. Executive Summary
- 2.1. Market Snapshot
- 3. Market Dynamics
- 3.1. Market Drivers
- 3.2. Market Restrains
- 3.3. Market Trends
- 3.4. Market Opportunities
- 4. Market Factor Analysis
- 4.1. Porters Five Forces
- 4.1.1. Bargaining Power of Suppliers
- 4.1.2. Bargaining Power of Buyers
- 4.1.3. Threat of New Entrants
- 4.1.4. Threat of Substitutes
- 4.1.5. Competitive Rivalry
- 4.2. PESTEL analysis
- 4.3. BCG Analysis
- 4.3.1. Stars (High Growth, High Market Share)
- 4.3.2. Cash Cows (Low Growth, High Market Share)
- 4.3.3. Question Mark (High Growth, Low Market Share)
- 4.3.4. Dogs (Low Growth, Low Market Share)
- 4.4. Ansoff Matrix Analysis
- 4.5. Supply Chain Analysis
- 4.6. Regulatory Landscape
- 4.7. Current Market Potential and Opportunity Assessment (TAM–SAM–SOM Framework)
- 4.8. PRI Analyst Note
- 4.1. Porters Five Forces
- 5. Market Analysis, Insights and Forecast 2021-2033
- 5.1. Market Analysis, Insights and Forecast - by Channel
- 5.1.1. Online
- 5.1.2. POS
- 5.2. Market Analysis, Insights and Forecast - by Enterprise
- 5.2.1. Large Enterprises
- 5.2.2. Small & Medium Enterprises
- 5.2.3. Others
- 5.3. Market Analysis, Insights and Forecast - by End User
- 5.3.1. Consmer electronics
- 5.3.2. Fashion & garments
- 5.3.3. Healthcare
- 5.3.4. Leisure & entertainment
- 5.3.5. Retail
- 5.3.6. Others
- 5.4. Market Analysis, Insights and Forecast - by Region
- 5.4.1. Asia Pacific
- 5.1. Market Analysis, Insights and Forecast - by Channel
- 6. Asia Pacific Pay Later Industry Analysis, Insights and Forecast, 2021-2033
- 6.1. Market Analysis, Insights and Forecast - by Channel
- 6.1.1. Online
- 6.1.2. POS
- 6.2. Market Analysis, Insights and Forecast - by Enterprise
- 6.2.1. Large Enterprises
- 6.2.2. Small & Medium Enterprises
- 6.2.3. Others
- 6.3. Market Analysis, Insights and Forecast - by End User
- 6.3.1. Consmer electronics
- 6.3.2. Fashion & garments
- 6.3.3. Healthcare
- 6.3.4. Leisure & entertainment
- 6.3.5. Retail
- 6.3.6. Others
- 6.1. Market Analysis, Insights and Forecast - by Channel
- 7. Competitive Analysis
- 7.1. Company Profiles
- 7.1.1 Reepay
- 7.1.1.1. Company Overview
- 7.1.1.2. Products
- 7.1.1.3. Company Financials
- 7.1.1.4. SWOT Analysis
- 7.1.2 Akulaku
- 7.1.2.1. Company Overview
- 7.1.2.2. Products
- 7.1.2.3. Company Financials
- 7.1.2.4. SWOT Analysis
- 7.1.3 Hoolah
- 7.1.3.1. Company Overview
- 7.1.3.2. Products
- 7.1.3.3. Company Financials
- 7.1.3.4. SWOT Analysis
- 7.1.4 Atome
- 7.1.4.1. Company Overview
- 7.1.4.2. Products
- 7.1.4.3. Company Financials
- 7.1.4.4. SWOT Analysis
- 7.1.5 Pine Lab
- 7.1.5.1. Company Overview
- 7.1.5.2. Products
- 7.1.5.3. Company Financials
- 7.1.5.4. SWOT Analysis
- 7.1.6 Zest Money BNPL
- 7.1.6.1. Company Overview
- 7.1.6.2. Products
- 7.1.6.3. Company Financials
- 7.1.6.4. SWOT Analysis
- 7.1.7 Openpay (Australia)
- 7.1.7.1. Company Overview
- 7.1.7.2. Products
- 7.1.7.3. Company Financials
- 7.1.7.4. SWOT Analysis
- 7.1.8 Rely (Singapore)
- 7.1.8.1. Company Overview
- 7.1.8.2. Products
- 7.1.8.3. Company Financials
- 7.1.8.4. SWOT Analysis
- 7.1.9 Limepay (Australia)
- 7.1.9.1. Company Overview
- 7.1.9.2. Products
- 7.1.9.3. Company Financials
- 7.1.9.4. SWOT Analysis
- 7.1.10 PayRight (Australia)**List Not Exhaustive
- 7.1.10.1. Company Overview
- 7.1.10.2. Products
- 7.1.10.3. Company Financials
- 7.1.10.4. SWOT Analysis
- 7.1.1 Reepay
- 7.2. Market Entropy
- 7.2.1 Company's Key Areas Served
- 7.2.2 Recent Developments
- 7.3. Company Market Share Analysis 2025
- 7.3.1 Top 5 Companies Market Share Analysis
- 7.3.2 Top 3 Companies Market Share Analysis
- 7.4. List of Potential Customers
- 8. Research Methodology
List of Figures
- Figure 1: Asia Pacific Pay Later Industry Revenue Breakdown (Million, %) by Product 2025 & 2033
- Figure 2: Asia Pacific Pay Later Industry Share (%) by Company 2025
List of Tables
- Table 1: Asia Pacific Pay Later Industry Revenue Million Forecast, by Channel 2020 & 2033
- Table 2: Asia Pacific Pay Later Industry Volume Billion Forecast, by Channel 2020 & 2033
- Table 3: Asia Pacific Pay Later Industry Revenue Million Forecast, by Enterprise 2020 & 2033
- Table 4: Asia Pacific Pay Later Industry Volume Billion Forecast, by Enterprise 2020 & 2033
- Table 5: Asia Pacific Pay Later Industry Revenue Million Forecast, by End User 2020 & 2033
- Table 6: Asia Pacific Pay Later Industry Volume Billion Forecast, by End User 2020 & 2033
- Table 7: Asia Pacific Pay Later Industry Revenue Million Forecast, by Region 2020 & 2033
- Table 8: Asia Pacific Pay Later Industry Volume Billion Forecast, by Region 2020 & 2033
- Table 9: Asia Pacific Pay Later Industry Revenue Million Forecast, by Channel 2020 & 2033
- Table 10: Asia Pacific Pay Later Industry Volume Billion Forecast, by Channel 2020 & 2033
- Table 11: Asia Pacific Pay Later Industry Revenue Million Forecast, by Enterprise 2020 & 2033
- Table 12: Asia Pacific Pay Later Industry Volume Billion Forecast, by Enterprise 2020 & 2033
- Table 13: Asia Pacific Pay Later Industry Revenue Million Forecast, by End User 2020 & 2033
- Table 14: Asia Pacific Pay Later Industry Volume Billion Forecast, by End User 2020 & 2033
- Table 15: Asia Pacific Pay Later Industry Revenue Million Forecast, by Country 2020 & 2033
- Table 16: Asia Pacific Pay Later Industry Volume Billion Forecast, by Country 2020 & 2033
- Table 17: China Asia Pacific Pay Later Industry Revenue (Million) Forecast, by Application 2020 & 2033
- Table 18: China Asia Pacific Pay Later Industry Volume (Billion) Forecast, by Application 2020 & 2033
- Table 19: Japan Asia Pacific Pay Later Industry Revenue (Million) Forecast, by Application 2020 & 2033
- Table 20: Japan Asia Pacific Pay Later Industry Volume (Billion) Forecast, by Application 2020 & 2033
- Table 21: South Korea Asia Pacific Pay Later Industry Revenue (Million) Forecast, by Application 2020 & 2033
- Table 22: South Korea Asia Pacific Pay Later Industry Volume (Billion) Forecast, by Application 2020 & 2033
- Table 23: India Asia Pacific Pay Later Industry Revenue (Million) Forecast, by Application 2020 & 2033
- Table 24: India Asia Pacific Pay Later Industry Volume (Billion) Forecast, by Application 2020 & 2033
- Table 25: Australia Asia Pacific Pay Later Industry Revenue (Million) Forecast, by Application 2020 & 2033
- Table 26: Australia Asia Pacific Pay Later Industry Volume (Billion) Forecast, by Application 2020 & 2033
- Table 27: New Zealand Asia Pacific Pay Later Industry Revenue (Million) Forecast, by Application 2020 & 2033
- Table 28: New Zealand Asia Pacific Pay Later Industry Volume (Billion) Forecast, by Application 2020 & 2033
- Table 29: Indonesia Asia Pacific Pay Later Industry Revenue (Million) Forecast, by Application 2020 & 2033
- Table 30: Indonesia Asia Pacific Pay Later Industry Volume (Billion) Forecast, by Application 2020 & 2033
- Table 31: Malaysia Asia Pacific Pay Later Industry Revenue (Million) Forecast, by Application 2020 & 2033
- Table 32: Malaysia Asia Pacific Pay Later Industry Volume (Billion) Forecast, by Application 2020 & 2033
- Table 33: Singapore Asia Pacific Pay Later Industry Revenue (Million) Forecast, by Application 2020 & 2033
- Table 34: Singapore Asia Pacific Pay Later Industry Volume (Billion) Forecast, by Application 2020 & 2033
- Table 35: Thailand Asia Pacific Pay Later Industry Revenue (Million) Forecast, by Application 2020 & 2033
- Table 36: Thailand Asia Pacific Pay Later Industry Volume (Billion) Forecast, by Application 2020 & 2033
- Table 37: Vietnam Asia Pacific Pay Later Industry Revenue (Million) Forecast, by Application 2020 & 2033
- Table 38: Vietnam Asia Pacific Pay Later Industry Volume (Billion) Forecast, by Application 2020 & 2033
- Table 39: Philippines Asia Pacific Pay Later Industry Revenue (Million) Forecast, by Application 2020 & 2033
- Table 40: Philippines Asia Pacific Pay Later Industry Volume (Billion) Forecast, by Application 2020 & 2033
Frequently Asked Questions
1. What is the projected Compound Annual Growth Rate (CAGR) of the Asia Pacific Pay Later Industry?
The projected CAGR is approximately 16.56%.
2. Which companies are prominent players in the Asia Pacific Pay Later Industry?
Key companies in the market include Reepay, Akulaku, Hoolah, Atome, Pine Lab, Zest Money BNPL, Openpay (Australia), Rely (Singapore), Limepay (Australia), PayRight (Australia)**List Not Exhaustive.
3. What are the main segments of the Asia Pacific Pay Later Industry?
The market segments include Channel, Enterprise, End User.
4. Can you provide details about the market size?
The market size is estimated to be USD 155.72 Million as of 2022.
5. What are some drivers contributing to market growth?
Lack Of Credit Availability In Small Transaction Driving BNPL Services; Rise In The Value Of Digital Transaction In Asia Pacific.
6. What are the notable trends driving market growth?
Rising Digital Payments.
7. Are there any restraints impacting market growth?
Lack Of Credit Availability In Small Transaction Driving BNPL Services; Rise In The Value Of Digital Transaction In Asia Pacific.
8. Can you provide examples of recent developments in the market?
In June 2022, China E-commerce firm Kuaishou launched Sesame Credit's buy now and pay later (BNPL) service. Under the service users with a Sesame score of 550 and above will be able to order, receive, and try the products before paying on its e-commerce platform allowing its customers to easily return and exchange goods.
9. What pricing options are available for accessing the report?
Pricing options include single-user, multi-user, and enterprise licenses priced at USD 4750, USD 4950, and USD 6800 respectively.
10. Is the market size provided in terms of value or volume?
The market size is provided in terms of value, measured in Million and volume, measured in Billion.
11. Are there any specific market keywords associated with the report?
Yes, the market keyword associated with the report is "Asia Pacific Pay Later Industry," which aids in identifying and referencing the specific market segment covered.
12. How do I determine which pricing option suits my needs best?
The pricing options vary based on user requirements and access needs. Individual users may opt for single-user licenses, while businesses requiring broader access may choose multi-user or enterprise licenses for cost-effective access to the report.
13. Are there any additional resources or data provided in the Asia Pacific Pay Later Industry report?
While the report offers comprehensive insights, it's advisable to review the specific contents or supplementary materials provided to ascertain if additional resources or data are available.
14. How can I stay updated on further developments or reports in the Asia Pacific Pay Later Industry?
To stay informed about further developments, trends, and reports in the Asia Pacific Pay Later Industry, consider subscribing to industry newsletters, following relevant companies and organizations, or regularly checking reputable industry news sources and publications.
Methodology
Step 1 - Identification of Relevant Samples Size from Population Database


Step 2 - Approaches for Defining Global Market Size (Value, Volume* & Price*)

Note*: In applicable scenarios
Step 3 - Data Sources
Primary Research
- Web Analytics
- Survey Reports
- Research Institute
- Latest Research Reports
- Opinion Leaders
Secondary Research
- Annual Reports
- White Paper
- Latest Press Release
- Industry Association
- Paid Database
- Investor Presentations

Step 4 - Data Triangulation
Involves using different sources of information in order to increase the validity of a study
These sources are likely to be stakeholders in a program - participants, other researchers, program staff, other community members, and so on.
Then we put all data in single framework & apply various statistical tools to find out the dynamic on the market.
During the analysis stage, feedback from the stakeholder groups would be compared to determine areas of agreement as well as areas of divergence