
Key Insights
The Blockchain in Manufacturing market is experiencing explosive growth, projected to reach a significant value by 2033. A Compound Annual Growth Rate (CAGR) of 76.26% from 2019 to 2024 indicates substantial market expansion fueled by several key drivers. Increased demand for enhanced supply chain transparency and traceability is a primary factor. Businesses are increasingly leveraging blockchain to combat counterfeiting, improve quality control, and ensure regulatory compliance, particularly in sensitive sectors like pharmaceuticals and aerospace. The rising adoption of Industry 4.0 technologies, including IoT and AI, is further accelerating blockchain's integration into manufacturing processes. Logistics and supply chain management represent a major application segment, benefiting from improved efficiency and reduced operational costs through enhanced visibility and data integrity. North America and Europe currently hold significant market shares, but the Asia-Pacific region is poised for substantial growth driven by increasing manufacturing activities and technology adoption in countries like China and India. While challenges remain, such as the complexity of implementing blockchain solutions and the need for robust cybersecurity measures, the overall market outlook remains highly positive.
The competitive landscape features a mix of established technology giants like IBM, Microsoft, and SAP, alongside specialized blockchain companies and industry-specific solution providers. These companies are actively developing and deploying blockchain solutions tailored to meet the specific needs of different manufacturing sectors. The continuous improvement of blockchain technology, including scalability and interoperability enhancements, will further fuel market growth. Furthermore, the increasing collaboration between technology providers and manufacturing companies fosters a supportive ecosystem for blockchain adoption, accelerating its integration into various manufacturing processes. Future market expansion will be shaped by factors such as the evolving regulatory landscape, the development of new blockchain applications, and the overall adoption of digital transformation strategies across the manufacturing industry. The market’s considerable growth potential, driven by these factors, makes it an attractive area for investment and strategic partnerships.
Blockchain in Manufacturing Industry: A Comprehensive Market Report (2019-2033)
This in-depth report provides a comprehensive analysis of the Blockchain in Manufacturing Industry market, offering invaluable insights for industry professionals, investors, and strategists. With a study period spanning 2019-2033, a base year of 2025, and a forecast period of 2025-2033, this report leverages extensive data analysis to project a robust market growth trajectory. The report covers key market segments, dominant players, and emerging trends, presenting actionable intelligence to navigate the dynamic landscape of blockchain technology in manufacturing. The total market size is predicted to reach xx Million by 2033.
Blockchain in Manufacturing Industry Market Structure & Innovation Trends
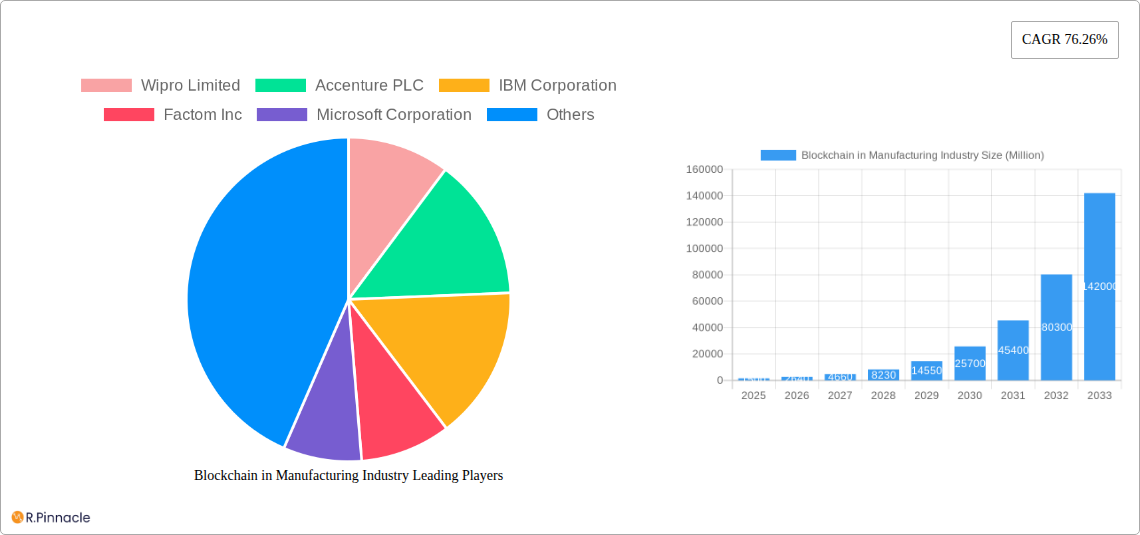
This section analyzes the competitive landscape of the Blockchain in Manufacturing Industry, encompassing market concentration, innovation drivers, regulatory frameworks, product substitutes, end-user demographics, and M&A activities. The market exhibits a moderately consolidated structure with key players like Wipro Limited, Accenture PLC, IBM Corporation, and others holding significant market shares. However, the entry of new players and technological advancements are fostering a dynamic competitive environment.
- Market Concentration: The top 5 players account for approximately xx% of the market share in 2025.
- Innovation Drivers: Increased demand for supply chain transparency, growing concerns about counterfeit products, and the need for enhanced quality control are driving innovation.
- Regulatory Frameworks: Government initiatives promoting blockchain adoption and standardization efforts are shaping market development. However, regulatory uncertainties in certain regions still pose challenges.
- Product Substitutes: Traditional methods of tracking and managing supply chains pose a challenge to blockchain adoption.
- End-User Demographics: Adoption is driven by large enterprises across various sectors, with automotive and pharmaceutical industries leading the way. The consumer electronics and aerospace sectors are fast followers.
- M&A Activities: The past five years have witnessed several significant M&A deals in the blockchain space, with a total value exceeding xx Million, primarily focused on acquiring specialized blockchain expertise and expanding market reach.
Blockchain in Manufacturing Industry Market Dynamics & Trends
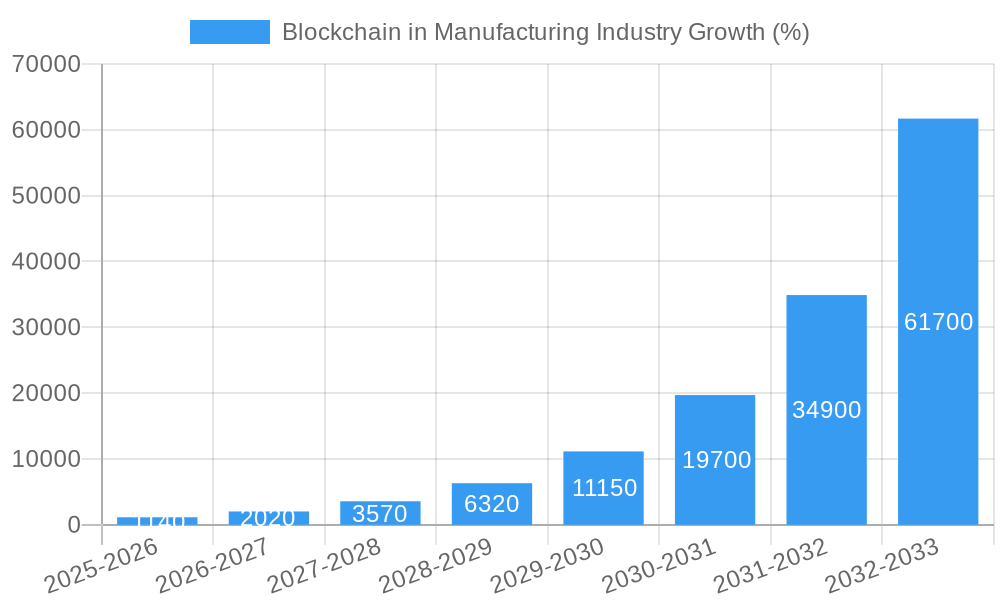
The Blockchain in Manufacturing Industry is experiencing significant growth, driven by several factors. The market is projected to witness a Compound Annual Growth Rate (CAGR) of xx% during the forecast period (2025-2033). This growth is fueled by increasing adoption across various applications, including logistics and supply chain management, counterfeit management, and quality control. Technological advancements are significantly impacting the industry's trajectory; the increased efficiency and security offered by blockchain solutions attract more manufacturers. Consumer demand for transparency and traceability in products further propels market adoption. The competitive landscape remains dynamic, with existing players expanding their offerings and new entrants emerging with innovative solutions. Market penetration is steadily growing, with xx% of manufacturers adopting blockchain solutions in 2025.
Dominant Regions & Segments in Blockchain in Manufacturing Industry
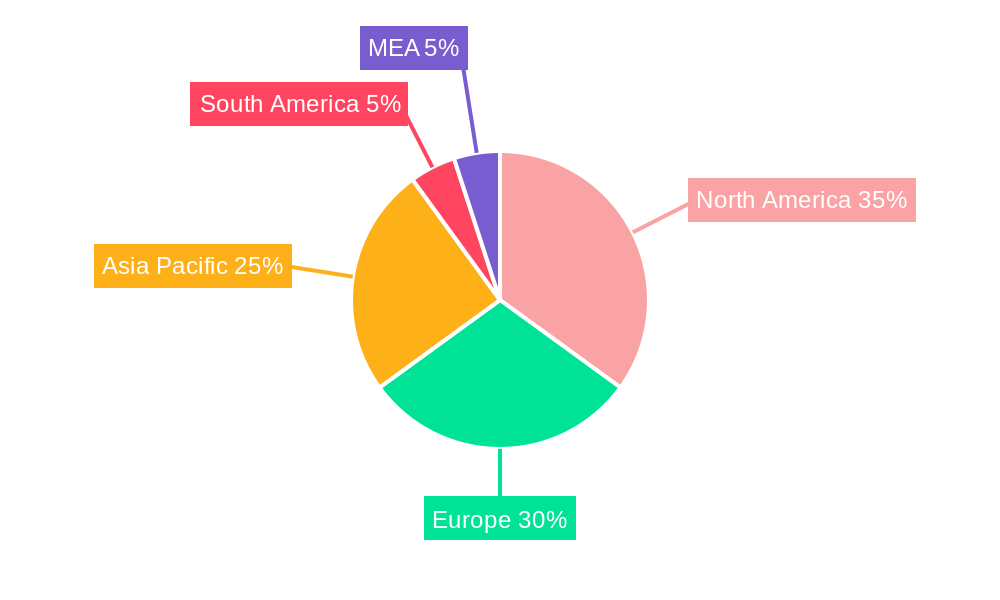
The North American region currently dominates the Blockchain in Manufacturing Industry market due to robust technology infrastructure, early adoption, and supportive government policies. However, the Asia-Pacific region is expected to show significant growth potential.
Key Drivers:
- North America: Strong technological infrastructure, early adoption by major players, and supportive regulatory environments.
- Europe: Increasing focus on supply chain transparency and regulatory compliance.
- Asia-Pacific: Rapid industrialization and growth of e-commerce.
Dominant Segments:
- Application: Logistics and Supply Chain Management currently holds the largest market share, driven by the need for enhanced traceability and efficiency.
- End-user Vertical: The Automotive industry demonstrates high adoption rates due to stringent quality and compliance requirements. Pharmaceutical and aerospace industries follow closely.
Blockchain in Manufacturing Industry Product Innovations
Recent product innovations focus on improving scalability, interoperability, and ease of integration. New platforms and solutions are being developed to address specific industry needs, such as managing digital identities and ensuring data security. The market is witnessing a shift towards more user-friendly interfaces and improved data visualization capabilities to maximize the value of blockchain technology for manufacturing businesses. These advancements are further enhancing the market fit and competitive advantages for industry players.
Report Scope & Segmentation Analysis
This report segments the Blockchain in Manufacturing Industry market across various applications and end-user verticals:
Logistics and Supply Chain Management: This segment is projected to reach xx Million by 2033, experiencing a CAGR of xx% during the forecast period. The market is characterized by a high level of competition among existing players and the emergence of new entrants.
Counterfeit Management: This segment is expected to experience substantial growth, driven by the rising incidence of counterfeit products and increased consumer demand for authenticity.
Quality Control and Compliance: This segment is projected to grow at a CAGR of xx% due to the need for improved product quality assurance and compliance with industry regulations.
Other Applications: This includes segments like asset tracking, provenance tracking, and intellectual property rights management.
Automotive: High adoption due to the need for enhanced supply chain visibility and traceability. The segment is predicted to reach xx Million by 2033.
Aerospace and Defense: Stringent security and quality standards drive adoption, with growth projections of xx% CAGR.
Pharmaceutical: This segment focuses on ensuring the authenticity and traceability of drugs, with market size reaching xx Million by 2033.
Consumer Electronics: Growth is driven by demand for transparent and traceable supply chains.
Other End-user Verticals: Includes various manufacturing sectors implementing blockchain solutions.
Key Drivers of Blockchain in Manufacturing Industry Growth
Several factors contribute to the growth of the Blockchain in Manufacturing Industry. Technological advancements, especially the development of more efficient and scalable blockchain platforms, are key drivers. The increasing need for enhanced supply chain transparency and traceability also fuels adoption. Furthermore, supportive government regulations and incentives are promoting wider implementation across various industries. The economic benefits of blockchain, such as reduced costs and improved efficiency, are also powerful drivers.
Challenges in the Blockchain in Manufacturing Industry Sector
Despite significant growth potential, several challenges hinder wider adoption. Regulatory uncertainties and lack of standardization pose significant hurdles. Interoperability issues between different blockchain platforms remain a concern. The initial investment costs associated with implementing blockchain solutions can be high, posing a barrier for smaller manufacturers. Moreover, the lack of skilled professionals experienced in blockchain technology restricts widespread adoption.
Emerging Opportunities in Blockchain in Manufacturing Industry
The Blockchain in Manufacturing Industry presents significant opportunities. Emerging markets in developing economies offer substantial growth potential. The integration of blockchain with other emerging technologies like IoT and AI will lead to the development of innovative solutions. The increased focus on sustainability in manufacturing presents opportunities for blockchain to track and verify the ethical sourcing of materials. Finally, expanding applications to other sectors within manufacturing represent significant future growth.
Leading Players in the Blockchain in Manufacturing Industry Market
- Wipro Limited
- Accenture PLC
- IBM Corporation
- Factom Inc
- Microsoft Corporation
- Advanced Micro Devices Inc
- Amazon Web Services Inc
- Oracle Corporation
- Infosys Ltd
- SAP SE
- Intel Corporation
Key Developments in Blockchain in Manufacturing Industry Industry
June 2022: Shell, Accenture, and American Express Global Business Travel launched Avelia, a blockchain-based platform for sustainable aviation fuel (SAF), demonstrating the application of blockchain in promoting sustainability within the travel and fuel industries.
April 2022: Intel Corporation launched the Intel Blockscale ASIC, an application-specific integrated circuit designed to enhance the efficiency and scalability of blockchain technologies, particularly in cryptocurrency mining, addressing sustainability concerns within the sector.
Future Outlook for Blockchain in Manufacturing Industry Market
The future of the Blockchain in Manufacturing Industry is promising. Continued technological advancements, increasing regulatory clarity, and rising consumer demand for transparent and traceable products will drive market expansion. The integration of blockchain with other emerging technologies will create new opportunities and enhance the value proposition for manufacturers. The market is poised for substantial growth, with various sectors expected to adopt blockchain solutions in the coming years.
Blockchain in Manufacturing Industry Segmentation
-
1. Application
- 1.1. Logistics and Supply Chain Management
- 1.2. Counterfeit Management
- 1.3. Quality Control and Compliance
- 1.4. Other Applications
-
2. End-user Vertical
- 2.1. Automotive
- 2.2. Aerospace and Defense
- 2.3. Pharmaceutical
- 2.4. Consumer Electronics
- 2.5. Other End-user Verticals
Blockchain in Manufacturing Industry Segmentation By Geography
- 1. North America
- 2. Europe
- 3. Asia Pacific
- 4. Rest of the World
Blockchain in Manufacturing Industry REPORT HIGHLIGHTS
| Aspects | Details |
|---|---|
| Study Period | 2019-2033 |
| Base Year | 2024 |
| Estimated Year | 2025 |
| Forecast Period | 2025-2033 |
| Historical Period | 2019-2024 |
| Growth Rate | CAGR of 76.26% from 2019-2033 |
| Segmentation |
|
Table of Contents
- 1. Introduction
- 1.1. Research Scope
- 1.2. Market Segmentation
- 1.3. Research Methodology
- 1.4. Definitions and Assumptions
- 2. Executive Summary
- 2.1. Introduction
- 3. Market Dynamics
- 3.1. Introduction
- 3.2. Market Drivers
- 3.2.1. Blockchain-as-a-Service Solutions for Enterprises; Simplifies Business Processes and Reduces Cost of Production
- 3.3. Market Restrains
- 3.3.1. Absence of Common Set of Standards and Regulatory Bodies
- 3.4. Market Trends
- 3.4.1. Automotive Vertical is to Witness the Significant Growth
- 4. Market Factor Analysis
- 4.1. Porters Five Forces
- 4.2. Supply/Value Chain
- 4.3. PESTEL analysis
- 4.4. Market Entropy
- 4.5. Patent/Trademark Analysis
- 5. Global Blockchain in Manufacturing Industry Analysis, Insights and Forecast, 2019-2031
- 5.1. Market Analysis, Insights and Forecast - by Application
- 5.1.1. Logistics and Supply Chain Management
- 5.1.2. Counterfeit Management
- 5.1.3. Quality Control and Compliance
- 5.1.4. Other Applications
- 5.2. Market Analysis, Insights and Forecast - by End-user Vertical
- 5.2.1. Automotive
- 5.2.2. Aerospace and Defense
- 5.2.3. Pharmaceutical
- 5.2.4. Consumer Electronics
- 5.2.5. Other End-user Verticals
- 5.3. Market Analysis, Insights and Forecast - by Region
- 5.3.1. North America
- 5.3.2. Europe
- 5.3.3. Asia Pacific
- 5.3.4. Rest of the World
- 5.1. Market Analysis, Insights and Forecast - by Application
- 6. North America Blockchain in Manufacturing Industry Analysis, Insights and Forecast, 2019-2031
- 6.1. Market Analysis, Insights and Forecast - by Application
- 6.1.1. Logistics and Supply Chain Management
- 6.1.2. Counterfeit Management
- 6.1.3. Quality Control and Compliance
- 6.1.4. Other Applications
- 6.2. Market Analysis, Insights and Forecast - by End-user Vertical
- 6.2.1. Automotive
- 6.2.2. Aerospace and Defense
- 6.2.3. Pharmaceutical
- 6.2.4. Consumer Electronics
- 6.2.5. Other End-user Verticals
- 6.1. Market Analysis, Insights and Forecast - by Application
- 7. Europe Blockchain in Manufacturing Industry Analysis, Insights and Forecast, 2019-2031
- 7.1. Market Analysis, Insights and Forecast - by Application
- 7.1.1. Logistics and Supply Chain Management
- 7.1.2. Counterfeit Management
- 7.1.3. Quality Control and Compliance
- 7.1.4. Other Applications
- 7.2. Market Analysis, Insights and Forecast - by End-user Vertical
- 7.2.1. Automotive
- 7.2.2. Aerospace and Defense
- 7.2.3. Pharmaceutical
- 7.2.4. Consumer Electronics
- 7.2.5. Other End-user Verticals
- 7.1. Market Analysis, Insights and Forecast - by Application
- 8. Asia Pacific Blockchain in Manufacturing Industry Analysis, Insights and Forecast, 2019-2031
- 8.1. Market Analysis, Insights and Forecast - by Application
- 8.1.1. Logistics and Supply Chain Management
- 8.1.2. Counterfeit Management
- 8.1.3. Quality Control and Compliance
- 8.1.4. Other Applications
- 8.2. Market Analysis, Insights and Forecast - by End-user Vertical
- 8.2.1. Automotive
- 8.2.2. Aerospace and Defense
- 8.2.3. Pharmaceutical
- 8.2.4. Consumer Electronics
- 8.2.5. Other End-user Verticals
- 8.1. Market Analysis, Insights and Forecast - by Application
- 9. Rest of the World Blockchain in Manufacturing Industry Analysis, Insights and Forecast, 2019-2031
- 9.1. Market Analysis, Insights and Forecast - by Application
- 9.1.1. Logistics and Supply Chain Management
- 9.1.2. Counterfeit Management
- 9.1.3. Quality Control and Compliance
- 9.1.4. Other Applications
- 9.2. Market Analysis, Insights and Forecast - by End-user Vertical
- 9.2.1. Automotive
- 9.2.2. Aerospace and Defense
- 9.2.3. Pharmaceutical
- 9.2.4. Consumer Electronics
- 9.2.5. Other End-user Verticals
- 9.1. Market Analysis, Insights and Forecast - by Application
- 10. North America Blockchain in Manufacturing Industry Analysis, Insights and Forecast, 2019-2031
- 10.1. Market Analysis, Insights and Forecast - By Country/Sub-region
- 10.1.1 United States
- 10.1.2 Canada
- 10.1.3 Mexico
- 11. Europe Blockchain in Manufacturing Industry Analysis, Insights and Forecast, 2019-2031
- 11.1. Market Analysis, Insights and Forecast - By Country/Sub-region
- 11.1.1 Germany
- 11.1.2 United Kingdom
- 11.1.3 France
- 11.1.4 Spain
- 11.1.5 Italy
- 11.1.6 Spain
- 11.1.7 Belgium
- 11.1.8 Netherland
- 11.1.9 Nordics
- 11.1.10 Rest of Europe
- 12. Asia Pacific Blockchain in Manufacturing Industry Analysis, Insights and Forecast, 2019-2031
- 12.1. Market Analysis, Insights and Forecast - By Country/Sub-region
- 12.1.1 China
- 12.1.2 Japan
- 12.1.3 India
- 12.1.4 South Korea
- 12.1.5 Southeast Asia
- 12.1.6 Australia
- 12.1.7 Indonesia
- 12.1.8 Phillipes
- 12.1.9 Singapore
- 12.1.10 Thailandc
- 12.1.11 Rest of Asia Pacific
- 13. South America Blockchain in Manufacturing Industry Analysis, Insights and Forecast, 2019-2031
- 13.1. Market Analysis, Insights and Forecast - By Country/Sub-region
- 13.1.1 Brazil
- 13.1.2 Argentina
- 13.1.3 Peru
- 13.1.4 Chile
- 13.1.5 Colombia
- 13.1.6 Ecuador
- 13.1.7 Venezuela
- 13.1.8 Rest of South America
- 14. North America Blockchain in Manufacturing Industry Analysis, Insights and Forecast, 2019-2031
- 14.1. Market Analysis, Insights and Forecast - By Country/Sub-region
- 14.1.1 United States
- 14.1.2 Canada
- 14.1.3 Mexico
- 15. MEA Blockchain in Manufacturing Industry Analysis, Insights and Forecast, 2019-2031
- 15.1. Market Analysis, Insights and Forecast - By Country/Sub-region
- 15.1.1 United Arab Emirates
- 15.1.2 Saudi Arabia
- 15.1.3 South Africa
- 15.1.4 Rest of Middle East and Africa
- 16. Competitive Analysis
- 16.1. Global Market Share Analysis 2024
- 16.2. Company Profiles
- 16.2.1 Wipro Limited
- 16.2.1.1. Overview
- 16.2.1.2. Products
- 16.2.1.3. SWOT Analysis
- 16.2.1.4. Recent Developments
- 16.2.1.5. Financials (Based on Availability)
- 16.2.2 Accenture PLC
- 16.2.2.1. Overview
- 16.2.2.2. Products
- 16.2.2.3. SWOT Analysis
- 16.2.2.4. Recent Developments
- 16.2.2.5. Financials (Based on Availability)
- 16.2.3 IBM Corporation
- 16.2.3.1. Overview
- 16.2.3.2. Products
- 16.2.3.3. SWOT Analysis
- 16.2.3.4. Recent Developments
- 16.2.3.5. Financials (Based on Availability)
- 16.2.4 Factom Inc
- 16.2.4.1. Overview
- 16.2.4.2. Products
- 16.2.4.3. SWOT Analysis
- 16.2.4.4. Recent Developments
- 16.2.4.5. Financials (Based on Availability)
- 16.2.5 Microsoft Corporation
- 16.2.5.1. Overview
- 16.2.5.2. Products
- 16.2.5.3. SWOT Analysis
- 16.2.5.4. Recent Developments
- 16.2.5.5. Financials (Based on Availability)
- 16.2.6 Advanced Micro Devices Inc
- 16.2.6.1. Overview
- 16.2.6.2. Products
- 16.2.6.3. SWOT Analysis
- 16.2.6.4. Recent Developments
- 16.2.6.5. Financials (Based on Availability)
- 16.2.7 Amazon Web Services Inc
- 16.2.7.1. Overview
- 16.2.7.2. Products
- 16.2.7.3. SWOT Analysis
- 16.2.7.4. Recent Developments
- 16.2.7.5. Financials (Based on Availability)
- 16.2.8 Oracle Corporation
- 16.2.8.1. Overview
- 16.2.8.2. Products
- 16.2.8.3. SWOT Analysis
- 16.2.8.4. Recent Developments
- 16.2.8.5. Financials (Based on Availability)
- 16.2.9 Infosys Ltd*List Not Exhaustive
- 16.2.9.1. Overview
- 16.2.9.2. Products
- 16.2.9.3. SWOT Analysis
- 16.2.9.4. Recent Developments
- 16.2.9.5. Financials (Based on Availability)
- 16.2.10 SAP SE
- 16.2.10.1. Overview
- 16.2.10.2. Products
- 16.2.10.3. SWOT Analysis
- 16.2.10.4. Recent Developments
- 16.2.10.5. Financials (Based on Availability)
- 16.2.11 Intel Corporation
- 16.2.11.1. Overview
- 16.2.11.2. Products
- 16.2.11.3. SWOT Analysis
- 16.2.11.4. Recent Developments
- 16.2.11.5. Financials (Based on Availability)
- 16.2.1 Wipro Limited
List of Figures
- Figure 1: Global Blockchain in Manufacturing Industry Revenue Breakdown (Million, %) by Region 2024 & 2032
- Figure 2: North America Blockchain in Manufacturing Industry Revenue (Million), by Country 2024 & 2032
- Figure 3: North America Blockchain in Manufacturing Industry Revenue Share (%), by Country 2024 & 2032
- Figure 4: Europe Blockchain in Manufacturing Industry Revenue (Million), by Country 2024 & 2032
- Figure 5: Europe Blockchain in Manufacturing Industry Revenue Share (%), by Country 2024 & 2032
- Figure 6: Asia Pacific Blockchain in Manufacturing Industry Revenue (Million), by Country 2024 & 2032
- Figure 7: Asia Pacific Blockchain in Manufacturing Industry Revenue Share (%), by Country 2024 & 2032
- Figure 8: South America Blockchain in Manufacturing Industry Revenue (Million), by Country 2024 & 2032
- Figure 9: South America Blockchain in Manufacturing Industry Revenue Share (%), by Country 2024 & 2032
- Figure 10: North America Blockchain in Manufacturing Industry Revenue (Million), by Country 2024 & 2032
- Figure 11: North America Blockchain in Manufacturing Industry Revenue Share (%), by Country 2024 & 2032
- Figure 12: MEA Blockchain in Manufacturing Industry Revenue (Million), by Country 2024 & 2032
- Figure 13: MEA Blockchain in Manufacturing Industry Revenue Share (%), by Country 2024 & 2032
- Figure 14: North America Blockchain in Manufacturing Industry Revenue (Million), by Application 2024 & 2032
- Figure 15: North America Blockchain in Manufacturing Industry Revenue Share (%), by Application 2024 & 2032
- Figure 16: North America Blockchain in Manufacturing Industry Revenue (Million), by End-user Vertical 2024 & 2032
- Figure 17: North America Blockchain in Manufacturing Industry Revenue Share (%), by End-user Vertical 2024 & 2032
- Figure 18: North America Blockchain in Manufacturing Industry Revenue (Million), by Country 2024 & 2032
- Figure 19: North America Blockchain in Manufacturing Industry Revenue Share (%), by Country 2024 & 2032
- Figure 20: Europe Blockchain in Manufacturing Industry Revenue (Million), by Application 2024 & 2032
- Figure 21: Europe Blockchain in Manufacturing Industry Revenue Share (%), by Application 2024 & 2032
- Figure 22: Europe Blockchain in Manufacturing Industry Revenue (Million), by End-user Vertical 2024 & 2032
- Figure 23: Europe Blockchain in Manufacturing Industry Revenue Share (%), by End-user Vertical 2024 & 2032
- Figure 24: Europe Blockchain in Manufacturing Industry Revenue (Million), by Country 2024 & 2032
- Figure 25: Europe Blockchain in Manufacturing Industry Revenue Share (%), by Country 2024 & 2032
- Figure 26: Asia Pacific Blockchain in Manufacturing Industry Revenue (Million), by Application 2024 & 2032
- Figure 27: Asia Pacific Blockchain in Manufacturing Industry Revenue Share (%), by Application 2024 & 2032
- Figure 28: Asia Pacific Blockchain in Manufacturing Industry Revenue (Million), by End-user Vertical 2024 & 2032
- Figure 29: Asia Pacific Blockchain in Manufacturing Industry Revenue Share (%), by End-user Vertical 2024 & 2032
- Figure 30: Asia Pacific Blockchain in Manufacturing Industry Revenue (Million), by Country 2024 & 2032
- Figure 31: Asia Pacific Blockchain in Manufacturing Industry Revenue Share (%), by Country 2024 & 2032
- Figure 32: Rest of the World Blockchain in Manufacturing Industry Revenue (Million), by Application 2024 & 2032
- Figure 33: Rest of the World Blockchain in Manufacturing Industry Revenue Share (%), by Application 2024 & 2032
- Figure 34: Rest of the World Blockchain in Manufacturing Industry Revenue (Million), by End-user Vertical 2024 & 2032
- Figure 35: Rest of the World Blockchain in Manufacturing Industry Revenue Share (%), by End-user Vertical 2024 & 2032
- Figure 36: Rest of the World Blockchain in Manufacturing Industry Revenue (Million), by Country 2024 & 2032
- Figure 37: Rest of the World Blockchain in Manufacturing Industry Revenue Share (%), by Country 2024 & 2032
List of Tables
- Table 1: Global Blockchain in Manufacturing Industry Revenue Million Forecast, by Region 2019 & 2032
- Table 2: Global Blockchain in Manufacturing Industry Revenue Million Forecast, by Application 2019 & 2032
- Table 3: Global Blockchain in Manufacturing Industry Revenue Million Forecast, by End-user Vertical 2019 & 2032
- Table 4: Global Blockchain in Manufacturing Industry Revenue Million Forecast, by Region 2019 & 2032
- Table 5: Global Blockchain in Manufacturing Industry Revenue Million Forecast, by Country 2019 & 2032
- Table 6: United States Blockchain in Manufacturing Industry Revenue (Million) Forecast, by Application 2019 & 2032
- Table 7: Canada Blockchain in Manufacturing Industry Revenue (Million) Forecast, by Application 2019 & 2032
- Table 8: Mexico Blockchain in Manufacturing Industry Revenue (Million) Forecast, by Application 2019 & 2032
- Table 9: Global Blockchain in Manufacturing Industry Revenue Million Forecast, by Country 2019 & 2032
- Table 10: Germany Blockchain in Manufacturing Industry Revenue (Million) Forecast, by Application 2019 & 2032
- Table 11: United Kingdom Blockchain in Manufacturing Industry Revenue (Million) Forecast, by Application 2019 & 2032
- Table 12: France Blockchain in Manufacturing Industry Revenue (Million) Forecast, by Application 2019 & 2032
- Table 13: Spain Blockchain in Manufacturing Industry Revenue (Million) Forecast, by Application 2019 & 2032
- Table 14: Italy Blockchain in Manufacturing Industry Revenue (Million) Forecast, by Application 2019 & 2032
- Table 15: Spain Blockchain in Manufacturing Industry Revenue (Million) Forecast, by Application 2019 & 2032
- Table 16: Belgium Blockchain in Manufacturing Industry Revenue (Million) Forecast, by Application 2019 & 2032
- Table 17: Netherland Blockchain in Manufacturing Industry Revenue (Million) Forecast, by Application 2019 & 2032
- Table 18: Nordics Blockchain in Manufacturing Industry Revenue (Million) Forecast, by Application 2019 & 2032
- Table 19: Rest of Europe Blockchain in Manufacturing Industry Revenue (Million) Forecast, by Application 2019 & 2032
- Table 20: Global Blockchain in Manufacturing Industry Revenue Million Forecast, by Country 2019 & 2032
- Table 21: China Blockchain in Manufacturing Industry Revenue (Million) Forecast, by Application 2019 & 2032
- Table 22: Japan Blockchain in Manufacturing Industry Revenue (Million) Forecast, by Application 2019 & 2032
- Table 23: India Blockchain in Manufacturing Industry Revenue (Million) Forecast, by Application 2019 & 2032
- Table 24: South Korea Blockchain in Manufacturing Industry Revenue (Million) Forecast, by Application 2019 & 2032
- Table 25: Southeast Asia Blockchain in Manufacturing Industry Revenue (Million) Forecast, by Application 2019 & 2032
- Table 26: Australia Blockchain in Manufacturing Industry Revenue (Million) Forecast, by Application 2019 & 2032
- Table 27: Indonesia Blockchain in Manufacturing Industry Revenue (Million) Forecast, by Application 2019 & 2032
- Table 28: Phillipes Blockchain in Manufacturing Industry Revenue (Million) Forecast, by Application 2019 & 2032
- Table 29: Singapore Blockchain in Manufacturing Industry Revenue (Million) Forecast, by Application 2019 & 2032
- Table 30: Thailandc Blockchain in Manufacturing Industry Revenue (Million) Forecast, by Application 2019 & 2032
- Table 31: Rest of Asia Pacific Blockchain in Manufacturing Industry Revenue (Million) Forecast, by Application 2019 & 2032
- Table 32: Global Blockchain in Manufacturing Industry Revenue Million Forecast, by Country 2019 & 2032
- Table 33: Brazil Blockchain in Manufacturing Industry Revenue (Million) Forecast, by Application 2019 & 2032
- Table 34: Argentina Blockchain in Manufacturing Industry Revenue (Million) Forecast, by Application 2019 & 2032
- Table 35: Peru Blockchain in Manufacturing Industry Revenue (Million) Forecast, by Application 2019 & 2032
- Table 36: Chile Blockchain in Manufacturing Industry Revenue (Million) Forecast, by Application 2019 & 2032
- Table 37: Colombia Blockchain in Manufacturing Industry Revenue (Million) Forecast, by Application 2019 & 2032
- Table 38: Ecuador Blockchain in Manufacturing Industry Revenue (Million) Forecast, by Application 2019 & 2032
- Table 39: Venezuela Blockchain in Manufacturing Industry Revenue (Million) Forecast, by Application 2019 & 2032
- Table 40: Rest of South America Blockchain in Manufacturing Industry Revenue (Million) Forecast, by Application 2019 & 2032
- Table 41: Global Blockchain in Manufacturing Industry Revenue Million Forecast, by Country 2019 & 2032
- Table 42: United States Blockchain in Manufacturing Industry Revenue (Million) Forecast, by Application 2019 & 2032
- Table 43: Canada Blockchain in Manufacturing Industry Revenue (Million) Forecast, by Application 2019 & 2032
- Table 44: Mexico Blockchain in Manufacturing Industry Revenue (Million) Forecast, by Application 2019 & 2032
- Table 45: Global Blockchain in Manufacturing Industry Revenue Million Forecast, by Country 2019 & 2032
- Table 46: United Arab Emirates Blockchain in Manufacturing Industry Revenue (Million) Forecast, by Application 2019 & 2032
- Table 47: Saudi Arabia Blockchain in Manufacturing Industry Revenue (Million) Forecast, by Application 2019 & 2032
- Table 48: South Africa Blockchain in Manufacturing Industry Revenue (Million) Forecast, by Application 2019 & 2032
- Table 49: Rest of Middle East and Africa Blockchain in Manufacturing Industry Revenue (Million) Forecast, by Application 2019 & 2032
- Table 50: Global Blockchain in Manufacturing Industry Revenue Million Forecast, by Application 2019 & 2032
- Table 51: Global Blockchain in Manufacturing Industry Revenue Million Forecast, by End-user Vertical 2019 & 2032
- Table 52: Global Blockchain in Manufacturing Industry Revenue Million Forecast, by Country 2019 & 2032
- Table 53: Global Blockchain in Manufacturing Industry Revenue Million Forecast, by Application 2019 & 2032
- Table 54: Global Blockchain in Manufacturing Industry Revenue Million Forecast, by End-user Vertical 2019 & 2032
- Table 55: Global Blockchain in Manufacturing Industry Revenue Million Forecast, by Country 2019 & 2032
- Table 56: Global Blockchain in Manufacturing Industry Revenue Million Forecast, by Application 2019 & 2032
- Table 57: Global Blockchain in Manufacturing Industry Revenue Million Forecast, by End-user Vertical 2019 & 2032
- Table 58: Global Blockchain in Manufacturing Industry Revenue Million Forecast, by Country 2019 & 2032
- Table 59: Global Blockchain in Manufacturing Industry Revenue Million Forecast, by Application 2019 & 2032
- Table 60: Global Blockchain in Manufacturing Industry Revenue Million Forecast, by End-user Vertical 2019 & 2032
- Table 61: Global Blockchain in Manufacturing Industry Revenue Million Forecast, by Country 2019 & 2032
Frequently Asked Questions
1. What is the projected Compound Annual Growth Rate (CAGR) of the Blockchain in Manufacturing Industry?
The projected CAGR is approximately 76.26%.
2. Which companies are prominent players in the Blockchain in Manufacturing Industry?
Key companies in the market include Wipro Limited, Accenture PLC, IBM Corporation, Factom Inc, Microsoft Corporation, Advanced Micro Devices Inc, Amazon Web Services Inc, Oracle Corporation, Infosys Ltd*List Not Exhaustive, SAP SE, Intel Corporation.
3. What are the main segments of the Blockchain in Manufacturing Industry?
The market segments include Application, End-user Vertical.
4. Can you provide details about the market size?
The market size is estimated to be USD XX Million as of 2022.
5. What are some drivers contributing to market growth?
Blockchain-as-a-Service Solutions for Enterprises; Simplifies Business Processes and Reduces Cost of Production.
6. What are the notable trends driving market growth?
Automotive Vertical is to Witness the Significant Growth.
7. Are there any restraints impacting market growth?
Absence of Common Set of Standards and Regulatory Bodies.
8. Can you provide examples of recent developments in the market?
June 2022: Shell, Accenture, and American Express Global Business Travel collaborated to launch Avelia, one of the first digital book-and-claim services for sustainable aviation fuel (SAF) backed by blockchain for business travel. The program's pilot phase intends to show the validity of the book-and-claim concept by securing the distribution of SAF's environmental qualities to businesses and airlines after the fuel has been supplied into the fuel network using blockchain technology.
9. What pricing options are available for accessing the report?
Pricing options include single-user, multi-user, and enterprise licenses priced at USD 4750, USD 5250, and USD 8750 respectively.
10. Is the market size provided in terms of value or volume?
The market size is provided in terms of value, measured in Million.
11. Are there any specific market keywords associated with the report?
Yes, the market keyword associated with the report is "Blockchain in Manufacturing Industry," which aids in identifying and referencing the specific market segment covered.
12. How do I determine which pricing option suits my needs best?
The pricing options vary based on user requirements and access needs. Individual users may opt for single-user licenses, while businesses requiring broader access may choose multi-user or enterprise licenses for cost-effective access to the report.
13. Are there any additional resources or data provided in the Blockchain in Manufacturing Industry report?
While the report offers comprehensive insights, it's advisable to review the specific contents or supplementary materials provided to ascertain if additional resources or data are available.
14. How can I stay updated on further developments or reports in the Blockchain in Manufacturing Industry?
To stay informed about further developments, trends, and reports in the Blockchain in Manufacturing Industry, consider subscribing to industry newsletters, following relevant companies and organizations, or regularly checking reputable industry news sources and publications.
Methodology
Step 1 - Identification of Relevant Samples Size from Population Database


Step 2 - Approaches for Defining Global Market Size (Value, Volume* & Price*)

Note*: In applicable scenarios
Step 3 - Data Sources
Primary Research
- Web Analytics
- Survey Reports
- Research Institute
- Latest Research Reports
- Opinion Leaders
Secondary Research
- Annual Reports
- White Paper
- Latest Press Release
- Industry Association
- Paid Database
- Investor Presentations

Step 4 - Data Triangulation
Involves using different sources of information in order to increase the validity of a study
These sources are likely to be stakeholders in a program - participants, other researchers, program staff, other community members, and so on.
Then we put all data in single framework & apply various statistical tools to find out the dynamic on the market.
During the analysis stage, feedback from the stakeholder groups would be compared to determine areas of agreement as well as areas of divergence


