
Key Insights
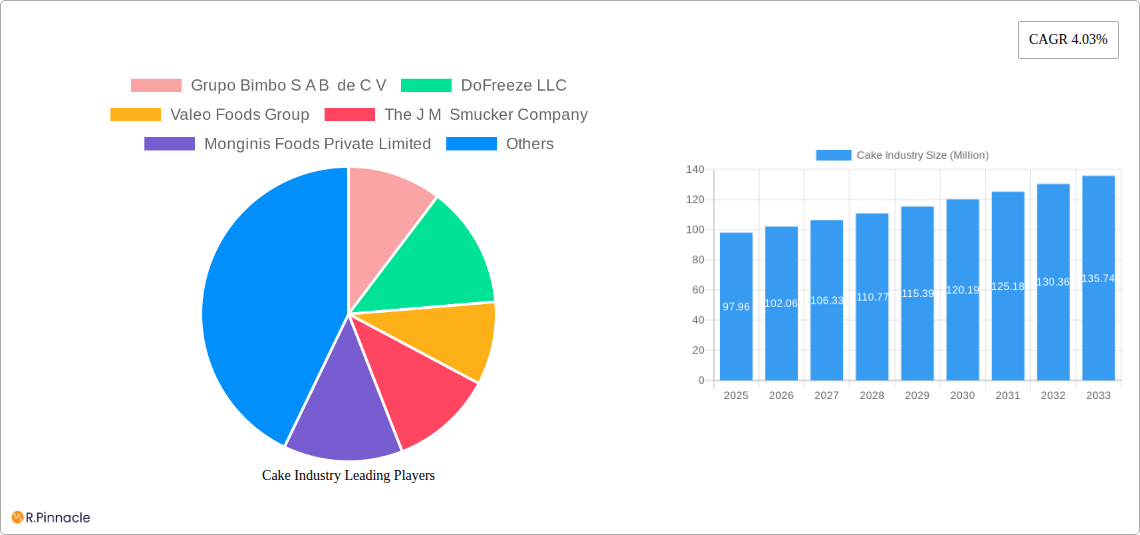
The global cake industry, valued at $97.96 billion in 2025, is projected to experience steady growth, driven by several key factors. Rising disposable incomes, particularly in developing economies, are fueling increased spending on premium and convenient food options, including cakes. The increasing popularity of online cake delivery services and the expanding presence of specialty cake stores cater to evolving consumer preferences for unique and personalized treats. Furthermore, the growing demand for healthier cake alternatives, using ingredients like whole grains and natural sweeteners, presents a significant opportunity for market expansion. Innovation in cake flavors, designs, and packaging also contributes to the industry's dynamism. However, challenges remain. Fluctuations in raw material prices, particularly sugar and dairy, can impact profitability. Additionally, intense competition among established players and emerging brands necessitates continuous product innovation and effective marketing strategies for sustained success. The packaged cake segment currently dominates, but the unpackaged/artisanal segment is experiencing robust growth, driven by a consumer preference for handcrafted and locally sourced products. Celebration cakes remain the largest product type, followed by cupcakes and sponge cakes. Supermarkets and hypermarkets are the primary distribution channels, although online retail stores are rapidly gaining market share. Key players like Grupo Bimbo, McKee Foods, and Britannia Industries are leveraging their established brand recognition and distribution networks to maintain market leadership, while smaller, specialized bakeries are capitalizing on the growing demand for artisanal and customized cakes.
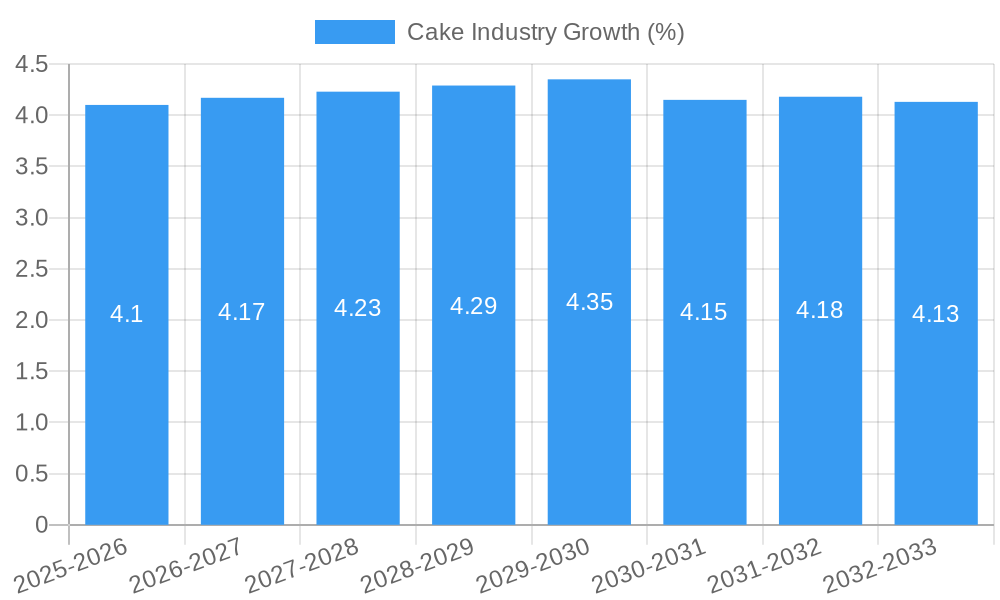
The forecast period (2025-2033) anticipates a continued upward trajectory for the cake industry, albeit at a moderate pace. The CAGR of 4.03% suggests consistent, albeit not explosive, growth. This growth is likely to be fueled by the aforementioned factors, including increased consumer spending, evolving tastes, and the continuous emergence of innovative product offerings. Regional variations will exist, with developed markets potentially exhibiting slower growth compared to emerging economies with higher growth potential. The industry's success will hinge on adapting to changing consumer preferences, embracing sustainable practices, and navigating the complexities of fluctuating ingredient costs and global economic conditions. Strategic partnerships, acquisitions, and product diversification will also be crucial for maintaining a competitive edge in this dynamic market.
Cake Industry Market Report: A Comprehensive Analysis (2019-2033)
This comprehensive report provides an in-depth analysis of the global cake industry, offering valuable insights for industry professionals, investors, and stakeholders. The report covers market size, segmentation, growth drivers, challenges, and future outlook, with a focus on key players and recent industry developments. The study period spans 2019-2033, with 2025 as the base and estimated year, and a forecast period of 2025-2033. The report's findings are based on extensive research and data analysis, providing a robust and reliable assessment of the current market landscape and its future trajectory. The global cake industry is projected to reach a valuation of $xx Million by 2033.
Cake Industry Market Structure & Innovation Trends
The global cake industry is characterized by a mix of large multinational corporations and smaller, regional players. Market concentration is moderate, with a few dominant players holding significant market share, while numerous smaller businesses cater to local and niche markets. Grupo Bimbo S A B de C V, Flowers Foods Inc, and Britannia Industries Limited are examples of major players commanding a combined market share of approximately xx%. However, smaller artisanal bakeries and local cake shops maintain a significant presence, particularly in the unpackaged/artisanal segment.
Key Market Dynamics:
- Market Concentration: Moderate, with significant presence of both large multinationals and smaller players.
- Innovation Drivers: Consumer demand for novel flavors, healthier options, and convenient packaging. Technological advancements in baking equipment and automation also drive innovation.
- Regulatory Frameworks: Food safety regulations, labeling requirements, and ingredient restrictions influence product development and market entry.
- Product Substitutes: Other desserts and snacks compete with cakes, impacting market growth.
- End-User Demographics: Growing demand from millennials and Gen Z, driven by increasing disposable incomes and preference for premium and indulgent products.
- M&A Activities: Consolidation in the industry through mergers and acquisitions is expected to continue, driven by economies of scale and market expansion strategies. Estimated M&A deal values over the past five years totaled approximately $xx Million.
Cake Industry Market Dynamics & Trends
The global cake industry is experiencing robust growth, driven by several key factors. The compound annual growth rate (CAGR) during the historical period (2019-2024) was estimated at xx%, and is projected to be xx% during the forecast period (2025-2033). Rising disposable incomes, particularly in developing economies, are a key factor, leading to increased spending on premium and indulgent food products. Changing consumer preferences, including the rise of online ordering and delivery services, are also shaping market dynamics. Technological disruptions, such as the adoption of automated baking equipment and innovative packaging solutions, are enhancing efficiency and product quality. However, competitive intensity is high, with companies continually striving for product differentiation and market share expansion. Market penetration in major markets like North America and Europe is already high, but significant growth potential remains in emerging economies.
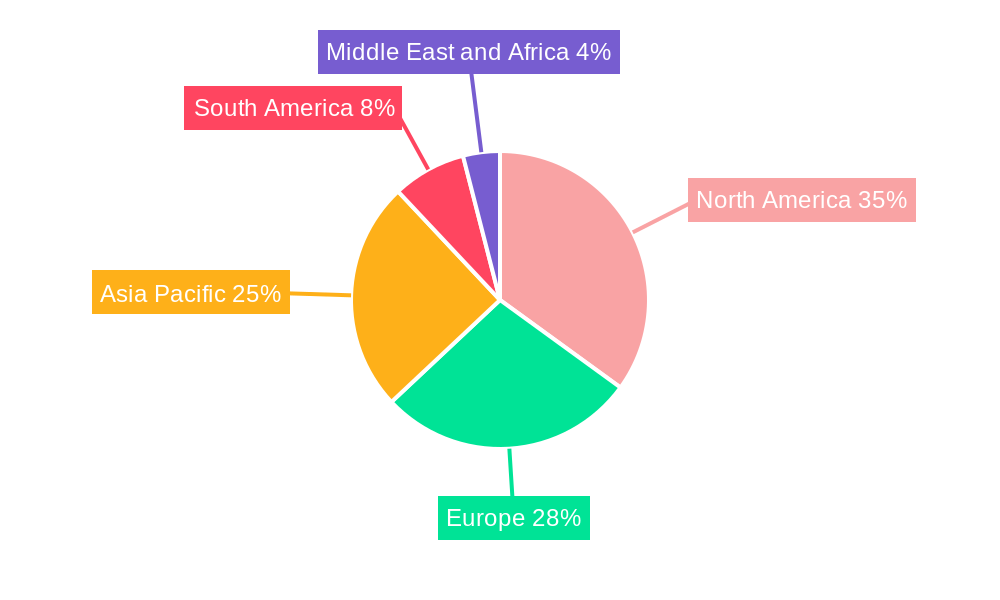
Dominant Regions & Segments in Cake Industry
The North American cake market holds the dominant position globally, primarily due to high consumption levels and the strong presence of established players. Within the segments:
- By Form: Packaged cakes dominate the market due to longer shelf life and ease of distribution. The unpackaged/artisanal segment exhibits slower growth but maintains a loyal customer base valuing freshness and customization.
- By Product Type: Celebration cakes continue to be a major driver of revenue, particularly during holidays and special occasions. Cupcakes and sponge cakes represent significant segments, appealing to diverse consumer preferences. Other cakes, such as cheesecakes and layer cakes, contribute to market diversity.
- By Distribution Channel: Supermarkets/hypermarkets are the primary distribution channel for packaged cakes, whereas online retail stores are rapidly gaining popularity, especially for artisanal and customized cakes. Convenience stores also contribute significantly, catering to impulse purchases.
Key Drivers of Regional Dominance:
- North America: High per capita consumption, established supply chains, and presence of large players.
- Europe: Strong demand for premium and specialized cakes, coupled with established baking traditions.
- Asia-Pacific: Rapidly expanding middle class and increasing disposable incomes fuel market growth.
Cake Industry Product Innovations
Recent innovations focus on healthier options (reduced sugar, whole grains), unique flavors, and convenient packaging. The use of technology, such as automated baking and 3D printing, has improved efficiency and allowed for complex cake designs. Manufacturers are focusing on sustainability by using eco-friendly packaging and sourcing sustainable ingredients. These innovations have enhanced the consumer experience and opened up new market segments.
Report Scope & Segmentation Analysis
The report segments the cake market by form (packaged, unpackaged/artisanal), product type (celebration cakes, cupcakes, sponge cakes, other cakes), and distribution channel (supermarkets/hypermarkets, specialty stores, convenience stores, online retail stores, other distribution channels). Each segment’s market size, growth projections, and competitive dynamics are analyzed extensively in the full report. The packaged segment is anticipated to maintain significant growth, while the unpackaged/artisanal segment will likely grow at a slightly lower but steady rate. Celebration cakes are projected to dominate by product type, with substantial contributions from other segments as well. Online retail stores are expected to experience the fastest growth among distribution channels.
Key Drivers of Cake Industry Growth
Several factors fuel the cake industry's growth. Increasing disposable incomes in emerging markets and a growing preference for convenient, premium desserts are key drivers. Technological advancements in baking equipment, automation, and packaging have improved efficiency and product quality. Favorable government policies supporting food processing industries also contribute to the expansion of the cake market. Furthermore, the rise of online retail channels has broadened the market reach, allowing wider access to various cake types.
Challenges in the Cake Industry Sector
The cake industry faces several challenges, including intense competition among established players and rising raw material costs. Stringent food safety regulations and fluctuations in ingredient prices can impact profitability. Supply chain disruptions and logistics hurdles can affect production efficiency and timely product delivery. Maintaining the freshness and quality of cakes, especially in the unpackaged/artisanal segment, is another challenge.
Emerging Opportunities in Cake Industry
Emerging opportunities include the expansion into new markets, such as developing economies with growing middle classes, and increased focus on healthier and customized cake options. The integration of technology into the industry continues to offer scope for innovation, particularly through automation and digital marketing. Developing sustainable and eco-friendly packaging solutions can significantly improve the industry's environmental footprint, presenting a distinct competitive advantage.
Leading Players in the Cake Industry Market
- Grupo Bimbo S A B de C V
- DoFreeze LLC
- Valeo Foods Group
- The J M Smucker Company
- Monginis Foods Private Limited
- Flowers Foods Inc
- Bonn Group of Industries
- Yıldız Holding
- McKee Foods Corporation
- Britannia Industries Limited
Key Developments in Cake Industry
- March 2024: Hostess brand launched Hostess Meltamors, a new mini-cake.
- March 2024: McKee Foods launched two new Valentine’s Day-themed Little Debbie products.
- March 2024: Monginis Foods Private Limited revamped its packaging.
Future Outlook for Cake Industry Market
The future of the cake industry looks promising, with continued growth driven by innovation, evolving consumer preferences, and expansion into new markets. Strategic partnerships, technological advancements, and a focus on sustainability will play a crucial role in shaping the industry's future trajectory. The market is expected to experience steady expansion, driven by both established and emerging players. Continued focus on customization, health consciousness, and convenient delivery options will be essential for maintaining competitiveness.
Cake Industry Segmentation
-
1. Form
- 1.1. Packaged
- 1.2. Unpackaged/Artisanal
-
2. Product Type
- 2.1. Celebration Cakes
-
2.2. Cupcakes
- 2.2.1. Center-filled
- 2.2.2. Plain
-
2.3. Sponge Cakes
- 2.3.1. Plain Cakes
- 2.3.2. Center-Filled Cakes
- 2.3.3. Others
- 2.4. Other Cakes
-
3. Distribution Channel
- 3.1. Supermarkets/Hypermarkets
- 3.2. Specialty Stores
- 3.3. Convenience Stores
- 3.4. Online Retail Stores
- 3.5. Other Distribution Channels
Cake Industry Segmentation By Geography
-
1. North America
- 1.1. United States
- 1.2. Canada
- 1.3. Mexico
- 1.4. Rest of North America
-
2. Europe
- 2.1. Germany
- 2.2. United Kingdom
- 2.3. France
- 2.4. Russia
- 2.5. Spain
- 2.6. Italy
- 2.7. Rest of Europe
-
3. Asia Pacific
- 3.1. China
- 3.2. Japan
- 3.3. India
- 3.4. Australia
- 3.5. Pakistan
- 3.6. Rest of Asia Pacific
-
4. South America
- 4.1. Brazil
- 4.2. Argentina
- 4.3. Rest of South America
-
5. Middle East and Africa
- 5.1. South Africa
- 5.2. Saudi Arabia
- 5.3. Rest of Middle East and Africa
Cake Industry REPORT HIGHLIGHTS
| Aspects | Details |
|---|---|
| Study Period | 2019-2033 |
| Base Year | 2024 |
| Estimated Year | 2025 |
| Forecast Period | 2025-2033 |
| Historical Period | 2019-2024 |
| Growth Rate | CAGR of 4.03% from 2019-2033 |
| Segmentation |
|
Table of Contents
- 1. Introduction
- 1.1. Research Scope
- 1.2. Market Segmentation
- 1.3. Research Methodology
- 1.4. Definitions and Assumptions
- 2. Executive Summary
- 2.1. Introduction
- 3. Market Dynamics
- 3.1. Introduction
- 3.2. Market Drivers
- 3.2.1. Increase in Number Of Social Event Celebration; Innovations In Designs And Flavors
- 3.3. Market Restrains
- 3.3.1. Health Concerns Related To Ingredients
- 3.4. Market Trends
- 3.4.1. Increase in Number Of Social Event Celebration
- 4. Market Factor Analysis
- 4.1. Porters Five Forces
- 4.2. Supply/Value Chain
- 4.3. PESTEL analysis
- 4.4. Market Entropy
- 4.5. Patent/Trademark Analysis
- 5. Global Cake Industry Analysis, Insights and Forecast, 2019-2031
- 5.1. Market Analysis, Insights and Forecast - by Form
- 5.1.1. Packaged
- 5.1.2. Unpackaged/Artisanal
- 5.2. Market Analysis, Insights and Forecast - by Product Type
- 5.2.1. Celebration Cakes
- 5.2.2. Cupcakes
- 5.2.2.1. Center-filled
- 5.2.2.2. Plain
- 5.2.3. Sponge Cakes
- 5.2.3.1. Plain Cakes
- 5.2.3.2. Center-Filled Cakes
- 5.2.3.3. Others
- 5.2.4. Other Cakes
- 5.3. Market Analysis, Insights and Forecast - by Distribution Channel
- 5.3.1. Supermarkets/Hypermarkets
- 5.3.2. Specialty Stores
- 5.3.3. Convenience Stores
- 5.3.4. Online Retail Stores
- 5.3.5. Other Distribution Channels
- 5.4. Market Analysis, Insights and Forecast - by Region
- 5.4.1. North America
- 5.4.2. Europe
- 5.4.3. Asia Pacific
- 5.4.4. South America
- 5.4.5. Middle East and Africa
- 5.1. Market Analysis, Insights and Forecast - by Form
- 6. North America Cake Industry Analysis, Insights and Forecast, 2019-2031
- 6.1. Market Analysis, Insights and Forecast - by Form
- 6.1.1. Packaged
- 6.1.2. Unpackaged/Artisanal
- 6.2. Market Analysis, Insights and Forecast - by Product Type
- 6.2.1. Celebration Cakes
- 6.2.2. Cupcakes
- 6.2.2.1. Center-filled
- 6.2.2.2. Plain
- 6.2.3. Sponge Cakes
- 6.2.3.1. Plain Cakes
- 6.2.3.2. Center-Filled Cakes
- 6.2.3.3. Others
- 6.2.4. Other Cakes
- 6.3. Market Analysis, Insights and Forecast - by Distribution Channel
- 6.3.1. Supermarkets/Hypermarkets
- 6.3.2. Specialty Stores
- 6.3.3. Convenience Stores
- 6.3.4. Online Retail Stores
- 6.3.5. Other Distribution Channels
- 6.1. Market Analysis, Insights and Forecast - by Form
- 7. Europe Cake Industry Analysis, Insights and Forecast, 2019-2031
- 7.1. Market Analysis, Insights and Forecast - by Form
- 7.1.1. Packaged
- 7.1.2. Unpackaged/Artisanal
- 7.2. Market Analysis, Insights and Forecast - by Product Type
- 7.2.1. Celebration Cakes
- 7.2.2. Cupcakes
- 7.2.2.1. Center-filled
- 7.2.2.2. Plain
- 7.2.3. Sponge Cakes
- 7.2.3.1. Plain Cakes
- 7.2.3.2. Center-Filled Cakes
- 7.2.3.3. Others
- 7.2.4. Other Cakes
- 7.3. Market Analysis, Insights and Forecast - by Distribution Channel
- 7.3.1. Supermarkets/Hypermarkets
- 7.3.2. Specialty Stores
- 7.3.3. Convenience Stores
- 7.3.4. Online Retail Stores
- 7.3.5. Other Distribution Channels
- 7.1. Market Analysis, Insights and Forecast - by Form
- 8. Asia Pacific Cake Industry Analysis, Insights and Forecast, 2019-2031
- 8.1. Market Analysis, Insights and Forecast - by Form
- 8.1.1. Packaged
- 8.1.2. Unpackaged/Artisanal
- 8.2. Market Analysis, Insights and Forecast - by Product Type
- 8.2.1. Celebration Cakes
- 8.2.2. Cupcakes
- 8.2.2.1. Center-filled
- 8.2.2.2. Plain
- 8.2.3. Sponge Cakes
- 8.2.3.1. Plain Cakes
- 8.2.3.2. Center-Filled Cakes
- 8.2.3.3. Others
- 8.2.4. Other Cakes
- 8.3. Market Analysis, Insights and Forecast - by Distribution Channel
- 8.3.1. Supermarkets/Hypermarkets
- 8.3.2. Specialty Stores
- 8.3.3. Convenience Stores
- 8.3.4. Online Retail Stores
- 8.3.5. Other Distribution Channels
- 8.1. Market Analysis, Insights and Forecast - by Form
- 9. South America Cake Industry Analysis, Insights and Forecast, 2019-2031
- 9.1. Market Analysis, Insights and Forecast - by Form
- 9.1.1. Packaged
- 9.1.2. Unpackaged/Artisanal
- 9.2. Market Analysis, Insights and Forecast - by Product Type
- 9.2.1. Celebration Cakes
- 9.2.2. Cupcakes
- 9.2.2.1. Center-filled
- 9.2.2.2. Plain
- 9.2.3. Sponge Cakes
- 9.2.3.1. Plain Cakes
- 9.2.3.2. Center-Filled Cakes
- 9.2.3.3. Others
- 9.2.4. Other Cakes
- 9.3. Market Analysis, Insights and Forecast - by Distribution Channel
- 9.3.1. Supermarkets/Hypermarkets
- 9.3.2. Specialty Stores
- 9.3.3. Convenience Stores
- 9.3.4. Online Retail Stores
- 9.3.5. Other Distribution Channels
- 9.1. Market Analysis, Insights and Forecast - by Form
- 10. Middle East and Africa Cake Industry Analysis, Insights and Forecast, 2019-2031
- 10.1. Market Analysis, Insights and Forecast - by Form
- 10.1.1. Packaged
- 10.1.2. Unpackaged/Artisanal
- 10.2. Market Analysis, Insights and Forecast - by Product Type
- 10.2.1. Celebration Cakes
- 10.2.2. Cupcakes
- 10.2.2.1. Center-filled
- 10.2.2.2. Plain
- 10.2.3. Sponge Cakes
- 10.2.3.1. Plain Cakes
- 10.2.3.2. Center-Filled Cakes
- 10.2.3.3. Others
- 10.2.4. Other Cakes
- 10.3. Market Analysis, Insights and Forecast - by Distribution Channel
- 10.3.1. Supermarkets/Hypermarkets
- 10.3.2. Specialty Stores
- 10.3.3. Convenience Stores
- 10.3.4. Online Retail Stores
- 10.3.5. Other Distribution Channels
- 10.1. Market Analysis, Insights and Forecast - by Form
- 11. North America Cake Industry Analysis, Insights and Forecast, 2019-2031
- 11.1. Market Analysis, Insights and Forecast - By Country/Sub-region
- 11.1.1 United States
- 11.1.2 Canada
- 11.1.3 Mexico
- 11.1.4 Rest of North America
- 12. Europe Cake Industry Analysis, Insights and Forecast, 2019-2031
- 12.1. Market Analysis, Insights and Forecast - By Country/Sub-region
- 12.1.1 Germany
- 12.1.2 United Kingdom
- 12.1.3 France
- 12.1.4 Russia
- 12.1.5 Spain
- 12.1.6 Italy
- 12.1.7 Rest of Europe
- 13. Asia Pacific Cake Industry Analysis, Insights and Forecast, 2019-2031
- 13.1. Market Analysis, Insights and Forecast - By Country/Sub-region
- 13.1.1 China
- 13.1.2 Japan
- 13.1.3 India
- 13.1.4 Australia
- 13.1.5 Pakistan
- 13.1.6 Rest of Asia Pacific
- 14. South America Cake Industry Analysis, Insights and Forecast, 2019-2031
- 14.1. Market Analysis, Insights and Forecast - By Country/Sub-region
- 14.1.1 Brazil
- 14.1.2 Argentina
- 14.1.3 Rest of South America
- 15. Middle East and Africa Cake Industry Analysis, Insights and Forecast, 2019-2031
- 15.1. Market Analysis, Insights and Forecast - By Country/Sub-region
- 15.1.1 South Africa
- 15.1.2 Saudi Arabia
- 15.1.3 Rest of Middle East and Africa
- 16. Competitive Analysis
- 16.1. Global Market Share Analysis 2024
- 16.2. Company Profiles
- 16.2.1 Grupo Bimbo S A B de C V
- 16.2.1.1. Overview
- 16.2.1.2. Products
- 16.2.1.3. SWOT Analysis
- 16.2.1.4. Recent Developments
- 16.2.1.5. Financials (Based on Availability)
- 16.2.2 DoFreeze LLC
- 16.2.2.1. Overview
- 16.2.2.2. Products
- 16.2.2.3. SWOT Analysis
- 16.2.2.4. Recent Developments
- 16.2.2.5. Financials (Based on Availability)
- 16.2.3 Valeo Foods Group
- 16.2.3.1. Overview
- 16.2.3.2. Products
- 16.2.3.3. SWOT Analysis
- 16.2.3.4. Recent Developments
- 16.2.3.5. Financials (Based on Availability)
- 16.2.4 The J M Smucker Company
- 16.2.4.1. Overview
- 16.2.4.2. Products
- 16.2.4.3. SWOT Analysis
- 16.2.4.4. Recent Developments
- 16.2.4.5. Financials (Based on Availability)
- 16.2.5 Monginis Foods Private Limited
- 16.2.5.1. Overview
- 16.2.5.2. Products
- 16.2.5.3. SWOT Analysis
- 16.2.5.4. Recent Developments
- 16.2.5.5. Financials (Based on Availability)
- 16.2.6 Flowers Foods Inc
- 16.2.6.1. Overview
- 16.2.6.2. Products
- 16.2.6.3. SWOT Analysis
- 16.2.6.4. Recent Developments
- 16.2.6.5. Financials (Based on Availability)
- 16.2.7 Bonn Group of Industries
- 16.2.7.1. Overview
- 16.2.7.2. Products
- 16.2.7.3. SWOT Analysis
- 16.2.7.4. Recent Developments
- 16.2.7.5. Financials (Based on Availability)
- 16.2.8 Yıldız Holding *List Not Exhaustive
- 16.2.8.1. Overview
- 16.2.8.2. Products
- 16.2.8.3. SWOT Analysis
- 16.2.8.4. Recent Developments
- 16.2.8.5. Financials (Based on Availability)
- 16.2.9 McKee Foods Corporation
- 16.2.9.1. Overview
- 16.2.9.2. Products
- 16.2.9.3. SWOT Analysis
- 16.2.9.4. Recent Developments
- 16.2.9.5. Financials (Based on Availability)
- 16.2.10 Britannia Industries Limited
- 16.2.10.1. Overview
- 16.2.10.2. Products
- 16.2.10.3. SWOT Analysis
- 16.2.10.4. Recent Developments
- 16.2.10.5. Financials (Based on Availability)
- 16.2.1 Grupo Bimbo S A B de C V
List of Figures
- Figure 1: Global Cake Industry Revenue Breakdown (Million, %) by Region 2024 & 2032
- Figure 2: Global Cake Industry Volume Breakdown (k unit, %) by Region 2024 & 2032
- Figure 3: North America Cake Industry Revenue (Million), by Country 2024 & 2032
- Figure 4: North America Cake Industry Volume (k unit), by Country 2024 & 2032
- Figure 5: North America Cake Industry Revenue Share (%), by Country 2024 & 2032
- Figure 6: North America Cake Industry Volume Share (%), by Country 2024 & 2032
- Figure 7: Europe Cake Industry Revenue (Million), by Country 2024 & 2032
- Figure 8: Europe Cake Industry Volume (k unit), by Country 2024 & 2032
- Figure 9: Europe Cake Industry Revenue Share (%), by Country 2024 & 2032
- Figure 10: Europe Cake Industry Volume Share (%), by Country 2024 & 2032
- Figure 11: Asia Pacific Cake Industry Revenue (Million), by Country 2024 & 2032
- Figure 12: Asia Pacific Cake Industry Volume (k unit), by Country 2024 & 2032
- Figure 13: Asia Pacific Cake Industry Revenue Share (%), by Country 2024 & 2032
- Figure 14: Asia Pacific Cake Industry Volume Share (%), by Country 2024 & 2032
- Figure 15: South America Cake Industry Revenue (Million), by Country 2024 & 2032
- Figure 16: South America Cake Industry Volume (k unit), by Country 2024 & 2032
- Figure 17: South America Cake Industry Revenue Share (%), by Country 2024 & 2032
- Figure 18: South America Cake Industry Volume Share (%), by Country 2024 & 2032
- Figure 19: Middle East and Africa Cake Industry Revenue (Million), by Country 2024 & 2032
- Figure 20: Middle East and Africa Cake Industry Volume (k unit), by Country 2024 & 2032
- Figure 21: Middle East and Africa Cake Industry Revenue Share (%), by Country 2024 & 2032
- Figure 22: Middle East and Africa Cake Industry Volume Share (%), by Country 2024 & 2032
- Figure 23: North America Cake Industry Revenue (Million), by Form 2024 & 2032
- Figure 24: North America Cake Industry Volume (k unit), by Form 2024 & 2032
- Figure 25: North America Cake Industry Revenue Share (%), by Form 2024 & 2032
- Figure 26: North America Cake Industry Volume Share (%), by Form 2024 & 2032
- Figure 27: North America Cake Industry Revenue (Million), by Product Type 2024 & 2032
- Figure 28: North America Cake Industry Volume (k unit), by Product Type 2024 & 2032
- Figure 29: North America Cake Industry Revenue Share (%), by Product Type 2024 & 2032
- Figure 30: North America Cake Industry Volume Share (%), by Product Type 2024 & 2032
- Figure 31: North America Cake Industry Revenue (Million), by Distribution Channel 2024 & 2032
- Figure 32: North America Cake Industry Volume (k unit), by Distribution Channel 2024 & 2032
- Figure 33: North America Cake Industry Revenue Share (%), by Distribution Channel 2024 & 2032
- Figure 34: North America Cake Industry Volume Share (%), by Distribution Channel 2024 & 2032
- Figure 35: North America Cake Industry Revenue (Million), by Country 2024 & 2032
- Figure 36: North America Cake Industry Volume (k unit), by Country 2024 & 2032
- Figure 37: North America Cake Industry Revenue Share (%), by Country 2024 & 2032
- Figure 38: North America Cake Industry Volume Share (%), by Country 2024 & 2032
- Figure 39: Europe Cake Industry Revenue (Million), by Form 2024 & 2032
- Figure 40: Europe Cake Industry Volume (k unit), by Form 2024 & 2032
- Figure 41: Europe Cake Industry Revenue Share (%), by Form 2024 & 2032
- Figure 42: Europe Cake Industry Volume Share (%), by Form 2024 & 2032
- Figure 43: Europe Cake Industry Revenue (Million), by Product Type 2024 & 2032
- Figure 44: Europe Cake Industry Volume (k unit), by Product Type 2024 & 2032
- Figure 45: Europe Cake Industry Revenue Share (%), by Product Type 2024 & 2032
- Figure 46: Europe Cake Industry Volume Share (%), by Product Type 2024 & 2032
- Figure 47: Europe Cake Industry Revenue (Million), by Distribution Channel 2024 & 2032
- Figure 48: Europe Cake Industry Volume (k unit), by Distribution Channel 2024 & 2032
- Figure 49: Europe Cake Industry Revenue Share (%), by Distribution Channel 2024 & 2032
- Figure 50: Europe Cake Industry Volume Share (%), by Distribution Channel 2024 & 2032
- Figure 51: Europe Cake Industry Revenue (Million), by Country 2024 & 2032
- Figure 52: Europe Cake Industry Volume (k unit), by Country 2024 & 2032
- Figure 53: Europe Cake Industry Revenue Share (%), by Country 2024 & 2032
- Figure 54: Europe Cake Industry Volume Share (%), by Country 2024 & 2032
- Figure 55: Asia Pacific Cake Industry Revenue (Million), by Form 2024 & 2032
- Figure 56: Asia Pacific Cake Industry Volume (k unit), by Form 2024 & 2032
- Figure 57: Asia Pacific Cake Industry Revenue Share (%), by Form 2024 & 2032
- Figure 58: Asia Pacific Cake Industry Volume Share (%), by Form 2024 & 2032
- Figure 59: Asia Pacific Cake Industry Revenue (Million), by Product Type 2024 & 2032
- Figure 60: Asia Pacific Cake Industry Volume (k unit), by Product Type 2024 & 2032
- Figure 61: Asia Pacific Cake Industry Revenue Share (%), by Product Type 2024 & 2032
- Figure 62: Asia Pacific Cake Industry Volume Share (%), by Product Type 2024 & 2032
- Figure 63: Asia Pacific Cake Industry Revenue (Million), by Distribution Channel 2024 & 2032
- Figure 64: Asia Pacific Cake Industry Volume (k unit), by Distribution Channel 2024 & 2032
- Figure 65: Asia Pacific Cake Industry Revenue Share (%), by Distribution Channel 2024 & 2032
- Figure 66: Asia Pacific Cake Industry Volume Share (%), by Distribution Channel 2024 & 2032
- Figure 67: Asia Pacific Cake Industry Revenue (Million), by Country 2024 & 2032
- Figure 68: Asia Pacific Cake Industry Volume (k unit), by Country 2024 & 2032
- Figure 69: Asia Pacific Cake Industry Revenue Share (%), by Country 2024 & 2032
- Figure 70: Asia Pacific Cake Industry Volume Share (%), by Country 2024 & 2032
- Figure 71: South America Cake Industry Revenue (Million), by Form 2024 & 2032
- Figure 72: South America Cake Industry Volume (k unit), by Form 2024 & 2032
- Figure 73: South America Cake Industry Revenue Share (%), by Form 2024 & 2032
- Figure 74: South America Cake Industry Volume Share (%), by Form 2024 & 2032
- Figure 75: South America Cake Industry Revenue (Million), by Product Type 2024 & 2032
- Figure 76: South America Cake Industry Volume (k unit), by Product Type 2024 & 2032
- Figure 77: South America Cake Industry Revenue Share (%), by Product Type 2024 & 2032
- Figure 78: South America Cake Industry Volume Share (%), by Product Type 2024 & 2032
- Figure 79: South America Cake Industry Revenue (Million), by Distribution Channel 2024 & 2032
- Figure 80: South America Cake Industry Volume (k unit), by Distribution Channel 2024 & 2032
- Figure 81: South America Cake Industry Revenue Share (%), by Distribution Channel 2024 & 2032
- Figure 82: South America Cake Industry Volume Share (%), by Distribution Channel 2024 & 2032
- Figure 83: South America Cake Industry Revenue (Million), by Country 2024 & 2032
- Figure 84: South America Cake Industry Volume (k unit), by Country 2024 & 2032
- Figure 85: South America Cake Industry Revenue Share (%), by Country 2024 & 2032
- Figure 86: South America Cake Industry Volume Share (%), by Country 2024 & 2032
- Figure 87: Middle East and Africa Cake Industry Revenue (Million), by Form 2024 & 2032
- Figure 88: Middle East and Africa Cake Industry Volume (k unit), by Form 2024 & 2032
- Figure 89: Middle East and Africa Cake Industry Revenue Share (%), by Form 2024 & 2032
- Figure 90: Middle East and Africa Cake Industry Volume Share (%), by Form 2024 & 2032
- Figure 91: Middle East and Africa Cake Industry Revenue (Million), by Product Type 2024 & 2032
- Figure 92: Middle East and Africa Cake Industry Volume (k unit), by Product Type 2024 & 2032
- Figure 93: Middle East and Africa Cake Industry Revenue Share (%), by Product Type 2024 & 2032
- Figure 94: Middle East and Africa Cake Industry Volume Share (%), by Product Type 2024 & 2032
- Figure 95: Middle East and Africa Cake Industry Revenue (Million), by Distribution Channel 2024 & 2032
- Figure 96: Middle East and Africa Cake Industry Volume (k unit), by Distribution Channel 2024 & 2032
- Figure 97: Middle East and Africa Cake Industry Revenue Share (%), by Distribution Channel 2024 & 2032
- Figure 98: Middle East and Africa Cake Industry Volume Share (%), by Distribution Channel 2024 & 2032
- Figure 99: Middle East and Africa Cake Industry Revenue (Million), by Country 2024 & 2032
- Figure 100: Middle East and Africa Cake Industry Volume (k unit), by Country 2024 & 2032
- Figure 101: Middle East and Africa Cake Industry Revenue Share (%), by Country 2024 & 2032
- Figure 102: Middle East and Africa Cake Industry Volume Share (%), by Country 2024 & 2032
List of Tables
- Table 1: Global Cake Industry Revenue Million Forecast, by Region 2019 & 2032
- Table 2: Global Cake Industry Volume k unit Forecast, by Region 2019 & 2032
- Table 3: Global Cake Industry Revenue Million Forecast, by Form 2019 & 2032
- Table 4: Global Cake Industry Volume k unit Forecast, by Form 2019 & 2032
- Table 5: Global Cake Industry Revenue Million Forecast, by Product Type 2019 & 2032
- Table 6: Global Cake Industry Volume k unit Forecast, by Product Type 2019 & 2032
- Table 7: Global Cake Industry Revenue Million Forecast, by Distribution Channel 2019 & 2032
- Table 8: Global Cake Industry Volume k unit Forecast, by Distribution Channel 2019 & 2032
- Table 9: Global Cake Industry Revenue Million Forecast, by Region 2019 & 2032
- Table 10: Global Cake Industry Volume k unit Forecast, by Region 2019 & 2032
- Table 11: Global Cake Industry Revenue Million Forecast, by Country 2019 & 2032
- Table 12: Global Cake Industry Volume k unit Forecast, by Country 2019 & 2032
- Table 13: United States Cake Industry Revenue (Million) Forecast, by Application 2019 & 2032
- Table 14: United States Cake Industry Volume (k unit) Forecast, by Application 2019 & 2032
- Table 15: Canada Cake Industry Revenue (Million) Forecast, by Application 2019 & 2032
- Table 16: Canada Cake Industry Volume (k unit) Forecast, by Application 2019 & 2032
- Table 17: Mexico Cake Industry Revenue (Million) Forecast, by Application 2019 & 2032
- Table 18: Mexico Cake Industry Volume (k unit) Forecast, by Application 2019 & 2032
- Table 19: Rest of North America Cake Industry Revenue (Million) Forecast, by Application 2019 & 2032
- Table 20: Rest of North America Cake Industry Volume (k unit) Forecast, by Application 2019 & 2032
- Table 21: Global Cake Industry Revenue Million Forecast, by Country 2019 & 2032
- Table 22: Global Cake Industry Volume k unit Forecast, by Country 2019 & 2032
- Table 23: Germany Cake Industry Revenue (Million) Forecast, by Application 2019 & 2032
- Table 24: Germany Cake Industry Volume (k unit) Forecast, by Application 2019 & 2032
- Table 25: United Kingdom Cake Industry Revenue (Million) Forecast, by Application 2019 & 2032
- Table 26: United Kingdom Cake Industry Volume (k unit) Forecast, by Application 2019 & 2032
- Table 27: France Cake Industry Revenue (Million) Forecast, by Application 2019 & 2032
- Table 28: France Cake Industry Volume (k unit) Forecast, by Application 2019 & 2032
- Table 29: Russia Cake Industry Revenue (Million) Forecast, by Application 2019 & 2032
- Table 30: Russia Cake Industry Volume (k unit) Forecast, by Application 2019 & 2032
- Table 31: Spain Cake Industry Revenue (Million) Forecast, by Application 2019 & 2032
- Table 32: Spain Cake Industry Volume (k unit) Forecast, by Application 2019 & 2032
- Table 33: Italy Cake Industry Revenue (Million) Forecast, by Application 2019 & 2032
- Table 34: Italy Cake Industry Volume (k unit) Forecast, by Application 2019 & 2032
- Table 35: Rest of Europe Cake Industry Revenue (Million) Forecast, by Application 2019 & 2032
- Table 36: Rest of Europe Cake Industry Volume (k unit) Forecast, by Application 2019 & 2032
- Table 37: Global Cake Industry Revenue Million Forecast, by Country 2019 & 2032
- Table 38: Global Cake Industry Volume k unit Forecast, by Country 2019 & 2032
- Table 39: China Cake Industry Revenue (Million) Forecast, by Application 2019 & 2032
- Table 40: China Cake Industry Volume (k unit) Forecast, by Application 2019 & 2032
- Table 41: Japan Cake Industry Revenue (Million) Forecast, by Application 2019 & 2032
- Table 42: Japan Cake Industry Volume (k unit) Forecast, by Application 2019 & 2032
- Table 43: India Cake Industry Revenue (Million) Forecast, by Application 2019 & 2032
- Table 44: India Cake Industry Volume (k unit) Forecast, by Application 2019 & 2032
- Table 45: Australia Cake Industry Revenue (Million) Forecast, by Application 2019 & 2032
- Table 46: Australia Cake Industry Volume (k unit) Forecast, by Application 2019 & 2032
- Table 47: Pakistan Cake Industry Revenue (Million) Forecast, by Application 2019 & 2032
- Table 48: Pakistan Cake Industry Volume (k unit) Forecast, by Application 2019 & 2032
- Table 49: Rest of Asia Pacific Cake Industry Revenue (Million) Forecast, by Application 2019 & 2032
- Table 50: Rest of Asia Pacific Cake Industry Volume (k unit) Forecast, by Application 2019 & 2032
- Table 51: Global Cake Industry Revenue Million Forecast, by Country 2019 & 2032
- Table 52: Global Cake Industry Volume k unit Forecast, by Country 2019 & 2032
- Table 53: Brazil Cake Industry Revenue (Million) Forecast, by Application 2019 & 2032
- Table 54: Brazil Cake Industry Volume (k unit) Forecast, by Application 2019 & 2032
- Table 55: Argentina Cake Industry Revenue (Million) Forecast, by Application 2019 & 2032
- Table 56: Argentina Cake Industry Volume (k unit) Forecast, by Application 2019 & 2032
- Table 57: Rest of South America Cake Industry Revenue (Million) Forecast, by Application 2019 & 2032
- Table 58: Rest of South America Cake Industry Volume (k unit) Forecast, by Application 2019 & 2032
- Table 59: Global Cake Industry Revenue Million Forecast, by Country 2019 & 2032
- Table 60: Global Cake Industry Volume k unit Forecast, by Country 2019 & 2032
- Table 61: South Africa Cake Industry Revenue (Million) Forecast, by Application 2019 & 2032
- Table 62: South Africa Cake Industry Volume (k unit) Forecast, by Application 2019 & 2032
- Table 63: Saudi Arabia Cake Industry Revenue (Million) Forecast, by Application 2019 & 2032
- Table 64: Saudi Arabia Cake Industry Volume (k unit) Forecast, by Application 2019 & 2032
- Table 65: Rest of Middle East and Africa Cake Industry Revenue (Million) Forecast, by Application 2019 & 2032
- Table 66: Rest of Middle East and Africa Cake Industry Volume (k unit) Forecast, by Application 2019 & 2032
- Table 67: Global Cake Industry Revenue Million Forecast, by Form 2019 & 2032
- Table 68: Global Cake Industry Volume k unit Forecast, by Form 2019 & 2032
- Table 69: Global Cake Industry Revenue Million Forecast, by Product Type 2019 & 2032
- Table 70: Global Cake Industry Volume k unit Forecast, by Product Type 2019 & 2032
- Table 71: Global Cake Industry Revenue Million Forecast, by Distribution Channel 2019 & 2032
- Table 72: Global Cake Industry Volume k unit Forecast, by Distribution Channel 2019 & 2032
- Table 73: Global Cake Industry Revenue Million Forecast, by Country 2019 & 2032
- Table 74: Global Cake Industry Volume k unit Forecast, by Country 2019 & 2032
- Table 75: United States Cake Industry Revenue (Million) Forecast, by Application 2019 & 2032
- Table 76: United States Cake Industry Volume (k unit) Forecast, by Application 2019 & 2032
- Table 77: Canada Cake Industry Revenue (Million) Forecast, by Application 2019 & 2032
- Table 78: Canada Cake Industry Volume (k unit) Forecast, by Application 2019 & 2032
- Table 79: Mexico Cake Industry Revenue (Million) Forecast, by Application 2019 & 2032
- Table 80: Mexico Cake Industry Volume (k unit) Forecast, by Application 2019 & 2032
- Table 81: Rest of North America Cake Industry Revenue (Million) Forecast, by Application 2019 & 2032
- Table 82: Rest of North America Cake Industry Volume (k unit) Forecast, by Application 2019 & 2032
- Table 83: Global Cake Industry Revenue Million Forecast, by Form 2019 & 2032
- Table 84: Global Cake Industry Volume k unit Forecast, by Form 2019 & 2032
- Table 85: Global Cake Industry Revenue Million Forecast, by Product Type 2019 & 2032
- Table 86: Global Cake Industry Volume k unit Forecast, by Product Type 2019 & 2032
- Table 87: Global Cake Industry Revenue Million Forecast, by Distribution Channel 2019 & 2032
- Table 88: Global Cake Industry Volume k unit Forecast, by Distribution Channel 2019 & 2032
- Table 89: Global Cake Industry Revenue Million Forecast, by Country 2019 & 2032
- Table 90: Global Cake Industry Volume k unit Forecast, by Country 2019 & 2032
- Table 91: Germany Cake Industry Revenue (Million) Forecast, by Application 2019 & 2032
- Table 92: Germany Cake Industry Volume (k unit) Forecast, by Application 2019 & 2032
- Table 93: United Kingdom Cake Industry Revenue (Million) Forecast, by Application 2019 & 2032
- Table 94: United Kingdom Cake Industry Volume (k unit) Forecast, by Application 2019 & 2032
- Table 95: France Cake Industry Revenue (Million) Forecast, by Application 2019 & 2032
- Table 96: France Cake Industry Volume (k unit) Forecast, by Application 2019 & 2032
- Table 97: Russia Cake Industry Revenue (Million) Forecast, by Application 2019 & 2032
- Table 98: Russia Cake Industry Volume (k unit) Forecast, by Application 2019 & 2032
- Table 99: Spain Cake Industry Revenue (Million) Forecast, by Application 2019 & 2032
- Table 100: Spain Cake Industry Volume (k unit) Forecast, by Application 2019 & 2032
- Table 101: Italy Cake Industry Revenue (Million) Forecast, by Application 2019 & 2032
- Table 102: Italy Cake Industry Volume (k unit) Forecast, by Application 2019 & 2032
- Table 103: Rest of Europe Cake Industry Revenue (Million) Forecast, by Application 2019 & 2032
- Table 104: Rest of Europe Cake Industry Volume (k unit) Forecast, by Application 2019 & 2032
- Table 105: Global Cake Industry Revenue Million Forecast, by Form 2019 & 2032
- Table 106: Global Cake Industry Volume k unit Forecast, by Form 2019 & 2032
- Table 107: Global Cake Industry Revenue Million Forecast, by Product Type 2019 & 2032
- Table 108: Global Cake Industry Volume k unit Forecast, by Product Type 2019 & 2032
- Table 109: Global Cake Industry Revenue Million Forecast, by Distribution Channel 2019 & 2032
- Table 110: Global Cake Industry Volume k unit Forecast, by Distribution Channel 2019 & 2032
- Table 111: Global Cake Industry Revenue Million Forecast, by Country 2019 & 2032
- Table 112: Global Cake Industry Volume k unit Forecast, by Country 2019 & 2032
- Table 113: China Cake Industry Revenue (Million) Forecast, by Application 2019 & 2032
- Table 114: China Cake Industry Volume (k unit) Forecast, by Application 2019 & 2032
- Table 115: Japan Cake Industry Revenue (Million) Forecast, by Application 2019 & 2032
- Table 116: Japan Cake Industry Volume (k unit) Forecast, by Application 2019 & 2032
- Table 117: India Cake Industry Revenue (Million) Forecast, by Application 2019 & 2032
- Table 118: India Cake Industry Volume (k unit) Forecast, by Application 2019 & 2032
- Table 119: Australia Cake Industry Revenue (Million) Forecast, by Application 2019 & 2032
- Table 120: Australia Cake Industry Volume (k unit) Forecast, by Application 2019 & 2032
- Table 121: Pakistan Cake Industry Revenue (Million) Forecast, by Application 2019 & 2032
- Table 122: Pakistan Cake Industry Volume (k unit) Forecast, by Application 2019 & 2032
- Table 123: Rest of Asia Pacific Cake Industry Revenue (Million) Forecast, by Application 2019 & 2032
- Table 124: Rest of Asia Pacific Cake Industry Volume (k unit) Forecast, by Application 2019 & 2032
- Table 125: Global Cake Industry Revenue Million Forecast, by Form 2019 & 2032
- Table 126: Global Cake Industry Volume k unit Forecast, by Form 2019 & 2032
- Table 127: Global Cake Industry Revenue Million Forecast, by Product Type 2019 & 2032
- Table 128: Global Cake Industry Volume k unit Forecast, by Product Type 2019 & 2032
- Table 129: Global Cake Industry Revenue Million Forecast, by Distribution Channel 2019 & 2032
- Table 130: Global Cake Industry Volume k unit Forecast, by Distribution Channel 2019 & 2032
- Table 131: Global Cake Industry Revenue Million Forecast, by Country 2019 & 2032
- Table 132: Global Cake Industry Volume k unit Forecast, by Country 2019 & 2032
- Table 133: Brazil Cake Industry Revenue (Million) Forecast, by Application 2019 & 2032
- Table 134: Brazil Cake Industry Volume (k unit) Forecast, by Application 2019 & 2032
- Table 135: Argentina Cake Industry Revenue (Million) Forecast, by Application 2019 & 2032
- Table 136: Argentina Cake Industry Volume (k unit) Forecast, by Application 2019 & 2032
- Table 137: Rest of South America Cake Industry Revenue (Million) Forecast, by Application 2019 & 2032
- Table 138: Rest of South America Cake Industry Volume (k unit) Forecast, by Application 2019 & 2032
- Table 139: Global Cake Industry Revenue Million Forecast, by Form 2019 & 2032
- Table 140: Global Cake Industry Volume k unit Forecast, by Form 2019 & 2032
- Table 141: Global Cake Industry Revenue Million Forecast, by Product Type 2019 & 2032
- Table 142: Global Cake Industry Volume k unit Forecast, by Product Type 2019 & 2032
- Table 143: Global Cake Industry Revenue Million Forecast, by Distribution Channel 2019 & 2032
- Table 144: Global Cake Industry Volume k unit Forecast, by Distribution Channel 2019 & 2032
- Table 145: Global Cake Industry Revenue Million Forecast, by Country 2019 & 2032
- Table 146: Global Cake Industry Volume k unit Forecast, by Country 2019 & 2032
- Table 147: South Africa Cake Industry Revenue (Million) Forecast, by Application 2019 & 2032
- Table 148: South Africa Cake Industry Volume (k unit) Forecast, by Application 2019 & 2032
- Table 149: Saudi Arabia Cake Industry Revenue (Million) Forecast, by Application 2019 & 2032
- Table 150: Saudi Arabia Cake Industry Volume (k unit) Forecast, by Application 2019 & 2032
- Table 151: Rest of Middle East and Africa Cake Industry Revenue (Million) Forecast, by Application 2019 & 2032
- Table 152: Rest of Middle East and Africa Cake Industry Volume (k unit) Forecast, by Application 2019 & 2032
Frequently Asked Questions
1. What is the projected Compound Annual Growth Rate (CAGR) of the Cake Industry?
The projected CAGR is approximately 4.03%.
2. Which companies are prominent players in the Cake Industry?
Key companies in the market include Grupo Bimbo S A B de C V, DoFreeze LLC, Valeo Foods Group, The J M Smucker Company, Monginis Foods Private Limited, Flowers Foods Inc, Bonn Group of Industries, Yıldız Holding *List Not Exhaustive, McKee Foods Corporation, Britannia Industries Limited.
3. What are the main segments of the Cake Industry?
The market segments include Form, Product Type, Distribution Channel.
4. Can you provide details about the market size?
The market size is estimated to be USD 97.96 Million as of 2022.
5. What are some drivers contributing to market growth?
Increase in Number Of Social Event Celebration; Innovations In Designs And Flavors.
6. What are the notable trends driving market growth?
Increase in Number Of Social Event Celebration.
7. Are there any restraints impacting market growth?
Health Concerns Related To Ingredients.
8. Can you provide examples of recent developments in the market?
March 2024: The Hostess brand expanded its product portfolio by launching Hostess Meltamors, a soft, fluffy mini-cake with a delightful chocolate-flavored drizzle and a chocolatey- or caramel-flavored melting center that flows like "lava" when warmed in the microwave.
9. What pricing options are available for accessing the report?
Pricing options include single-user, multi-user, and enterprise licenses priced at USD 4750, USD 5250, and USD 8750 respectively.
10. Is the market size provided in terms of value or volume?
The market size is provided in terms of value, measured in Million and volume, measured in k unit.
11. Are there any specific market keywords associated with the report?
Yes, the market keyword associated with the report is "Cake Industry," which aids in identifying and referencing the specific market segment covered.
12. How do I determine which pricing option suits my needs best?
The pricing options vary based on user requirements and access needs. Individual users may opt for single-user licenses, while businesses requiring broader access may choose multi-user or enterprise licenses for cost-effective access to the report.
13. Are there any additional resources or data provided in the Cake Industry report?
While the report offers comprehensive insights, it's advisable to review the specific contents or supplementary materials provided to ascertain if additional resources or data are available.
14. How can I stay updated on further developments or reports in the Cake Industry?
To stay informed about further developments, trends, and reports in the Cake Industry, consider subscribing to industry newsletters, following relevant companies and organizations, or regularly checking reputable industry news sources and publications.
Methodology
Step 1 - Identification of Relevant Samples Size from Population Database


Step 2 - Approaches for Defining Global Market Size (Value, Volume* & Price*)

Note*: In applicable scenarios
Step 3 - Data Sources
Primary Research
- Web Analytics
- Survey Reports
- Research Institute
- Latest Research Reports
- Opinion Leaders
Secondary Research
- Annual Reports
- White Paper
- Latest Press Release
- Industry Association
- Paid Database
- Investor Presentations

Step 4 - Data Triangulation
Involves using different sources of information in order to increase the validity of a study
These sources are likely to be stakeholders in a program - participants, other researchers, program staff, other community members, and so on.
Then we put all data in single framework & apply various statistical tools to find out the dynamic on the market.
During the analysis stage, feedback from the stakeholder groups would be compared to determine areas of agreement as well as areas of divergence


