
Key Insights
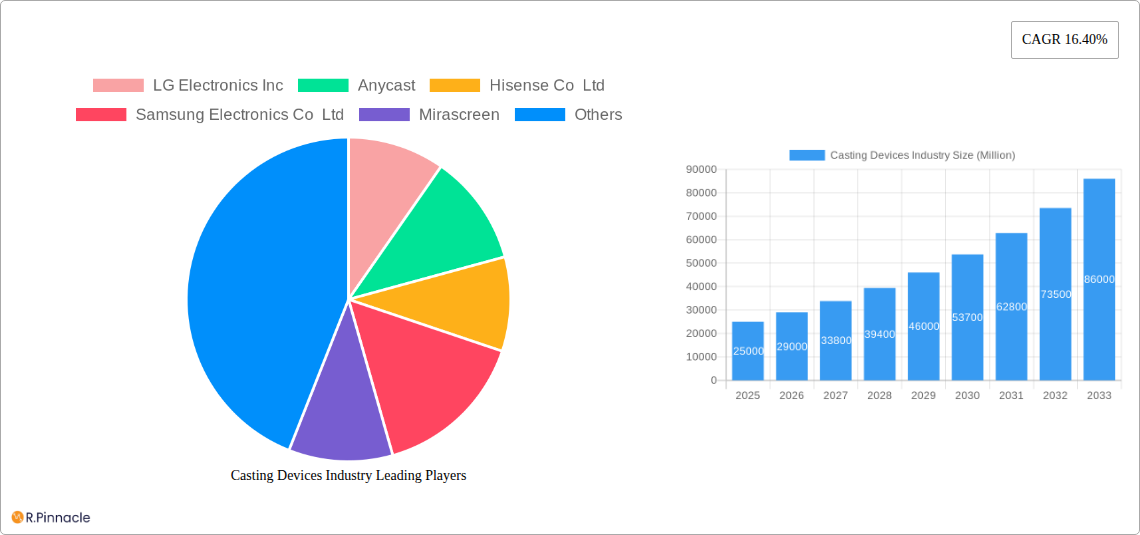
The global casting devices market is experiencing robust growth, projected to reach a substantial size within the forecast period (2025-2033). A Compound Annual Growth Rate (CAGR) of 16.40% signifies significant market expansion driven by several key factors. The increasing adoption of smart TVs, coupled with the rising demand for seamless streaming of content from smartphones and other devices to larger screens, is a primary driver. Furthermore, advancements in wireless technologies, such as Wi-Fi 6 and improved bandwidth capabilities, are enhancing the user experience and driving market penetration. The convenience and affordability of casting devices compared to traditional wired connections are significant contributing factors to their widespread adoption across both residential and commercial sectors. The market is segmented by device type (Game Consoles, Media Streamers, Smart TVs) and end-user (Commercial, Residential), with the residential segment currently dominating, though commercial applications, particularly in digital signage and presentations, are experiencing notable growth. Competition is fierce, with established players like Apple, Google, Amazon, and Samsung alongside specialized companies like Roku, Chromecast, and others constantly innovating to capture market share. Geographic distribution reveals strong demand in North America and Asia-Pacific, with developing economies in Asia-Pacific expected to contribute significantly to future market growth. However, challenges remain, including potential security concerns related to data transmission and the emergence of integrated casting features within newer smart TVs and other devices, which could potentially slow down the growth of standalone casting devices.
The market's future trajectory depends on several factors. Continued technological advancements in both casting devices and supporting technologies like 5G will play a crucial role. The ongoing integration of voice control and artificial intelligence features into casting devices further enhances user experience and attracts a wider user base. However, price competition and the need for continuous innovation to stay ahead of the curve are key considerations for market players. Successfully navigating these factors will be crucial for achieving sustained growth within this dynamic market. Growth in emerging economies, driven by increasing disposable incomes and internet penetration, will also substantially influence the overall market size and shape the competitive landscape during the forecast period. A focus on user experience, enhanced security features, and strategic partnerships will likely become paramount for sustained success in the global casting devices market.
Casting Devices Industry Market Report: 2019-2033
This comprehensive report provides an in-depth analysis of the global Casting Devices industry, offering invaluable insights for industry professionals, investors, and strategic decision-makers. The study period spans 2019-2033, with a base year of 2025 and a forecast period of 2025-2033. The report leverages extensive data analysis to predict a market valued at $XX Million by 2033, revealing key trends, opportunities, and challenges shaping this dynamic sector.
Casting Devices Industry Market Structure & Innovation Trends
The Casting Devices market is characterized by a moderately concentrated structure with key players like LG Electronics Inc, Samsung Electronics Co Ltd, Microsoft Corporation, Amazon com Inc, Apple Inc, and Google Inc holding significant market share. The combined market share of these top players is estimated at XX%, leaving room for smaller players like Anycast, Hisense Co Ltd, Mirascreen, Airtame ApS, Roku Inc, Nvidia Corporation, and EZCast to compete. Innovation is driven by advancements in streaming technologies, improved user interfaces, and the integration of smart home ecosystems. Regulatory frameworks, particularly those related to data privacy and security, significantly influence market dynamics. Product substitutes, such as built-in screen mirroring capabilities in newer devices, pose a competitive threat. The end-user demographic is expanding rapidly, driven by increasing internet penetration and the adoption of streaming services across residential and commercial sectors. M&A activity in the Casting Devices market has been relatively moderate, with deal values totaling approximately $XX Million over the past five years. Key M&A activities observed include:
- Strategic acquisitions to expand product portfolios and geographical reach.
- Partnerships to leverage complementary technologies and distribution networks.
Casting Devices Industry Market Dynamics & Trends
The Casting Devices market is experiencing robust growth, driven by several factors. The increasing popularity of streaming services and online content consumption is a major catalyst. Technological advancements, such as the introduction of higher resolutions and improved wireless connectivity (e.g., Wi-Fi 6E), are enhancing the user experience and driving demand. Consumer preference is shifting towards seamless and integrated streaming solutions that are user-friendly and compatible with diverse devices. The market is characterized by intense competition among established players and emerging entrants, leading to continuous product innovation and price reductions. The Compound Annual Growth Rate (CAGR) for the Casting Devices market during the forecast period (2025-2033) is projected to be XX%. Market penetration is expected to increase significantly, particularly in developing economies. The adoption of 4K and 8K resolution streaming is further fueling the demand and will drive the growth of the industry. The growing adoption of smart homes will also significantly affect the market's growth.
Dominant Regions & Segments in Casting Devices Industry
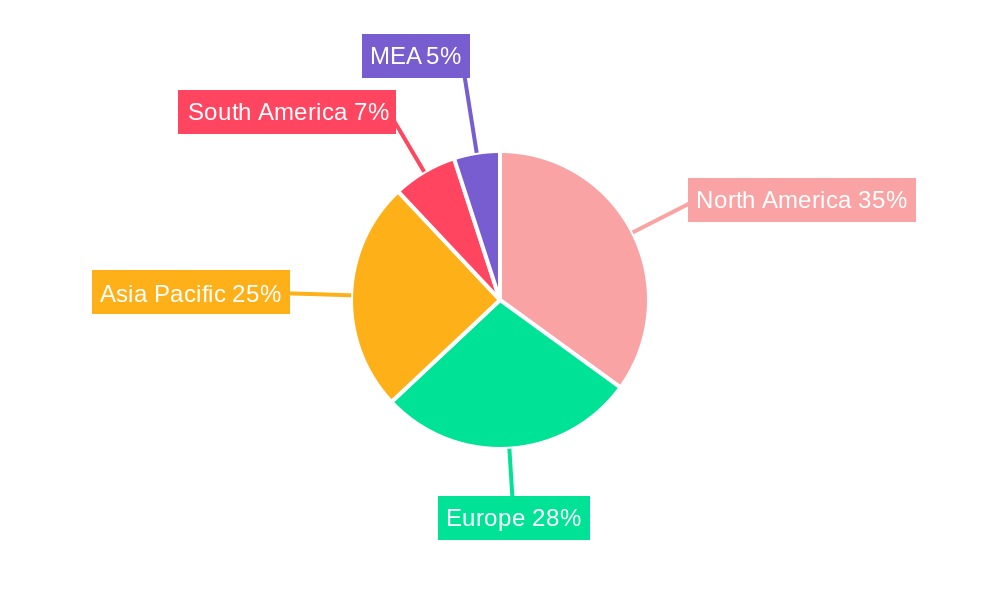
North America currently dominates the Casting Devices market, followed by Europe and Asia-Pacific. The dominance of North America is attributed to high internet penetration rates, a strong preference for streaming services, and early adoption of smart home technology.
By Type:
- Smart TVs: This segment holds the largest market share, driven by the integration of casting functionalities into most modern TVs.
- Media Streamers: The media streamer segment is experiencing rapid growth due to its affordability and versatility.
- Game Consoles: This segment is witnessing moderate growth, owing to its niche appeal among dedicated gamers.
By End-User:
- Residential: The residential segment constitutes the largest share, driven by the widespread adoption of smart TVs and streaming devices in homes.
- Commercial: The commercial segment shows promising growth, driven by businesses incorporating casting devices for presentations and digital signage.
Key drivers for regional dominance include:
- Strong economic growth and disposable incomes.
- Well-developed digital infrastructure and high internet penetration.
- Favorable government policies and regulations.
Casting Devices Industry Product Innovations
Recent product innovations focus on enhancing user experience, improving connectivity, and integrating smart home features. These include features like voice control, improved image quality (e.g., HDR, 4K, 8K), seamless integration with various platforms, and enhanced security protocols. The market is witnessing a shift towards more compact and energy-efficient devices. Manufacturers are also focusing on developing devices with enhanced compatibility with diverse operating systems and smart home ecosystems.
Report Scope & Segmentation Analysis
This report segments the Casting Devices market based on Type (Game Consoles, Media Streamers, Smart TVs) and End-User (Commercial, Residential). Each segment's growth trajectory is analyzed with forecasts provided for market size and competitive dynamics within each category. Detailed analysis of market size, growth projections, and competitive landscapes are provided for each segment.
Key Drivers of Casting Devices Industry Growth
Several key factors contribute to the growth of the Casting Devices industry. These include:
- The rising popularity of online streaming services.
- The increasing affordability and accessibility of high-speed internet.
- Advancements in wireless technologies enabling seamless casting.
- The integration of casting functionalities into smart TVs and other smart devices.
- The growing adoption of smart home ecosystems.
Challenges in the Casting Devices Industry Sector
The Casting Devices industry faces several challenges, including:
- Intense competition among established players and new entrants.
- Concerns regarding data security and privacy.
- Potential disruptions to the supply chain due to geopolitical factors.
- The emergence of alternative technologies (e.g., advanced screen mirroring capabilities).
- Technical complexities associated with cross-platform compatibility.
Emerging Opportunities in Casting Devices Industry
Emerging opportunities in the Casting Devices industry include:
- Expanding into new and emerging markets with high growth potential.
- Developing devices with advanced features (e.g., 8K resolution, AI-powered features).
- Focusing on niche markets with specific needs (e.g., professional applications).
- Leveraging partnerships and collaborations to expand product portfolios and market reach.
- Adopting sustainable practices to meet the growing demand for eco-friendly products.
Leading Players in the Casting Devices Industry Market
- LG Electronics Inc
- Anycast
- Hisense Co Ltd
- Samsung Electronics Co Ltd
- Mirascreen
- Microsoft Corporation
- Amazon com Inc
- Airtame ApS
- Roku Inc
- Nvidia Corporation
- Google Inc
- Apple Inc
- EZCast
Key Developments in Casting Devices Industry Industry
- 2023 (Q3): Samsung launched its new Smart TV models with enhanced casting capabilities and improved user interface.
- 2022 (Q4): Amazon announced a new line of Fire TV Sticks with improved processing power and 4K support.
- 2021 (Q1): Google partnered with several major TV manufacturers to integrate its Chromecast technology into their devices. (Further specific developments will be added in the final report)
Future Outlook for Casting Devices Industry Market
The future of the Casting Devices industry appears bright, driven by continuous technological advancements, the increasing demand for seamless streaming experiences, and expanding adoption across diverse end-user segments. New opportunities will arise from innovations in display technologies, improved wireless connectivity, and the integration of advanced features such as AI and voice control. The market is expected to continue its growth trajectory, driven by the expanding popularity of streaming services and smart home devices. Strategic partnerships and M&A activities are likely to reshape the competitive landscape further.
Casting Devices Industry Segmentation
-
1. Type
- 1.1. Game Consoles
- 1.2. Media Streamers
- 1.3. Smart TVs
-
2. End-User
- 2.1. Commercial
- 2.2. Residential
Casting Devices Industry Segmentation By Geography
- 1. North America
- 2. Europe
- 3. Asia Pacific
- 4. Rest of the World
Casting Devices Industry REPORT HIGHLIGHTS
| Aspects | Details |
|---|---|
| Study Period | 2019-2033 |
| Base Year | 2024 |
| Estimated Year | 2025 |
| Forecast Period | 2025-2033 |
| Historical Period | 2019-2024 |
| Growth Rate | CAGR of 16.40% from 2019-2033 |
| Segmentation |
|
Table of Contents
- 1. Introduction
- 1.1. Research Scope
- 1.2. Market Segmentation
- 1.3. Research Methodology
- 1.4. Definitions and Assumptions
- 2. Executive Summary
- 2.1. Introduction
- 3. Market Dynamics
- 3.1. Introduction
- 3.2. Market Drivers
- 3.2.1. ; Growing Consumption of Video-on-Demand (VoD) Services; Increasing Adoption of Casting Devices with Changing Consumer Behavior
- 3.3. Market Restrains
- 3.3.1. ; Increasing Availability of Native Smart TV Apps
- 3.4. Market Trends
- 3.4.1. Smart TV Segment is expected to occupy a Significant Market Share during the Forecast Period
- 4. Market Factor Analysis
- 4.1. Porters Five Forces
- 4.2. Supply/Value Chain
- 4.3. PESTEL analysis
- 4.4. Market Entropy
- 4.5. Patent/Trademark Analysis
- 5. Global Casting Devices Industry Analysis, Insights and Forecast, 2019-2031
- 5.1. Market Analysis, Insights and Forecast - by Type
- 5.1.1. Game Consoles
- 5.1.2. Media Streamers
- 5.1.3. Smart TVs
- 5.2. Market Analysis, Insights and Forecast - by End-User
- 5.2.1. Commercial
- 5.2.2. Residential
- 5.3. Market Analysis, Insights and Forecast - by Region
- 5.3.1. North America
- 5.3.2. Europe
- 5.3.3. Asia Pacific
- 5.3.4. Rest of the World
- 5.1. Market Analysis, Insights and Forecast - by Type
- 6. North America Casting Devices Industry Analysis, Insights and Forecast, 2019-2031
- 6.1. Market Analysis, Insights and Forecast - by Type
- 6.1.1. Game Consoles
- 6.1.2. Media Streamers
- 6.1.3. Smart TVs
- 6.2. Market Analysis, Insights and Forecast - by End-User
- 6.2.1. Commercial
- 6.2.2. Residential
- 6.1. Market Analysis, Insights and Forecast - by Type
- 7. Europe Casting Devices Industry Analysis, Insights and Forecast, 2019-2031
- 7.1. Market Analysis, Insights and Forecast - by Type
- 7.1.1. Game Consoles
- 7.1.2. Media Streamers
- 7.1.3. Smart TVs
- 7.2. Market Analysis, Insights and Forecast - by End-User
- 7.2.1. Commercial
- 7.2.2. Residential
- 7.1. Market Analysis, Insights and Forecast - by Type
- 8. Asia Pacific Casting Devices Industry Analysis, Insights and Forecast, 2019-2031
- 8.1. Market Analysis, Insights and Forecast - by Type
- 8.1.1. Game Consoles
- 8.1.2. Media Streamers
- 8.1.3. Smart TVs
- 8.2. Market Analysis, Insights and Forecast - by End-User
- 8.2.1. Commercial
- 8.2.2. Residential
- 8.1. Market Analysis, Insights and Forecast - by Type
- 9. Rest of the World Casting Devices Industry Analysis, Insights and Forecast, 2019-2031
- 9.1. Market Analysis, Insights and Forecast - by Type
- 9.1.1. Game Consoles
- 9.1.2. Media Streamers
- 9.1.3. Smart TVs
- 9.2. Market Analysis, Insights and Forecast - by End-User
- 9.2.1. Commercial
- 9.2.2. Residential
- 9.1. Market Analysis, Insights and Forecast - by Type
- 10. North America Casting Devices Industry Analysis, Insights and Forecast, 2019-2031
- 10.1. Market Analysis, Insights and Forecast - By Country/Sub-region
- 10.1.1 United States
- 10.1.2 Canada
- 10.1.3 Mexico
- 11. Europe Casting Devices Industry Analysis, Insights and Forecast, 2019-2031
- 11.1. Market Analysis, Insights and Forecast - By Country/Sub-region
- 11.1.1 Germany
- 11.1.2 United Kingdom
- 11.1.3 France
- 11.1.4 Spain
- 11.1.5 Italy
- 11.1.6 Spain
- 11.1.7 Belgium
- 11.1.8 Netherland
- 11.1.9 Nordics
- 11.1.10 Rest of Europe
- 12. Asia Pacific Casting Devices Industry Analysis, Insights and Forecast, 2019-2031
- 12.1. Market Analysis, Insights and Forecast - By Country/Sub-region
- 12.1.1 China
- 12.1.2 Japan
- 12.1.3 India
- 12.1.4 South Korea
- 12.1.5 Southeast Asia
- 12.1.6 Australia
- 12.1.7 Indonesia
- 12.1.8 Phillipes
- 12.1.9 Singapore
- 12.1.10 Thailandc
- 12.1.11 Rest of Asia Pacific
- 13. South America Casting Devices Industry Analysis, Insights and Forecast, 2019-2031
- 13.1. Market Analysis, Insights and Forecast - By Country/Sub-region
- 13.1.1 Brazil
- 13.1.2 Argentina
- 13.1.3 Peru
- 13.1.4 Chile
- 13.1.5 Colombia
- 13.1.6 Ecuador
- 13.1.7 Venezuela
- 13.1.8 Rest of South America
- 14. North America Casting Devices Industry Analysis, Insights and Forecast, 2019-2031
- 14.1. Market Analysis, Insights and Forecast - By Country/Sub-region
- 14.1.1 United States
- 14.1.2 Canada
- 14.1.3 Mexico
- 15. MEA Casting Devices Industry Analysis, Insights and Forecast, 2019-2031
- 15.1. Market Analysis, Insights and Forecast - By Country/Sub-region
- 15.1.1 United Arab Emirates
- 15.1.2 Saudi Arabia
- 15.1.3 South Africa
- 15.1.4 Rest of Middle East and Africa
- 16. Competitive Analysis
- 16.1. Global Market Share Analysis 2024
- 16.2. Company Profiles
- 16.2.1 LG Electronics Inc
- 16.2.1.1. Overview
- 16.2.1.2. Products
- 16.2.1.3. SWOT Analysis
- 16.2.1.4. Recent Developments
- 16.2.1.5. Financials (Based on Availability)
- 16.2.2 Anycast
- 16.2.2.1. Overview
- 16.2.2.2. Products
- 16.2.2.3. SWOT Analysis
- 16.2.2.4. Recent Developments
- 16.2.2.5. Financials (Based on Availability)
- 16.2.3 Hisense Co Ltd
- 16.2.3.1. Overview
- 16.2.3.2. Products
- 16.2.3.3. SWOT Analysis
- 16.2.3.4. Recent Developments
- 16.2.3.5. Financials (Based on Availability)
- 16.2.4 Samsung Electronics Co Ltd
- 16.2.4.1. Overview
- 16.2.4.2. Products
- 16.2.4.3. SWOT Analysis
- 16.2.4.4. Recent Developments
- 16.2.4.5. Financials (Based on Availability)
- 16.2.5 Mirascreen
- 16.2.5.1. Overview
- 16.2.5.2. Products
- 16.2.5.3. SWOT Analysis
- 16.2.5.4. Recent Developments
- 16.2.5.5. Financials (Based on Availability)
- 16.2.6 Microsoft Corporation
- 16.2.6.1. Overview
- 16.2.6.2. Products
- 16.2.6.3. SWOT Analysis
- 16.2.6.4. Recent Developments
- 16.2.6.5. Financials (Based on Availability)
- 16.2.7 Amazon com Inc
- 16.2.7.1. Overview
- 16.2.7.2. Products
- 16.2.7.3. SWOT Analysis
- 16.2.7.4. Recent Developments
- 16.2.7.5. Financials (Based on Availability)
- 16.2.8 Airtame ApS
- 16.2.8.1. Overview
- 16.2.8.2. Products
- 16.2.8.3. SWOT Analysis
- 16.2.8.4. Recent Developments
- 16.2.8.5. Financials (Based on Availability)
- 16.2.9 Roku Inc
- 16.2.9.1. Overview
- 16.2.9.2. Products
- 16.2.9.3. SWOT Analysis
- 16.2.9.4. Recent Developments
- 16.2.9.5. Financials (Based on Availability)
- 16.2.10 Nvidia Corporation
- 16.2.10.1. Overview
- 16.2.10.2. Products
- 16.2.10.3. SWOT Analysis
- 16.2.10.4. Recent Developments
- 16.2.10.5. Financials (Based on Availability)
- 16.2.11 Google Inc
- 16.2.11.1. Overview
- 16.2.11.2. Products
- 16.2.11.3. SWOT Analysis
- 16.2.11.4. Recent Developments
- 16.2.11.5. Financials (Based on Availability)
- 16.2.12 Apple Inc
- 16.2.12.1. Overview
- 16.2.12.2. Products
- 16.2.12.3. SWOT Analysis
- 16.2.12.4. Recent Developments
- 16.2.12.5. Financials (Based on Availability)
- 16.2.13 EZCast
- 16.2.13.1. Overview
- 16.2.13.2. Products
- 16.2.13.3. SWOT Analysis
- 16.2.13.4. Recent Developments
- 16.2.13.5. Financials (Based on Availability)
- 16.2.1 LG Electronics Inc
List of Figures
- Figure 1: Global Casting Devices Industry Revenue Breakdown (Million, %) by Region 2024 & 2032
- Figure 2: Global Casting Devices Industry Volume Breakdown (K Unit, %) by Region 2024 & 2032
- Figure 3: North America Casting Devices Industry Revenue (Million), by Country 2024 & 2032
- Figure 4: North America Casting Devices Industry Volume (K Unit), by Country 2024 & 2032
- Figure 5: North America Casting Devices Industry Revenue Share (%), by Country 2024 & 2032
- Figure 6: North America Casting Devices Industry Volume Share (%), by Country 2024 & 2032
- Figure 7: Europe Casting Devices Industry Revenue (Million), by Country 2024 & 2032
- Figure 8: Europe Casting Devices Industry Volume (K Unit), by Country 2024 & 2032
- Figure 9: Europe Casting Devices Industry Revenue Share (%), by Country 2024 & 2032
- Figure 10: Europe Casting Devices Industry Volume Share (%), by Country 2024 & 2032
- Figure 11: Asia Pacific Casting Devices Industry Revenue (Million), by Country 2024 & 2032
- Figure 12: Asia Pacific Casting Devices Industry Volume (K Unit), by Country 2024 & 2032
- Figure 13: Asia Pacific Casting Devices Industry Revenue Share (%), by Country 2024 & 2032
- Figure 14: Asia Pacific Casting Devices Industry Volume Share (%), by Country 2024 & 2032
- Figure 15: South America Casting Devices Industry Revenue (Million), by Country 2024 & 2032
- Figure 16: South America Casting Devices Industry Volume (K Unit), by Country 2024 & 2032
- Figure 17: South America Casting Devices Industry Revenue Share (%), by Country 2024 & 2032
- Figure 18: South America Casting Devices Industry Volume Share (%), by Country 2024 & 2032
- Figure 19: North America Casting Devices Industry Revenue (Million), by Country 2024 & 2032
- Figure 20: North America Casting Devices Industry Volume (K Unit), by Country 2024 & 2032
- Figure 21: North America Casting Devices Industry Revenue Share (%), by Country 2024 & 2032
- Figure 22: North America Casting Devices Industry Volume Share (%), by Country 2024 & 2032
- Figure 23: MEA Casting Devices Industry Revenue (Million), by Country 2024 & 2032
- Figure 24: MEA Casting Devices Industry Volume (K Unit), by Country 2024 & 2032
- Figure 25: MEA Casting Devices Industry Revenue Share (%), by Country 2024 & 2032
- Figure 26: MEA Casting Devices Industry Volume Share (%), by Country 2024 & 2032
- Figure 27: North America Casting Devices Industry Revenue (Million), by Type 2024 & 2032
- Figure 28: North America Casting Devices Industry Volume (K Unit), by Type 2024 & 2032
- Figure 29: North America Casting Devices Industry Revenue Share (%), by Type 2024 & 2032
- Figure 30: North America Casting Devices Industry Volume Share (%), by Type 2024 & 2032
- Figure 31: North America Casting Devices Industry Revenue (Million), by End-User 2024 & 2032
- Figure 32: North America Casting Devices Industry Volume (K Unit), by End-User 2024 & 2032
- Figure 33: North America Casting Devices Industry Revenue Share (%), by End-User 2024 & 2032
- Figure 34: North America Casting Devices Industry Volume Share (%), by End-User 2024 & 2032
- Figure 35: North America Casting Devices Industry Revenue (Million), by Country 2024 & 2032
- Figure 36: North America Casting Devices Industry Volume (K Unit), by Country 2024 & 2032
- Figure 37: North America Casting Devices Industry Revenue Share (%), by Country 2024 & 2032
- Figure 38: North America Casting Devices Industry Volume Share (%), by Country 2024 & 2032
- Figure 39: Europe Casting Devices Industry Revenue (Million), by Type 2024 & 2032
- Figure 40: Europe Casting Devices Industry Volume (K Unit), by Type 2024 & 2032
- Figure 41: Europe Casting Devices Industry Revenue Share (%), by Type 2024 & 2032
- Figure 42: Europe Casting Devices Industry Volume Share (%), by Type 2024 & 2032
- Figure 43: Europe Casting Devices Industry Revenue (Million), by End-User 2024 & 2032
- Figure 44: Europe Casting Devices Industry Volume (K Unit), by End-User 2024 & 2032
- Figure 45: Europe Casting Devices Industry Revenue Share (%), by End-User 2024 & 2032
- Figure 46: Europe Casting Devices Industry Volume Share (%), by End-User 2024 & 2032
- Figure 47: Europe Casting Devices Industry Revenue (Million), by Country 2024 & 2032
- Figure 48: Europe Casting Devices Industry Volume (K Unit), by Country 2024 & 2032
- Figure 49: Europe Casting Devices Industry Revenue Share (%), by Country 2024 & 2032
- Figure 50: Europe Casting Devices Industry Volume Share (%), by Country 2024 & 2032
- Figure 51: Asia Pacific Casting Devices Industry Revenue (Million), by Type 2024 & 2032
- Figure 52: Asia Pacific Casting Devices Industry Volume (K Unit), by Type 2024 & 2032
- Figure 53: Asia Pacific Casting Devices Industry Revenue Share (%), by Type 2024 & 2032
- Figure 54: Asia Pacific Casting Devices Industry Volume Share (%), by Type 2024 & 2032
- Figure 55: Asia Pacific Casting Devices Industry Revenue (Million), by End-User 2024 & 2032
- Figure 56: Asia Pacific Casting Devices Industry Volume (K Unit), by End-User 2024 & 2032
- Figure 57: Asia Pacific Casting Devices Industry Revenue Share (%), by End-User 2024 & 2032
- Figure 58: Asia Pacific Casting Devices Industry Volume Share (%), by End-User 2024 & 2032
- Figure 59: Asia Pacific Casting Devices Industry Revenue (Million), by Country 2024 & 2032
- Figure 60: Asia Pacific Casting Devices Industry Volume (K Unit), by Country 2024 & 2032
- Figure 61: Asia Pacific Casting Devices Industry Revenue Share (%), by Country 2024 & 2032
- Figure 62: Asia Pacific Casting Devices Industry Volume Share (%), by Country 2024 & 2032
- Figure 63: Rest of the World Casting Devices Industry Revenue (Million), by Type 2024 & 2032
- Figure 64: Rest of the World Casting Devices Industry Volume (K Unit), by Type 2024 & 2032
- Figure 65: Rest of the World Casting Devices Industry Revenue Share (%), by Type 2024 & 2032
- Figure 66: Rest of the World Casting Devices Industry Volume Share (%), by Type 2024 & 2032
- Figure 67: Rest of the World Casting Devices Industry Revenue (Million), by End-User 2024 & 2032
- Figure 68: Rest of the World Casting Devices Industry Volume (K Unit), by End-User 2024 & 2032
- Figure 69: Rest of the World Casting Devices Industry Revenue Share (%), by End-User 2024 & 2032
- Figure 70: Rest of the World Casting Devices Industry Volume Share (%), by End-User 2024 & 2032
- Figure 71: Rest of the World Casting Devices Industry Revenue (Million), by Country 2024 & 2032
- Figure 72: Rest of the World Casting Devices Industry Volume (K Unit), by Country 2024 & 2032
- Figure 73: Rest of the World Casting Devices Industry Revenue Share (%), by Country 2024 & 2032
- Figure 74: Rest of the World Casting Devices Industry Volume Share (%), by Country 2024 & 2032
List of Tables
- Table 1: Global Casting Devices Industry Revenue Million Forecast, by Region 2019 & 2032
- Table 2: Global Casting Devices Industry Volume K Unit Forecast, by Region 2019 & 2032
- Table 3: Global Casting Devices Industry Revenue Million Forecast, by Type 2019 & 2032
- Table 4: Global Casting Devices Industry Volume K Unit Forecast, by Type 2019 & 2032
- Table 5: Global Casting Devices Industry Revenue Million Forecast, by End-User 2019 & 2032
- Table 6: Global Casting Devices Industry Volume K Unit Forecast, by End-User 2019 & 2032
- Table 7: Global Casting Devices Industry Revenue Million Forecast, by Region 2019 & 2032
- Table 8: Global Casting Devices Industry Volume K Unit Forecast, by Region 2019 & 2032
- Table 9: Global Casting Devices Industry Revenue Million Forecast, by Country 2019 & 2032
- Table 10: Global Casting Devices Industry Volume K Unit Forecast, by Country 2019 & 2032
- Table 11: United States Casting Devices Industry Revenue (Million) Forecast, by Application 2019 & 2032
- Table 12: United States Casting Devices Industry Volume (K Unit) Forecast, by Application 2019 & 2032
- Table 13: Canada Casting Devices Industry Revenue (Million) Forecast, by Application 2019 & 2032
- Table 14: Canada Casting Devices Industry Volume (K Unit) Forecast, by Application 2019 & 2032
- Table 15: Mexico Casting Devices Industry Revenue (Million) Forecast, by Application 2019 & 2032
- Table 16: Mexico Casting Devices Industry Volume (K Unit) Forecast, by Application 2019 & 2032
- Table 17: Global Casting Devices Industry Revenue Million Forecast, by Country 2019 & 2032
- Table 18: Global Casting Devices Industry Volume K Unit Forecast, by Country 2019 & 2032
- Table 19: Germany Casting Devices Industry Revenue (Million) Forecast, by Application 2019 & 2032
- Table 20: Germany Casting Devices Industry Volume (K Unit) Forecast, by Application 2019 & 2032
- Table 21: United Kingdom Casting Devices Industry Revenue (Million) Forecast, by Application 2019 & 2032
- Table 22: United Kingdom Casting Devices Industry Volume (K Unit) Forecast, by Application 2019 & 2032
- Table 23: France Casting Devices Industry Revenue (Million) Forecast, by Application 2019 & 2032
- Table 24: France Casting Devices Industry Volume (K Unit) Forecast, by Application 2019 & 2032
- Table 25: Spain Casting Devices Industry Revenue (Million) Forecast, by Application 2019 & 2032
- Table 26: Spain Casting Devices Industry Volume (K Unit) Forecast, by Application 2019 & 2032
- Table 27: Italy Casting Devices Industry Revenue (Million) Forecast, by Application 2019 & 2032
- Table 28: Italy Casting Devices Industry Volume (K Unit) Forecast, by Application 2019 & 2032
- Table 29: Spain Casting Devices Industry Revenue (Million) Forecast, by Application 2019 & 2032
- Table 30: Spain Casting Devices Industry Volume (K Unit) Forecast, by Application 2019 & 2032
- Table 31: Belgium Casting Devices Industry Revenue (Million) Forecast, by Application 2019 & 2032
- Table 32: Belgium Casting Devices Industry Volume (K Unit) Forecast, by Application 2019 & 2032
- Table 33: Netherland Casting Devices Industry Revenue (Million) Forecast, by Application 2019 & 2032
- Table 34: Netherland Casting Devices Industry Volume (K Unit) Forecast, by Application 2019 & 2032
- Table 35: Nordics Casting Devices Industry Revenue (Million) Forecast, by Application 2019 & 2032
- Table 36: Nordics Casting Devices Industry Volume (K Unit) Forecast, by Application 2019 & 2032
- Table 37: Rest of Europe Casting Devices Industry Revenue (Million) Forecast, by Application 2019 & 2032
- Table 38: Rest of Europe Casting Devices Industry Volume (K Unit) Forecast, by Application 2019 & 2032
- Table 39: Global Casting Devices Industry Revenue Million Forecast, by Country 2019 & 2032
- Table 40: Global Casting Devices Industry Volume K Unit Forecast, by Country 2019 & 2032
- Table 41: China Casting Devices Industry Revenue (Million) Forecast, by Application 2019 & 2032
- Table 42: China Casting Devices Industry Volume (K Unit) Forecast, by Application 2019 & 2032
- Table 43: Japan Casting Devices Industry Revenue (Million) Forecast, by Application 2019 & 2032
- Table 44: Japan Casting Devices Industry Volume (K Unit) Forecast, by Application 2019 & 2032
- Table 45: India Casting Devices Industry Revenue (Million) Forecast, by Application 2019 & 2032
- Table 46: India Casting Devices Industry Volume (K Unit) Forecast, by Application 2019 & 2032
- Table 47: South Korea Casting Devices Industry Revenue (Million) Forecast, by Application 2019 & 2032
- Table 48: South Korea Casting Devices Industry Volume (K Unit) Forecast, by Application 2019 & 2032
- Table 49: Southeast Asia Casting Devices Industry Revenue (Million) Forecast, by Application 2019 & 2032
- Table 50: Southeast Asia Casting Devices Industry Volume (K Unit) Forecast, by Application 2019 & 2032
- Table 51: Australia Casting Devices Industry Revenue (Million) Forecast, by Application 2019 & 2032
- Table 52: Australia Casting Devices Industry Volume (K Unit) Forecast, by Application 2019 & 2032
- Table 53: Indonesia Casting Devices Industry Revenue (Million) Forecast, by Application 2019 & 2032
- Table 54: Indonesia Casting Devices Industry Volume (K Unit) Forecast, by Application 2019 & 2032
- Table 55: Phillipes Casting Devices Industry Revenue (Million) Forecast, by Application 2019 & 2032
- Table 56: Phillipes Casting Devices Industry Volume (K Unit) Forecast, by Application 2019 & 2032
- Table 57: Singapore Casting Devices Industry Revenue (Million) Forecast, by Application 2019 & 2032
- Table 58: Singapore Casting Devices Industry Volume (K Unit) Forecast, by Application 2019 & 2032
- Table 59: Thailandc Casting Devices Industry Revenue (Million) Forecast, by Application 2019 & 2032
- Table 60: Thailandc Casting Devices Industry Volume (K Unit) Forecast, by Application 2019 & 2032
- Table 61: Rest of Asia Pacific Casting Devices Industry Revenue (Million) Forecast, by Application 2019 & 2032
- Table 62: Rest of Asia Pacific Casting Devices Industry Volume (K Unit) Forecast, by Application 2019 & 2032
- Table 63: Global Casting Devices Industry Revenue Million Forecast, by Country 2019 & 2032
- Table 64: Global Casting Devices Industry Volume K Unit Forecast, by Country 2019 & 2032
- Table 65: Brazil Casting Devices Industry Revenue (Million) Forecast, by Application 2019 & 2032
- Table 66: Brazil Casting Devices Industry Volume (K Unit) Forecast, by Application 2019 & 2032
- Table 67: Argentina Casting Devices Industry Revenue (Million) Forecast, by Application 2019 & 2032
- Table 68: Argentina Casting Devices Industry Volume (K Unit) Forecast, by Application 2019 & 2032
- Table 69: Peru Casting Devices Industry Revenue (Million) Forecast, by Application 2019 & 2032
- Table 70: Peru Casting Devices Industry Volume (K Unit) Forecast, by Application 2019 & 2032
- Table 71: Chile Casting Devices Industry Revenue (Million) Forecast, by Application 2019 & 2032
- Table 72: Chile Casting Devices Industry Volume (K Unit) Forecast, by Application 2019 & 2032
- Table 73: Colombia Casting Devices Industry Revenue (Million) Forecast, by Application 2019 & 2032
- Table 74: Colombia Casting Devices Industry Volume (K Unit) Forecast, by Application 2019 & 2032
- Table 75: Ecuador Casting Devices Industry Revenue (Million) Forecast, by Application 2019 & 2032
- Table 76: Ecuador Casting Devices Industry Volume (K Unit) Forecast, by Application 2019 & 2032
- Table 77: Venezuela Casting Devices Industry Revenue (Million) Forecast, by Application 2019 & 2032
- Table 78: Venezuela Casting Devices Industry Volume (K Unit) Forecast, by Application 2019 & 2032
- Table 79: Rest of South America Casting Devices Industry Revenue (Million) Forecast, by Application 2019 & 2032
- Table 80: Rest of South America Casting Devices Industry Volume (K Unit) Forecast, by Application 2019 & 2032
- Table 81: Global Casting Devices Industry Revenue Million Forecast, by Country 2019 & 2032
- Table 82: Global Casting Devices Industry Volume K Unit Forecast, by Country 2019 & 2032
- Table 83: United States Casting Devices Industry Revenue (Million) Forecast, by Application 2019 & 2032
- Table 84: United States Casting Devices Industry Volume (K Unit) Forecast, by Application 2019 & 2032
- Table 85: Canada Casting Devices Industry Revenue (Million) Forecast, by Application 2019 & 2032
- Table 86: Canada Casting Devices Industry Volume (K Unit) Forecast, by Application 2019 & 2032
- Table 87: Mexico Casting Devices Industry Revenue (Million) Forecast, by Application 2019 & 2032
- Table 88: Mexico Casting Devices Industry Volume (K Unit) Forecast, by Application 2019 & 2032
- Table 89: Global Casting Devices Industry Revenue Million Forecast, by Country 2019 & 2032
- Table 90: Global Casting Devices Industry Volume K Unit Forecast, by Country 2019 & 2032
- Table 91: United Arab Emirates Casting Devices Industry Revenue (Million) Forecast, by Application 2019 & 2032
- Table 92: United Arab Emirates Casting Devices Industry Volume (K Unit) Forecast, by Application 2019 & 2032
- Table 93: Saudi Arabia Casting Devices Industry Revenue (Million) Forecast, by Application 2019 & 2032
- Table 94: Saudi Arabia Casting Devices Industry Volume (K Unit) Forecast, by Application 2019 & 2032
- Table 95: South Africa Casting Devices Industry Revenue (Million) Forecast, by Application 2019 & 2032
- Table 96: South Africa Casting Devices Industry Volume (K Unit) Forecast, by Application 2019 & 2032
- Table 97: Rest of Middle East and Africa Casting Devices Industry Revenue (Million) Forecast, by Application 2019 & 2032
- Table 98: Rest of Middle East and Africa Casting Devices Industry Volume (K Unit) Forecast, by Application 2019 & 2032
- Table 99: Global Casting Devices Industry Revenue Million Forecast, by Type 2019 & 2032
- Table 100: Global Casting Devices Industry Volume K Unit Forecast, by Type 2019 & 2032
- Table 101: Global Casting Devices Industry Revenue Million Forecast, by End-User 2019 & 2032
- Table 102: Global Casting Devices Industry Volume K Unit Forecast, by End-User 2019 & 2032
- Table 103: Global Casting Devices Industry Revenue Million Forecast, by Country 2019 & 2032
- Table 104: Global Casting Devices Industry Volume K Unit Forecast, by Country 2019 & 2032
- Table 105: Global Casting Devices Industry Revenue Million Forecast, by Type 2019 & 2032
- Table 106: Global Casting Devices Industry Volume K Unit Forecast, by Type 2019 & 2032
- Table 107: Global Casting Devices Industry Revenue Million Forecast, by End-User 2019 & 2032
- Table 108: Global Casting Devices Industry Volume K Unit Forecast, by End-User 2019 & 2032
- Table 109: Global Casting Devices Industry Revenue Million Forecast, by Country 2019 & 2032
- Table 110: Global Casting Devices Industry Volume K Unit Forecast, by Country 2019 & 2032
- Table 111: Global Casting Devices Industry Revenue Million Forecast, by Type 2019 & 2032
- Table 112: Global Casting Devices Industry Volume K Unit Forecast, by Type 2019 & 2032
- Table 113: Global Casting Devices Industry Revenue Million Forecast, by End-User 2019 & 2032
- Table 114: Global Casting Devices Industry Volume K Unit Forecast, by End-User 2019 & 2032
- Table 115: Global Casting Devices Industry Revenue Million Forecast, by Country 2019 & 2032
- Table 116: Global Casting Devices Industry Volume K Unit Forecast, by Country 2019 & 2032
- Table 117: Global Casting Devices Industry Revenue Million Forecast, by Type 2019 & 2032
- Table 118: Global Casting Devices Industry Volume K Unit Forecast, by Type 2019 & 2032
- Table 119: Global Casting Devices Industry Revenue Million Forecast, by End-User 2019 & 2032
- Table 120: Global Casting Devices Industry Volume K Unit Forecast, by End-User 2019 & 2032
- Table 121: Global Casting Devices Industry Revenue Million Forecast, by Country 2019 & 2032
- Table 122: Global Casting Devices Industry Volume K Unit Forecast, by Country 2019 & 2032
Frequently Asked Questions
1. What is the projected Compound Annual Growth Rate (CAGR) of the Casting Devices Industry?
The projected CAGR is approximately 16.40%.
2. Which companies are prominent players in the Casting Devices Industry?
Key companies in the market include LG Electronics Inc, Anycast, Hisense Co Ltd, Samsung Electronics Co Ltd, Mirascreen, Microsoft Corporation, Amazon com Inc , Airtame ApS, Roku Inc, Nvidia Corporation, Google Inc, Apple Inc, EZCast.
3. What are the main segments of the Casting Devices Industry?
The market segments include Type, End-User.
4. Can you provide details about the market size?
The market size is estimated to be USD XX Million as of 2022.
5. What are some drivers contributing to market growth?
; Growing Consumption of Video-on-Demand (VoD) Services; Increasing Adoption of Casting Devices with Changing Consumer Behavior.
6. What are the notable trends driving market growth?
Smart TV Segment is expected to occupy a Significant Market Share during the Forecast Period.
7. Are there any restraints impacting market growth?
; Increasing Availability of Native Smart TV Apps.
8. Can you provide examples of recent developments in the market?
N/A
9. What pricing options are available for accessing the report?
Pricing options include single-user, multi-user, and enterprise licenses priced at USD 4750, USD 5250, and USD 8750 respectively.
10. Is the market size provided in terms of value or volume?
The market size is provided in terms of value, measured in Million and volume, measured in K Unit.
11. Are there any specific market keywords associated with the report?
Yes, the market keyword associated with the report is "Casting Devices Industry," which aids in identifying and referencing the specific market segment covered.
12. How do I determine which pricing option suits my needs best?
The pricing options vary based on user requirements and access needs. Individual users may opt for single-user licenses, while businesses requiring broader access may choose multi-user or enterprise licenses for cost-effective access to the report.
13. Are there any additional resources or data provided in the Casting Devices Industry report?
While the report offers comprehensive insights, it's advisable to review the specific contents or supplementary materials provided to ascertain if additional resources or data are available.
14. How can I stay updated on further developments or reports in the Casting Devices Industry?
To stay informed about further developments, trends, and reports in the Casting Devices Industry, consider subscribing to industry newsletters, following relevant companies and organizations, or regularly checking reputable industry news sources and publications.
Methodology
Step 1 - Identification of Relevant Samples Size from Population Database


Step 2 - Approaches for Defining Global Market Size (Value, Volume* & Price*)

Note*: In applicable scenarios
Step 3 - Data Sources
Primary Research
- Web Analytics
- Survey Reports
- Research Institute
- Latest Research Reports
- Opinion Leaders
Secondary Research
- Annual Reports
- White Paper
- Latest Press Release
- Industry Association
- Paid Database
- Investor Presentations

Step 4 - Data Triangulation
Involves using different sources of information in order to increase the validity of a study
These sources are likely to be stakeholders in a program - participants, other researchers, program staff, other community members, and so on.
Then we put all data in single framework & apply various statistical tools to find out the dynamic on the market.
During the analysis stage, feedback from the stakeholder groups would be compared to determine areas of agreement as well as areas of divergence


