
Key Insights
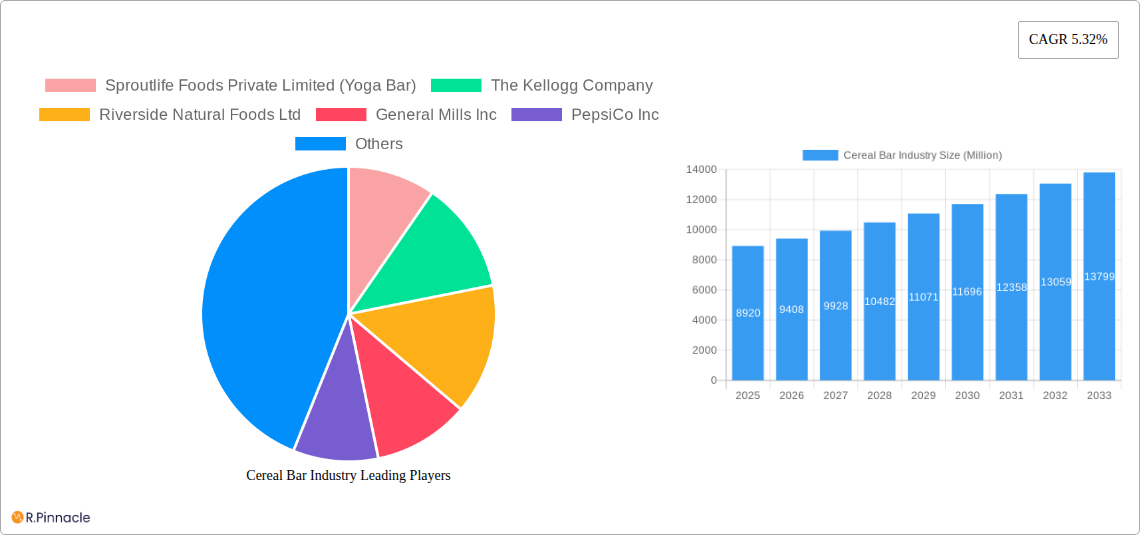
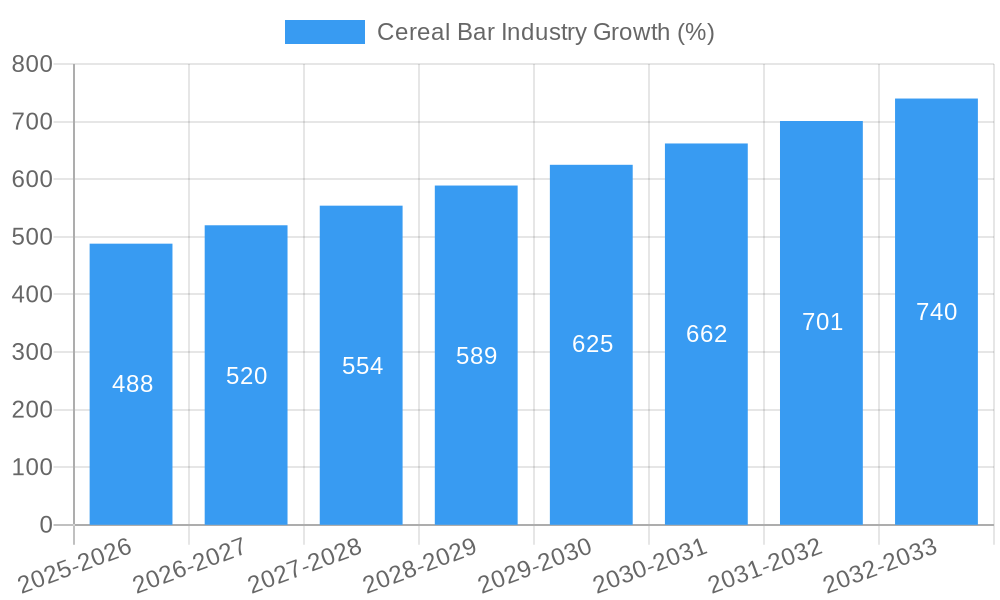
The global cereal bar market, valued at $8.92 billion in 2025, is projected to experience robust growth, exhibiting a compound annual growth rate (CAGR) of 5.32% from 2025 to 2033. This expansion is driven by several key factors. The rising prevalence of health-conscious consumers seeking convenient and nutritious on-the-go snacks fuels demand for cereal bars, particularly granola and muesli varieties. The increasing popularity of plant-based diets and the growing awareness of the importance of fiber intake further bolster market growth. Strategic product innovation, including the introduction of bars with added protein, functional ingredients, and diverse flavor profiles, caters to evolving consumer preferences and expands market reach. Furthermore, the expansion of online retail channels provides convenient access to a wider range of cereal bar options, contributing to market growth. Major players like Kellogg's, General Mills, and PepsiCo are leveraging their established distribution networks and brand recognition to maintain a strong market presence.
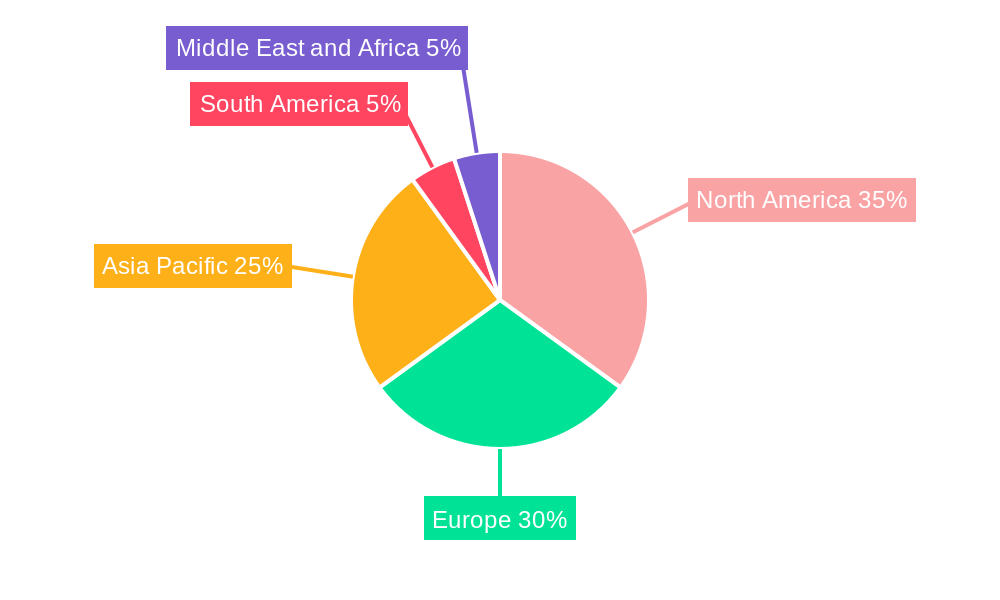
However, certain challenges could potentially temper growth. Fluctuations in raw material prices, such as grains and nuts, can impact production costs and profitability. Increasing competition from alternative snack options, including protein bars and energy bars, necessitates continuous innovation and differentiation to maintain market share. Stringent regulatory frameworks concerning food labeling and ingredient standards also pose challenges for manufacturers. Geographic variations in consumer preferences and purchasing power influence regional market growth, with North America and Europe currently dominating market share. The Asia-Pacific region, however, is anticipated to experience significant growth driven by rising disposable incomes and changing lifestyles. Strategic partnerships, expansion into emerging markets, and targeted marketing campaigns focusing on health benefits and convenience are crucial for sustained growth in the cereal bar industry.
Cereal Bar Industry Report: A Comprehensive Market Analysis (2019-2033)
This comprehensive report provides a detailed analysis of the global Cereal Bar industry, offering invaluable insights for industry professionals, investors, and strategic decision-makers. The report covers the period 2019-2033, with a base year of 2025 and a forecast period of 2025-2033. The market is projected to reach xx Million by 2033, showcasing significant growth opportunities. Key players like Kellogg's, General Mills, and Mars Incorporated are analyzed alongside emerging brands, providing a complete picture of the competitive landscape. This report is essential for navigating the dynamic Cereal Bar market and making informed decisions.
Cereal Bar Industry Market Structure & Innovation Trends
This section analyzes the competitive landscape of the Cereal Bar industry, including market concentration, innovation drivers, and regulatory influences. The industry exhibits a moderately concentrated structure, with key players like Kellogg's, General Mills, and Mars Incorporated holding significant market share. However, numerous smaller players and niche brands contribute to the overall market dynamics.
- Market Concentration: The top 5 players hold approximately xx% of the global market share in 2025 (estimated). Smaller players focus on specialized offerings, such as organic or gluten-free bars.
- Innovation Drivers: Key drivers include increasing consumer demand for healthy and convenient snacks, growing awareness of health and wellness, and the rising popularity of on-the-go consumption patterns. Innovation focuses on novel flavors, functional ingredients (e.g., protein, fiber), and sustainable packaging.
- Regulatory Frameworks: Government regulations regarding food labeling, ingredients, and health claims significantly impact product development and marketing strategies. These regulations vary across different regions, creating complexities for global players.
- Product Substitutes: Other snack categories, such as energy bars, protein bars, and fruit snacks, compete for consumer attention, influencing market dynamics.
- End-User Demographics: The target audience for cereal bars spans across age groups and lifestyles, with a significant focus on health-conscious consumers, active individuals, and busy professionals.
- M&A Activities: The Cereal Bar industry has witnessed significant M&A activity in recent years, with deal values reaching xx Million in 2024 (estimated). These activities aim to expand market reach, diversify product portfolios, and enhance technological capabilities.
Cereal Bar Industry Market Dynamics & Trends
This section delves into the market's growth drivers, technological advancements, consumer preferences, and competitive dynamics. The global Cereal Bar market is experiencing robust growth, driven by factors like increasing disposable incomes, changing lifestyles, and evolving consumer preferences.
The CAGR for the global Cereal Bar market is projected to be xx% during the forecast period (2025-2033). Market penetration is high in developed countries, with significant growth potential in emerging economies. Key growth drivers include:
- Health and Wellness: Growing consumer demand for healthier snack options with added nutrients and reduced sugar content.
- Convenience: Cereal bars are perceived as convenient, on-the-go snacks, appealing to busy lifestyles.
- Product Innovation: Introduction of new flavors, ingredients, and functional benefits continually caters to evolving consumer preferences.
- Technological Advancements: Automation in manufacturing, improved packaging solutions, and e-commerce platforms enhance efficiency and market reach.
- Competitive Dynamics: Intense competition among established players and emerging brands fuels innovation and product diversification.
Dominant Regions & Segments in Cereal Bar Industry
This section identifies the leading regions and segments within the Cereal Bar market. North America currently dominates the global market, followed by Europe and Asia Pacific.
By Product Type:
- Granola/Muesli Bars: This segment holds the largest market share due to its traditional appeal and versatility. Growth is driven by demand for healthier and natural options.
- Other Bars: This segment encompasses various specialty bars, including protein bars, energy bars, and other functional bars. Growth is driven by increasing health consciousness and diverse dietary needs.
By Distribution Channel:
- Supermarkets/Hypermarkets: This channel dominates distribution, providing broad reach and established retail infrastructure.
- Convenience Stores: This channel is growing rapidly due to its convenience and widespread presence.
- Online Retail Stores: E-commerce platforms are gaining traction, offering increased reach and convenience.
Key Drivers: Economic growth, changing lifestyles, rising disposable incomes, and the increasing availability of supermarkets and convenience stores.
Cereal Bar Industry Product Innovations
Recent innovations focus on healthier formulations, functional benefits, and sustainable packaging. Manufacturers are incorporating ingredients like protein, fiber, and probiotics to enhance nutritional value, while also focusing on reduced sugar and improved taste profiles. Sustainable packaging solutions, such as recyclable materials and reduced packaging size, are gaining prominence, responding to growing environmental concerns.
Report Scope & Segmentation Analysis
This report segments the Cereal Bar market by product type (Granola/Muesli Bars, Other Bars) and distribution channel (Convenience Stores, Supermarkets/Hypermarkets, Specialty Stores, Online Retail Stores, Other Distribution Channels). Each segment’s growth is analyzed, along with competitive dynamics and market size projections. For example, the Granola/Muesli bar segment is anticipated to experience a CAGR of xx% during the forecast period, driven by its appeal to health-conscious consumers.
Key Drivers of Cereal Bar Industry Growth
The Cereal Bar industry’s growth is propelled by several factors, including:
- Rising health consciousness: Consumers increasingly prioritize healthier snack options.
- Busy lifestyles: Convenient and portable nature fuels demand.
- Product diversification: New flavors, ingredients, and functional benefits expand market appeal.
- Technological advancements: Improved production efficiency and e-commerce boost distribution.
Challenges in the Cereal Bar Industry Sector
The industry faces challenges such as:
- Intense competition: Established and emerging players vie for market share.
- Fluctuating raw material prices: Impacts production costs and profitability.
- Health and wellness regulations: Compliance requirements vary across regions, posing complexities.
Emerging Opportunities in Cereal Bar Industry
Opportunities exist in:
- Expansion into emerging markets: Untapped potential in developing economies.
- Development of premium and specialized products: Catering to niche consumer preferences.
- Sustainable and eco-friendly packaging: Addressing growing environmental concerns.
Leading Players in the Cereal Bar Industry Market
- The Kellogg Company
- General Mills Inc
- PepsiCo Inc
- Associated British Foods PLC
- Mars Incorporated
- Mondelēz International Inc
- NuGo Nutrition
- McKee Foods Corporation
- Sproutlife Foods Private Limited (Yoga Bar)
- Riverside Natural Foods Ltd
Key Developments in Cereal Bar Industry Industry
- January 2024: Mars China launched a SNICKERS bar with dark chocolate cereal, featuring sustainable mono-PP packaging.
- January 2024: McKee Foods introduced Sunbelt Bakery chewy granola bars in three flavors for the vending industry.
- March 2024: World of Sweets partnered with Mondelez International to expand the Clif brand's retail presence.
Future Outlook for Cereal Bar Industry Market
The Cereal Bar market exhibits strong growth potential, driven by ongoing product innovation, expanding distribution channels, and rising consumer demand for convenient and healthy snack options. Strategic partnerships, focus on sustainable practices, and targeted product development will be key to success in the coming years. The market is poised for continued expansion, particularly in emerging markets and with the rise of innovative product formats and functional ingredients.
Cereal Bar Industry Segmentation
-
1. Product Type
- 1.1. Granola/Muesli Bars
- 1.2. Other Bars
-
2. Distribution Channel
- 2.1. Convenience Stores
- 2.2. Supermarkets/Hypermarkets
- 2.3. Specialty Stores
- 2.4. Online Retail Stores
- 2.5. Other Distribution Channels
Cereal Bar Industry Segmentation By Geography
-
1. North America
- 1.1. United States
- 1.2. Canada
- 1.3. Mexico
- 1.4. Rest of North America
-
2. Europe
- 2.1. Spain
- 2.2. United Kingdom
- 2.3. Germany
- 2.4. France
- 2.5. Italy
- 2.6. Netherlands
- 2.7. Rest of Europe
-
3. Asia Pacific
- 3.1. China
- 3.2. Japan
- 3.3. India
- 3.4. Australia
- 3.5. Rest of Asia Pacific
-
4. South America
- 4.1. Brazil
- 4.2. Argentina
- 4.3. Rest of South America
-
5. Middle East and Africa
- 5.1. South Africa
- 5.2. United Arab Emirates
- 5.3. Rest of Middle East and Africa
Cereal Bar Industry REPORT HIGHLIGHTS
| Aspects | Details |
|---|---|
| Study Period | 2019-2033 |
| Base Year | 2024 |
| Estimated Year | 2025 |
| Forecast Period | 2025-2033 |
| Historical Period | 2019-2024 |
| Growth Rate | CAGR of 5.32% from 2019-2033 |
| Segmentation |
|
Table of Contents
- 1. Introduction
- 1.1. Research Scope
- 1.2. Market Segmentation
- 1.3. Research Methodology
- 1.4. Definitions and Assumptions
- 2. Executive Summary
- 2.1. Introduction
- 3. Market Dynamics
- 3.1. Introduction
- 3.2. Market Drivers
- 3.2.1. Popularity of On-the-Go Snacking Options; Trend Of Clean Label and Plant-Based Bars
- 3.3. Market Restrains
- 3.3.1. Availability of Counterfeit Products
- 3.4. Market Trends
- 3.4.1. Rising Demand for On-the-go and Small-portion Snacking
- 4. Market Factor Analysis
- 4.1. Porters Five Forces
- 4.2. Supply/Value Chain
- 4.3. PESTEL analysis
- 4.4. Market Entropy
- 4.5. Patent/Trademark Analysis
- 5. Global Cereal Bar Industry Analysis, Insights and Forecast, 2019-2031
- 5.1. Market Analysis, Insights and Forecast - by Product Type
- 5.1.1. Granola/Muesli Bars
- 5.1.2. Other Bars
- 5.2. Market Analysis, Insights and Forecast - by Distribution Channel
- 5.2.1. Convenience Stores
- 5.2.2. Supermarkets/Hypermarkets
- 5.2.3. Specialty Stores
- 5.2.4. Online Retail Stores
- 5.2.5. Other Distribution Channels
- 5.3. Market Analysis, Insights and Forecast - by Region
- 5.3.1. North America
- 5.3.2. Europe
- 5.3.3. Asia Pacific
- 5.3.4. South America
- 5.3.5. Middle East and Africa
- 5.1. Market Analysis, Insights and Forecast - by Product Type
- 6. North America Cereal Bar Industry Analysis, Insights and Forecast, 2019-2031
- 6.1. Market Analysis, Insights and Forecast - by Product Type
- 6.1.1. Granola/Muesli Bars
- 6.1.2. Other Bars
- 6.2. Market Analysis, Insights and Forecast - by Distribution Channel
- 6.2.1. Convenience Stores
- 6.2.2. Supermarkets/Hypermarkets
- 6.2.3. Specialty Stores
- 6.2.4. Online Retail Stores
- 6.2.5. Other Distribution Channels
- 6.1. Market Analysis, Insights and Forecast - by Product Type
- 7. Europe Cereal Bar Industry Analysis, Insights and Forecast, 2019-2031
- 7.1. Market Analysis, Insights and Forecast - by Product Type
- 7.1.1. Granola/Muesli Bars
- 7.1.2. Other Bars
- 7.2. Market Analysis, Insights and Forecast - by Distribution Channel
- 7.2.1. Convenience Stores
- 7.2.2. Supermarkets/Hypermarkets
- 7.2.3. Specialty Stores
- 7.2.4. Online Retail Stores
- 7.2.5. Other Distribution Channels
- 7.1. Market Analysis, Insights and Forecast - by Product Type
- 8. Asia Pacific Cereal Bar Industry Analysis, Insights and Forecast, 2019-2031
- 8.1. Market Analysis, Insights and Forecast - by Product Type
- 8.1.1. Granola/Muesli Bars
- 8.1.2. Other Bars
- 8.2. Market Analysis, Insights and Forecast - by Distribution Channel
- 8.2.1. Convenience Stores
- 8.2.2. Supermarkets/Hypermarkets
- 8.2.3. Specialty Stores
- 8.2.4. Online Retail Stores
- 8.2.5. Other Distribution Channels
- 8.1. Market Analysis, Insights and Forecast - by Product Type
- 9. South America Cereal Bar Industry Analysis, Insights and Forecast, 2019-2031
- 9.1. Market Analysis, Insights and Forecast - by Product Type
- 9.1.1. Granola/Muesli Bars
- 9.1.2. Other Bars
- 9.2. Market Analysis, Insights and Forecast - by Distribution Channel
- 9.2.1. Convenience Stores
- 9.2.2. Supermarkets/Hypermarkets
- 9.2.3. Specialty Stores
- 9.2.4. Online Retail Stores
- 9.2.5. Other Distribution Channels
- 9.1. Market Analysis, Insights and Forecast - by Product Type
- 10. Middle East and Africa Cereal Bar Industry Analysis, Insights and Forecast, 2019-2031
- 10.1. Market Analysis, Insights and Forecast - by Product Type
- 10.1.1. Granola/Muesli Bars
- 10.1.2. Other Bars
- 10.2. Market Analysis, Insights and Forecast - by Distribution Channel
- 10.2.1. Convenience Stores
- 10.2.2. Supermarkets/Hypermarkets
- 10.2.3. Specialty Stores
- 10.2.4. Online Retail Stores
- 10.2.5. Other Distribution Channels
- 10.1. Market Analysis, Insights and Forecast - by Product Type
- 11. North America Cereal Bar Industry Analysis, Insights and Forecast, 2019-2031
- 11.1. Market Analysis, Insights and Forecast - By Country/Sub-region
- 11.1.1 United States
- 11.1.2 Canada
- 11.1.3 Mexico
- 11.1.4 Rest of North America
- 12. Europe Cereal Bar Industry Analysis, Insights and Forecast, 2019-2031
- 12.1. Market Analysis, Insights and Forecast - By Country/Sub-region
- 12.1.1 Spain
- 12.1.2 United Kingdom
- 12.1.3 Germany
- 12.1.4 France
- 12.1.5 Italy
- 12.1.6 Netherlands
- 12.1.7 Rest of Europe
- 13. Asia Pacific Cereal Bar Industry Analysis, Insights and Forecast, 2019-2031
- 13.1. Market Analysis, Insights and Forecast - By Country/Sub-region
- 13.1.1 China
- 13.1.2 Japan
- 13.1.3 India
- 13.1.4 Australia
- 13.1.5 Rest of Asia Pacific
- 14. South America Cereal Bar Industry Analysis, Insights and Forecast, 2019-2031
- 14.1. Market Analysis, Insights and Forecast - By Country/Sub-region
- 14.1.1 Brazil
- 14.1.2 Argentina
- 14.1.3 Rest of South America
- 15. Middle East and Africa Cereal Bar Industry Analysis, Insights and Forecast, 2019-2031
- 15.1. Market Analysis, Insights and Forecast - By Country/Sub-region
- 15.1.1 South Africa
- 15.1.2 United Arab Emirates
- 15.1.3 Rest of Middle East and Africa
- 16. Competitive Analysis
- 16.1. Global Market Share Analysis 2024
- 16.2. Company Profiles
- 16.2.1 Sproutlife Foods Private Limited (Yoga Bar)
- 16.2.1.1. Overview
- 16.2.1.2. Products
- 16.2.1.3. SWOT Analysis
- 16.2.1.4. Recent Developments
- 16.2.1.5. Financials (Based on Availability)
- 16.2.2 The Kellogg Company
- 16.2.2.1. Overview
- 16.2.2.2. Products
- 16.2.2.3. SWOT Analysis
- 16.2.2.4. Recent Developments
- 16.2.2.5. Financials (Based on Availability)
- 16.2.3 Riverside Natural Foods Ltd
- 16.2.3.1. Overview
- 16.2.3.2. Products
- 16.2.3.3. SWOT Analysis
- 16.2.3.4. Recent Developments
- 16.2.3.5. Financials (Based on Availability)
- 16.2.4 General Mills Inc
- 16.2.4.1. Overview
- 16.2.4.2. Products
- 16.2.4.3. SWOT Analysis
- 16.2.4.4. Recent Developments
- 16.2.4.5. Financials (Based on Availability)
- 16.2.5 PepsiCo Inc
- 16.2.5.1. Overview
- 16.2.5.2. Products
- 16.2.5.3. SWOT Analysis
- 16.2.5.4. Recent Developments
- 16.2.5.5. Financials (Based on Availability)
- 16.2.6 Associated British Foods PLC*List Not Exhaustive
- 16.2.6.1. Overview
- 16.2.6.2. Products
- 16.2.6.3. SWOT Analysis
- 16.2.6.4. Recent Developments
- 16.2.6.5. Financials (Based on Availability)
- 16.2.7 Mars Incorporated
- 16.2.7.1. Overview
- 16.2.7.2. Products
- 16.2.7.3. SWOT Analysis
- 16.2.7.4. Recent Developments
- 16.2.7.5. Financials (Based on Availability)
- 16.2.8 Mondelēz International Inc
- 16.2.8.1. Overview
- 16.2.8.2. Products
- 16.2.8.3. SWOT Analysis
- 16.2.8.4. Recent Developments
- 16.2.8.5. Financials (Based on Availability)
- 16.2.9 NuGo Nutrition
- 16.2.9.1. Overview
- 16.2.9.2. Products
- 16.2.9.3. SWOT Analysis
- 16.2.9.4. Recent Developments
- 16.2.9.5. Financials (Based on Availability)
- 16.2.10 McKee Foods Corporation
- 16.2.10.1. Overview
- 16.2.10.2. Products
- 16.2.10.3. SWOT Analysis
- 16.2.10.4. Recent Developments
- 16.2.10.5. Financials (Based on Availability)
- 16.2.1 Sproutlife Foods Private Limited (Yoga Bar)
List of Figures
- Figure 1: Global Cereal Bar Industry Revenue Breakdown (Million, %) by Region 2024 & 2032
- Figure 2: North America Cereal Bar Industry Revenue (Million), by Country 2024 & 2032
- Figure 3: North America Cereal Bar Industry Revenue Share (%), by Country 2024 & 2032
- Figure 4: Europe Cereal Bar Industry Revenue (Million), by Country 2024 & 2032
- Figure 5: Europe Cereal Bar Industry Revenue Share (%), by Country 2024 & 2032
- Figure 6: Asia Pacific Cereal Bar Industry Revenue (Million), by Country 2024 & 2032
- Figure 7: Asia Pacific Cereal Bar Industry Revenue Share (%), by Country 2024 & 2032
- Figure 8: South America Cereal Bar Industry Revenue (Million), by Country 2024 & 2032
- Figure 9: South America Cereal Bar Industry Revenue Share (%), by Country 2024 & 2032
- Figure 10: Middle East and Africa Cereal Bar Industry Revenue (Million), by Country 2024 & 2032
- Figure 11: Middle East and Africa Cereal Bar Industry Revenue Share (%), by Country 2024 & 2032
- Figure 12: North America Cereal Bar Industry Revenue (Million), by Product Type 2024 & 2032
- Figure 13: North America Cereal Bar Industry Revenue Share (%), by Product Type 2024 & 2032
- Figure 14: North America Cereal Bar Industry Revenue (Million), by Distribution Channel 2024 & 2032
- Figure 15: North America Cereal Bar Industry Revenue Share (%), by Distribution Channel 2024 & 2032
- Figure 16: North America Cereal Bar Industry Revenue (Million), by Country 2024 & 2032
- Figure 17: North America Cereal Bar Industry Revenue Share (%), by Country 2024 & 2032
- Figure 18: Europe Cereal Bar Industry Revenue (Million), by Product Type 2024 & 2032
- Figure 19: Europe Cereal Bar Industry Revenue Share (%), by Product Type 2024 & 2032
- Figure 20: Europe Cereal Bar Industry Revenue (Million), by Distribution Channel 2024 & 2032
- Figure 21: Europe Cereal Bar Industry Revenue Share (%), by Distribution Channel 2024 & 2032
- Figure 22: Europe Cereal Bar Industry Revenue (Million), by Country 2024 & 2032
- Figure 23: Europe Cereal Bar Industry Revenue Share (%), by Country 2024 & 2032
- Figure 24: Asia Pacific Cereal Bar Industry Revenue (Million), by Product Type 2024 & 2032
- Figure 25: Asia Pacific Cereal Bar Industry Revenue Share (%), by Product Type 2024 & 2032
- Figure 26: Asia Pacific Cereal Bar Industry Revenue (Million), by Distribution Channel 2024 & 2032
- Figure 27: Asia Pacific Cereal Bar Industry Revenue Share (%), by Distribution Channel 2024 & 2032
- Figure 28: Asia Pacific Cereal Bar Industry Revenue (Million), by Country 2024 & 2032
- Figure 29: Asia Pacific Cereal Bar Industry Revenue Share (%), by Country 2024 & 2032
- Figure 30: South America Cereal Bar Industry Revenue (Million), by Product Type 2024 & 2032
- Figure 31: South America Cereal Bar Industry Revenue Share (%), by Product Type 2024 & 2032
- Figure 32: South America Cereal Bar Industry Revenue (Million), by Distribution Channel 2024 & 2032
- Figure 33: South America Cereal Bar Industry Revenue Share (%), by Distribution Channel 2024 & 2032
- Figure 34: South America Cereal Bar Industry Revenue (Million), by Country 2024 & 2032
- Figure 35: South America Cereal Bar Industry Revenue Share (%), by Country 2024 & 2032
- Figure 36: Middle East and Africa Cereal Bar Industry Revenue (Million), by Product Type 2024 & 2032
- Figure 37: Middle East and Africa Cereal Bar Industry Revenue Share (%), by Product Type 2024 & 2032
- Figure 38: Middle East and Africa Cereal Bar Industry Revenue (Million), by Distribution Channel 2024 & 2032
- Figure 39: Middle East and Africa Cereal Bar Industry Revenue Share (%), by Distribution Channel 2024 & 2032
- Figure 40: Middle East and Africa Cereal Bar Industry Revenue (Million), by Country 2024 & 2032
- Figure 41: Middle East and Africa Cereal Bar Industry Revenue Share (%), by Country 2024 & 2032
List of Tables
- Table 1: Global Cereal Bar Industry Revenue Million Forecast, by Region 2019 & 2032
- Table 2: Global Cereal Bar Industry Revenue Million Forecast, by Product Type 2019 & 2032
- Table 3: Global Cereal Bar Industry Revenue Million Forecast, by Distribution Channel 2019 & 2032
- Table 4: Global Cereal Bar Industry Revenue Million Forecast, by Region 2019 & 2032
- Table 5: Global Cereal Bar Industry Revenue Million Forecast, by Country 2019 & 2032
- Table 6: United States Cereal Bar Industry Revenue (Million) Forecast, by Application 2019 & 2032
- Table 7: Canada Cereal Bar Industry Revenue (Million) Forecast, by Application 2019 & 2032
- Table 8: Mexico Cereal Bar Industry Revenue (Million) Forecast, by Application 2019 & 2032
- Table 9: Rest of North America Cereal Bar Industry Revenue (Million) Forecast, by Application 2019 & 2032
- Table 10: Global Cereal Bar Industry Revenue Million Forecast, by Country 2019 & 2032
- Table 11: Spain Cereal Bar Industry Revenue (Million) Forecast, by Application 2019 & 2032
- Table 12: United Kingdom Cereal Bar Industry Revenue (Million) Forecast, by Application 2019 & 2032
- Table 13: Germany Cereal Bar Industry Revenue (Million) Forecast, by Application 2019 & 2032
- Table 14: France Cereal Bar Industry Revenue (Million) Forecast, by Application 2019 & 2032
- Table 15: Italy Cereal Bar Industry Revenue (Million) Forecast, by Application 2019 & 2032
- Table 16: Netherlands Cereal Bar Industry Revenue (Million) Forecast, by Application 2019 & 2032
- Table 17: Rest of Europe Cereal Bar Industry Revenue (Million) Forecast, by Application 2019 & 2032
- Table 18: Global Cereal Bar Industry Revenue Million Forecast, by Country 2019 & 2032
- Table 19: China Cereal Bar Industry Revenue (Million) Forecast, by Application 2019 & 2032
- Table 20: Japan Cereal Bar Industry Revenue (Million) Forecast, by Application 2019 & 2032
- Table 21: India Cereal Bar Industry Revenue (Million) Forecast, by Application 2019 & 2032
- Table 22: Australia Cereal Bar Industry Revenue (Million) Forecast, by Application 2019 & 2032
- Table 23: Rest of Asia Pacific Cereal Bar Industry Revenue (Million) Forecast, by Application 2019 & 2032
- Table 24: Global Cereal Bar Industry Revenue Million Forecast, by Country 2019 & 2032
- Table 25: Brazil Cereal Bar Industry Revenue (Million) Forecast, by Application 2019 & 2032
- Table 26: Argentina Cereal Bar Industry Revenue (Million) Forecast, by Application 2019 & 2032
- Table 27: Rest of South America Cereal Bar Industry Revenue (Million) Forecast, by Application 2019 & 2032
- Table 28: Global Cereal Bar Industry Revenue Million Forecast, by Country 2019 & 2032
- Table 29: South Africa Cereal Bar Industry Revenue (Million) Forecast, by Application 2019 & 2032
- Table 30: United Arab Emirates Cereal Bar Industry Revenue (Million) Forecast, by Application 2019 & 2032
- Table 31: Rest of Middle East and Africa Cereal Bar Industry Revenue (Million) Forecast, by Application 2019 & 2032
- Table 32: Global Cereal Bar Industry Revenue Million Forecast, by Product Type 2019 & 2032
- Table 33: Global Cereal Bar Industry Revenue Million Forecast, by Distribution Channel 2019 & 2032
- Table 34: Global Cereal Bar Industry Revenue Million Forecast, by Country 2019 & 2032
- Table 35: United States Cereal Bar Industry Revenue (Million) Forecast, by Application 2019 & 2032
- Table 36: Canada Cereal Bar Industry Revenue (Million) Forecast, by Application 2019 & 2032
- Table 37: Mexico Cereal Bar Industry Revenue (Million) Forecast, by Application 2019 & 2032
- Table 38: Rest of North America Cereal Bar Industry Revenue (Million) Forecast, by Application 2019 & 2032
- Table 39: Global Cereal Bar Industry Revenue Million Forecast, by Product Type 2019 & 2032
- Table 40: Global Cereal Bar Industry Revenue Million Forecast, by Distribution Channel 2019 & 2032
- Table 41: Global Cereal Bar Industry Revenue Million Forecast, by Country 2019 & 2032
- Table 42: Spain Cereal Bar Industry Revenue (Million) Forecast, by Application 2019 & 2032
- Table 43: United Kingdom Cereal Bar Industry Revenue (Million) Forecast, by Application 2019 & 2032
- Table 44: Germany Cereal Bar Industry Revenue (Million) Forecast, by Application 2019 & 2032
- Table 45: France Cereal Bar Industry Revenue (Million) Forecast, by Application 2019 & 2032
- Table 46: Italy Cereal Bar Industry Revenue (Million) Forecast, by Application 2019 & 2032
- Table 47: Netherlands Cereal Bar Industry Revenue (Million) Forecast, by Application 2019 & 2032
- Table 48: Rest of Europe Cereal Bar Industry Revenue (Million) Forecast, by Application 2019 & 2032
- Table 49: Global Cereal Bar Industry Revenue Million Forecast, by Product Type 2019 & 2032
- Table 50: Global Cereal Bar Industry Revenue Million Forecast, by Distribution Channel 2019 & 2032
- Table 51: Global Cereal Bar Industry Revenue Million Forecast, by Country 2019 & 2032
- Table 52: China Cereal Bar Industry Revenue (Million) Forecast, by Application 2019 & 2032
- Table 53: Japan Cereal Bar Industry Revenue (Million) Forecast, by Application 2019 & 2032
- Table 54: India Cereal Bar Industry Revenue (Million) Forecast, by Application 2019 & 2032
- Table 55: Australia Cereal Bar Industry Revenue (Million) Forecast, by Application 2019 & 2032
- Table 56: Rest of Asia Pacific Cereal Bar Industry Revenue (Million) Forecast, by Application 2019 & 2032
- Table 57: Global Cereal Bar Industry Revenue Million Forecast, by Product Type 2019 & 2032
- Table 58: Global Cereal Bar Industry Revenue Million Forecast, by Distribution Channel 2019 & 2032
- Table 59: Global Cereal Bar Industry Revenue Million Forecast, by Country 2019 & 2032
- Table 60: Brazil Cereal Bar Industry Revenue (Million) Forecast, by Application 2019 & 2032
- Table 61: Argentina Cereal Bar Industry Revenue (Million) Forecast, by Application 2019 & 2032
- Table 62: Rest of South America Cereal Bar Industry Revenue (Million) Forecast, by Application 2019 & 2032
- Table 63: Global Cereal Bar Industry Revenue Million Forecast, by Product Type 2019 & 2032
- Table 64: Global Cereal Bar Industry Revenue Million Forecast, by Distribution Channel 2019 & 2032
- Table 65: Global Cereal Bar Industry Revenue Million Forecast, by Country 2019 & 2032
- Table 66: South Africa Cereal Bar Industry Revenue (Million) Forecast, by Application 2019 & 2032
- Table 67: United Arab Emirates Cereal Bar Industry Revenue (Million) Forecast, by Application 2019 & 2032
- Table 68: Rest of Middle East and Africa Cereal Bar Industry Revenue (Million) Forecast, by Application 2019 & 2032
Frequently Asked Questions
1. What is the projected Compound Annual Growth Rate (CAGR) of the Cereal Bar Industry?
The projected CAGR is approximately 5.32%.
2. Which companies are prominent players in the Cereal Bar Industry?
Key companies in the market include Sproutlife Foods Private Limited (Yoga Bar), The Kellogg Company, Riverside Natural Foods Ltd, General Mills Inc, PepsiCo Inc, Associated British Foods PLC*List Not Exhaustive, Mars Incorporated, Mondelēz International Inc, NuGo Nutrition, McKee Foods Corporation.
3. What are the main segments of the Cereal Bar Industry?
The market segments include Product Type, Distribution Channel.
4. Can you provide details about the market size?
The market size is estimated to be USD 8.92 Million as of 2022.
5. What are some drivers contributing to market growth?
Popularity of On-the-Go Snacking Options; Trend Of Clean Label and Plant-Based Bars.
6. What are the notable trends driving market growth?
Rising Demand for On-the-go and Small-portion Snacking.
7. Are there any restraints impacting market growth?
Availability of Counterfeit Products.
8. Can you provide examples of recent developments in the market?
March 2024: World of Sweets partnered and collaborated with Mondelez International to grow the American-born Clif brand, supplying retailers with their products.
9. What pricing options are available for accessing the report?
Pricing options include single-user, multi-user, and enterprise licenses priced at USD 4750, USD 5250, and USD 8750 respectively.
10. Is the market size provided in terms of value or volume?
The market size is provided in terms of value, measured in Million.
11. Are there any specific market keywords associated with the report?
Yes, the market keyword associated with the report is "Cereal Bar Industry," which aids in identifying and referencing the specific market segment covered.
12. How do I determine which pricing option suits my needs best?
The pricing options vary based on user requirements and access needs. Individual users may opt for single-user licenses, while businesses requiring broader access may choose multi-user or enterprise licenses for cost-effective access to the report.
13. Are there any additional resources or data provided in the Cereal Bar Industry report?
While the report offers comprehensive insights, it's advisable to review the specific contents or supplementary materials provided to ascertain if additional resources or data are available.
14. How can I stay updated on further developments or reports in the Cereal Bar Industry?
To stay informed about further developments, trends, and reports in the Cereal Bar Industry, consider subscribing to industry newsletters, following relevant companies and organizations, or regularly checking reputable industry news sources and publications.
Methodology
Step 1 - Identification of Relevant Samples Size from Population Database


Step 2 - Approaches for Defining Global Market Size (Value, Volume* & Price*)

Note*: In applicable scenarios
Step 3 - Data Sources
Primary Research
- Web Analytics
- Survey Reports
- Research Institute
- Latest Research Reports
- Opinion Leaders
Secondary Research
- Annual Reports
- White Paper
- Latest Press Release
- Industry Association
- Paid Database
- Investor Presentations

Step 4 - Data Triangulation
Involves using different sources of information in order to increase the validity of a study
These sources are likely to be stakeholders in a program - participants, other researchers, program staff, other community members, and so on.
Then we put all data in single framework & apply various statistical tools to find out the dynamic on the market.
During the analysis stage, feedback from the stakeholder groups would be compared to determine areas of agreement as well as areas of divergence


