
Key Insights
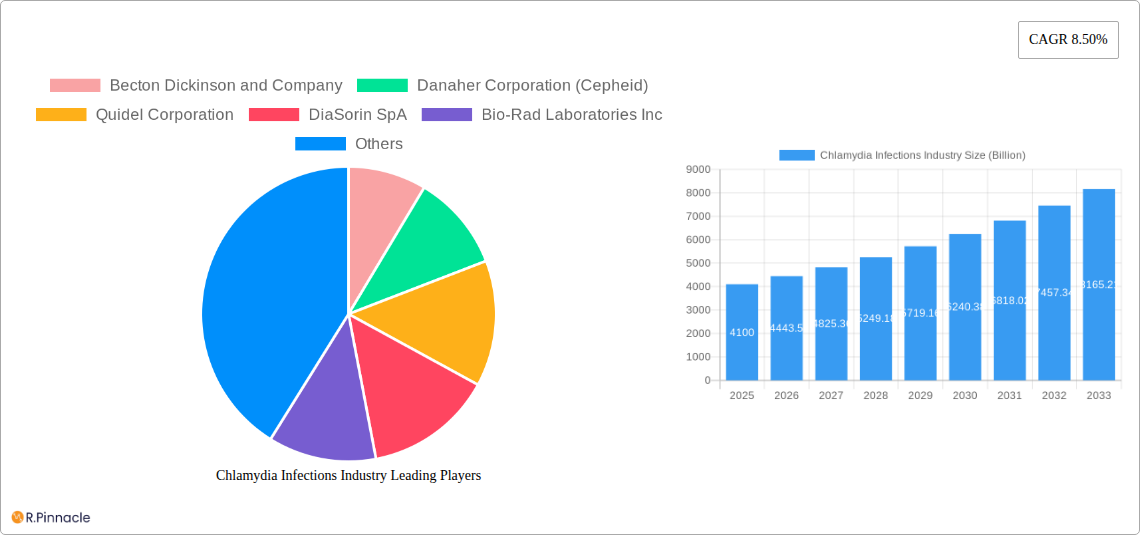
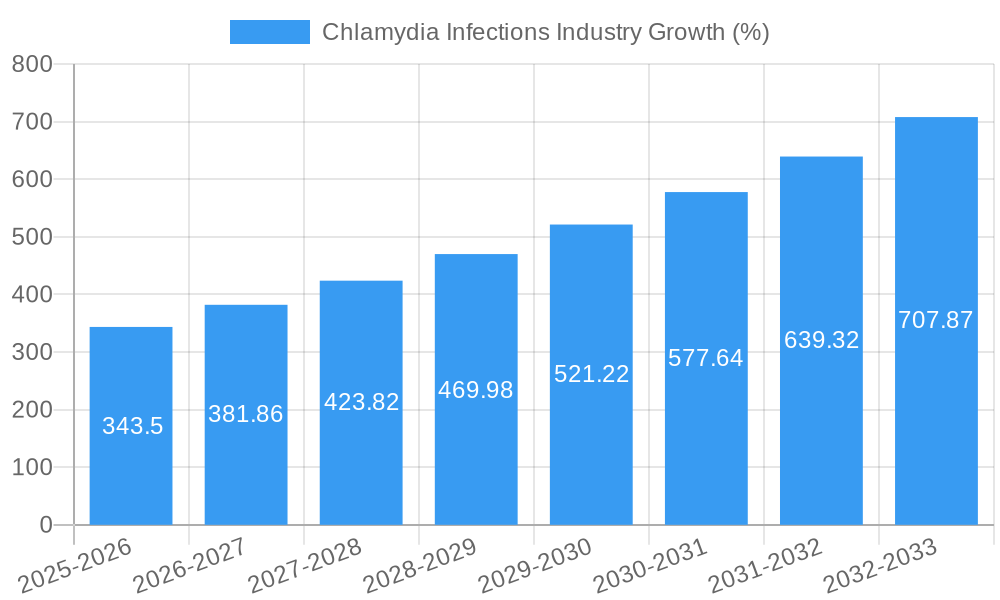
The Chlamydia Infections testing market, valued at $4.1 billion in 2025, exhibits robust growth potential, projected to expand at a compound annual growth rate (CAGR) of 8.50% from 2025 to 2033. This expansion is driven by several key factors. Rising prevalence of chlamydia infections globally, particularly among young adults, fuels the demand for accurate and timely diagnostic testing. Increased awareness campaigns and improved healthcare infrastructure in developing nations are also contributing to market growth. Furthermore, technological advancements in diagnostic techniques, such as the adoption of faster and more sensitive Nucleic Acid Amplification Tests (NAATs) and the development of point-of-care testing options, are streamlining diagnostic procedures and improving patient outcomes. The market is segmented by end-user (hospitals, diagnostic centers, other end-users) and test type (culture tests, NAATs, direct fluorescent antibody tests, serology tests, and others), with NAATs currently dominating due to their superior accuracy and speed. Competition among established players like Becton Dickinson, Danaher Corporation (Cepheid), and Abbott Laboratories, alongside emerging companies, fosters innovation and market dynamism.
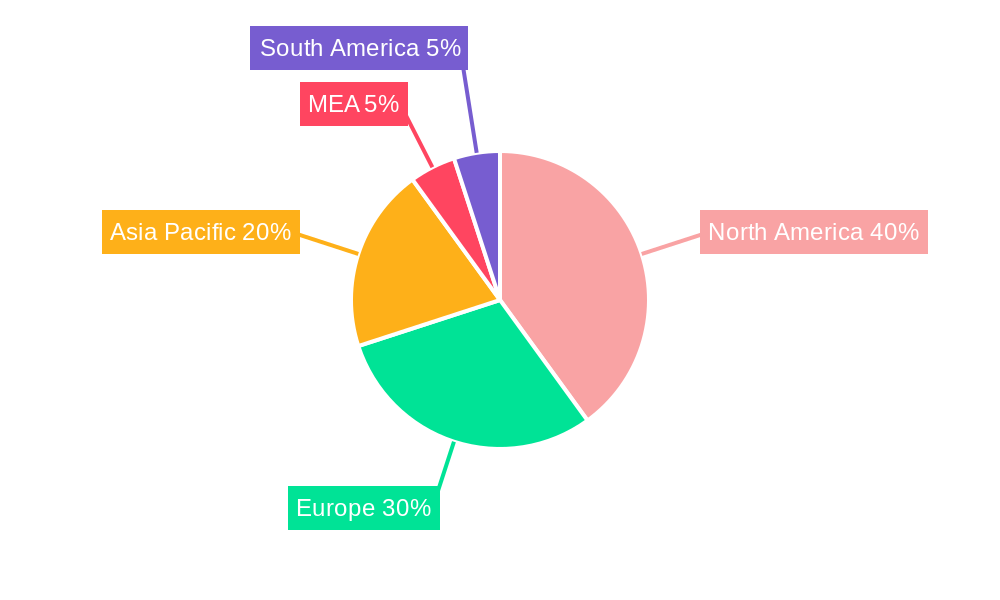
However, the market faces some challenges. The cost of advanced diagnostic technologies can limit accessibility in resource-constrained settings. Furthermore, variations in healthcare policies and reimbursement rates across different regions influence market penetration. The increasing prevalence of antibiotic resistance also poses a threat, necessitating the development of novel diagnostic and treatment strategies. Despite these restraints, the market's growth trajectory remains positive, fueled by the urgent need for effective chlamydia detection and management to prevent serious long-term health complications, including infertility. The North American market currently holds a significant share due to advanced healthcare infrastructure and high awareness levels, but the Asia-Pacific region is anticipated to witness substantial growth in the coming years, driven by rising disposable incomes and improved healthcare accessibility.
Chlamydia Infections Industry Market Report: 2019-2033
This comprehensive report provides a detailed analysis of the Chlamydia Infections Industry, offering invaluable insights for industry professionals, investors, and researchers. With a study period spanning 2019-2033, a base year of 2025, and a forecast period of 2025-2033, this report leverages extensive data analysis to project a market valued at $XX Billion by 2033.
Chlamydia Infections Industry Market Structure & Innovation Trends
This section analyzes the competitive landscape, innovation drivers, and regulatory influences shaping the Chlamydia Infections market. The market shows a moderately concentrated structure with key players commanding significant market share. Becton Dickinson and Company, Danaher Corporation (Cepheid), and Abbott Laboratories are among the leading players, with estimated combined market share exceeding xx%. Innovation is driven by the need for faster, more accurate, and cost-effective diagnostic tests. Regulatory frameworks, including FDA approvals and international guidelines, heavily influence product development and market access. The market witnesses consistent M&A activity, with deal values exceeding $XX Billion in the past five years. This activity is primarily focused on expanding product portfolios and geographical reach. Substitutes like alternative diagnostic methods and preventative measures also influence market dynamics. End-user demographics, particularly the prevalence of sexually transmitted infections among specific age groups and geographic locations, drive market demand.
- Market Concentration: Moderately concentrated, with top 3 players holding xx% market share.
- M&A Activity: Total deal value exceeding $XX Billion (2019-2024).
- Innovation Drivers: Need for faster, more accurate, and cost-effective diagnostics.
- Regulatory Frameworks: FDA approvals and international guidelines significantly impact market access.
- Product Substitutes: Alternative diagnostic methods and preventative measures.
Chlamydia Infections Industry Market Dynamics & Trends
The Chlamydia Infections market exhibits a robust CAGR of xx% during the forecast period (2025-2033), driven by several factors. Rising prevalence of chlamydia infections globally, increasing awareness of sexually transmitted infections (STIs), and advancements in diagnostic technologies contribute significantly to market growth. Technological disruptions, particularly the introduction of advanced molecular diagnostic techniques like Nucleic Acid Amplification Tests (NAATs), are transforming the industry, enhancing accuracy and speed of testing. Consumer preferences are shifting towards convenient and rapid point-of-care testing options. Competitive dynamics are characterized by ongoing product innovation, strategic partnerships, and mergers and acquisitions among leading players. Market penetration of NAATs is expected to increase from xx% in 2025 to xx% by 2033. The increasing demand for high-throughput screening in hospitals and diagnostic centers further fuels market expansion.
Dominant Regions & Segments in Chlamydia Infections Industry
North America currently dominates the Chlamydia Infections market, driven by factors including higher healthcare expenditure, advanced diagnostic infrastructure, and increased awareness campaigns for STI prevention. Within North America, the United States holds the largest market share. Within the end-user segment, hospitals and diagnostic centers represent the largest revenue contributors, accounting for approximately xx% of the market in 2025.
- Key Drivers for North American Dominance:
- High healthcare expenditure
- Advanced diagnostic infrastructure
- Increased STI awareness campaigns
- End-User Segment Dominance:
- Hospitals and diagnostic centers account for xx% of the market (2025).
Nucleic Acid Amplification Tests (NAATs) represent the dominant test type, owing to their high sensitivity and specificity. The market is further segmented by test type, with NAATs, culture tests, serology tests, direct fluorescent antibody tests, and other test types.
- Key Drivers for NAAT Dominance:
- High sensitivity and specificity
- Faster results compared to culture tests.
Chlamydia Infections Industry Product Innovations
Recent product developments focus on improving diagnostic accuracy, speed, and ease of use. Automated platforms like the BD COR MX system are gaining traction due to their high throughput capacity, reducing turnaround times and improving efficiency. Point-of-care testing devices are also emerging, offering convenience and timely diagnosis, particularly in resource-limited settings. These innovations are crucial for improving patient outcomes and enhancing public health initiatives. The market witnesses continuous improvement in test sensitivity, specificity, and cost-effectiveness through technological advancements.
Report Scope & Segmentation Analysis
This report comprehensively segments the Chlamydia Infections market by End User (Hospitals, Diagnostic Centers, Other End Users) and Test Type (Culture Tests, Nucleic Acid Amplification Test (NAAT), Direct Fluorescent Antibody Test, Serology Tests, Other Test Types). Each segment's market size, growth projections, and competitive dynamics are analyzed in detail. For example, the NAAT segment is projected to witness significant growth, driven by its superior performance compared to traditional methods. Hospitals and Diagnostic Centers are anticipated to maintain their leading positions among end-users throughout the forecast period.
Key Drivers of Chlamydia Infections Industry Growth
Several factors contribute to the growth of the Chlamydia Infections Industry. The rising prevalence of Chlamydia infections globally is a primary driver. Advancements in diagnostic technologies, particularly the development of more accurate and rapid tests, have significantly improved early detection and treatment. Increased public awareness campaigns on STI prevention and testing also contribute to higher testing rates. Furthermore, favorable regulatory environments and supportive government initiatives further boost market growth.
Challenges in the Chlamydia Infections Industry Sector
The Chlamydia Infections industry faces several challenges. High costs associated with advanced diagnostic technologies can limit accessibility, particularly in low-resource settings. Stringent regulatory requirements and approval processes can delay product launches and increase development costs. Competition among existing players and the entry of new entrants create intense competitive pressure. The fluctuating prices of raw materials and reagents for diagnostic tests impact profitability.
Emerging Opportunities in Chlamydia Infections Industry
The Chlamydia Infections industry presents several opportunities. The development of point-of-care diagnostic tests offers the potential for wider access to testing in remote areas and community settings. The rising demand for home-based testing kits and digital health solutions further provides opportunities for innovation and expansion. The exploration of new diagnostic technologies, such as CRISPR-Cas based diagnostics, could revolutionize chlamydia detection.
Leading Players in the Chlamydia Infections Industry Market
- Becton Dickinson and Company
- Danaher Corporation (Cepheid)
- Quidel Corporation
- DiaSorin SpA
- Bio-Rad Laboratories Inc
- Laxai Pharma Ltd (Savyon Diagnostics Ltd)
- F Hoffmann-La Roche Ltd
- Hologic Inc
- Abbott Laboratories
- Trinity Biotech Plc
Key Developments in Chlamydia Infections Industry Industry
- May 2022: Becton, Dickinson, and Company launched the BD COR MX system, a fully automated, high-throughput infectious disease molecular diagnostics platform.
- April 2022: Chiricahua Community Health Centers, Inc. (CCHCI) collaborated with The Body Agency Collective (TBAC) and Visby Medical, Inc., to improve STI diagnosis using the Sexual Health Click Test.
Future Outlook for Chlamydia Infections Industry Market
The Chlamydia Infections market is poised for continued growth, driven by factors such as increasing prevalence of chlamydia, advancements in diagnostic technologies, and rising awareness of STI prevention. Strategic partnerships and collaborations between diagnostic companies and healthcare providers are expected to enhance access to testing and improve patient outcomes. The development of innovative diagnostic solutions, particularly point-of-care and home-based tests, will further fuel market expansion and improve the accessibility of diagnostics for the global population.
Chlamydia Infections Industry Segmentation
-
1. Test Type
- 1.1. Culture Tests
- 1.2. Nucleic Acid Amplification Test (NAAT)
- 1.3. Direct Fluorescent Antibody Test
- 1.4. Serology Tests
- 1.5. Other Test Types
-
2. End User
- 2.1. Hospitals
- 2.2. Diagnostic Centers
- 2.3. Other End Users
Chlamydia Infections Industry Segmentation By Geography
-
1. North America
- 1.1. United States
- 1.2. Canada
- 1.3. Mexico
-
2. Europe
- 2.1. Germany
- 2.2. United Kingdom
- 2.3. France
- 2.4. Italy
- 2.5. Spain
- 2.6. Rest of Europe
-
3. Asia Pacific
- 3.1. China
- 3.2. Japan
- 3.3. India
- 3.4. Australia
- 3.5. South Korea
- 3.6. Rest of Asia Pacific
-
4. Middle East and Africa
- 4.1. GCC
- 4.2. South Africa
- 4.3. Rest of Middle East and Africa
-
5. South America
- 5.1. Brazil
- 5.2. Argentina
- 5.3. Rest of South America
Chlamydia Infections Industry REPORT HIGHLIGHTS
| Aspects | Details |
|---|---|
| Study Period | 2019-2033 |
| Base Year | 2024 |
| Estimated Year | 2025 |
| Forecast Period | 2025-2033 |
| Historical Period | 2019-2024 |
| Growth Rate | CAGR of 8.50% from 2019-2033 |
| Segmentation |
|
Table of Contents
- 1. Introduction
- 1.1. Research Scope
- 1.2. Market Segmentation
- 1.3. Research Methodology
- 1.4. Definitions and Assumptions
- 2. Executive Summary
- 2.1. Introduction
- 3. Market Dynamics
- 3.1. Introduction
- 3.2. Market Drivers
- 3.2.1. Increasing Prevalence Rate of Chlamydia Infection; Increasing Initiatives for Chlamydia Testing and Product Innovation
- 3.3. Market Restrains
- 3.3.1. Social Stigma Associated with Patients Visiting Specialized STD Clinics; Huge Proportion of Patients Infected with Chlamydia in Out-of-reach Geographic Areas
- 3.4. Market Trends
- 3.4.1. Nucleic Acid Amplification Test (NAAT) Based Tests Dominates the Chlamydia Infection Diagnostics Market
- 4. Market Factor Analysis
- 4.1. Porters Five Forces
- 4.2. Supply/Value Chain
- 4.3. PESTEL analysis
- 4.4. Market Entropy
- 4.5. Patent/Trademark Analysis
- 5. Global Chlamydia Infections Industry Analysis, Insights and Forecast, 2019-2031
- 5.1. Market Analysis, Insights and Forecast - by Test Type
- 5.1.1. Culture Tests
- 5.1.2. Nucleic Acid Amplification Test (NAAT)
- 5.1.3. Direct Fluorescent Antibody Test
- 5.1.4. Serology Tests
- 5.1.5. Other Test Types
- 5.2. Market Analysis, Insights and Forecast - by End User
- 5.2.1. Hospitals
- 5.2.2. Diagnostic Centers
- 5.2.3. Other End Users
- 5.3. Market Analysis, Insights and Forecast - by Region
- 5.3.1. North America
- 5.3.2. Europe
- 5.3.3. Asia Pacific
- 5.3.4. Middle East and Africa
- 5.3.5. South America
- 5.1. Market Analysis, Insights and Forecast - by Test Type
- 6. North America Chlamydia Infections Industry Analysis, Insights and Forecast, 2019-2031
- 6.1. Market Analysis, Insights and Forecast - by Test Type
- 6.1.1. Culture Tests
- 6.1.2. Nucleic Acid Amplification Test (NAAT)
- 6.1.3. Direct Fluorescent Antibody Test
- 6.1.4. Serology Tests
- 6.1.5. Other Test Types
- 6.2. Market Analysis, Insights and Forecast - by End User
- 6.2.1. Hospitals
- 6.2.2. Diagnostic Centers
- 6.2.3. Other End Users
- 6.1. Market Analysis, Insights and Forecast - by Test Type
- 7. Europe Chlamydia Infections Industry Analysis, Insights and Forecast, 2019-2031
- 7.1. Market Analysis, Insights and Forecast - by Test Type
- 7.1.1. Culture Tests
- 7.1.2. Nucleic Acid Amplification Test (NAAT)
- 7.1.3. Direct Fluorescent Antibody Test
- 7.1.4. Serology Tests
- 7.1.5. Other Test Types
- 7.2. Market Analysis, Insights and Forecast - by End User
- 7.2.1. Hospitals
- 7.2.2. Diagnostic Centers
- 7.2.3. Other End Users
- 7.1. Market Analysis, Insights and Forecast - by Test Type
- 8. Asia Pacific Chlamydia Infections Industry Analysis, Insights and Forecast, 2019-2031
- 8.1. Market Analysis, Insights and Forecast - by Test Type
- 8.1.1. Culture Tests
- 8.1.2. Nucleic Acid Amplification Test (NAAT)
- 8.1.3. Direct Fluorescent Antibody Test
- 8.1.4. Serology Tests
- 8.1.5. Other Test Types
- 8.2. Market Analysis, Insights and Forecast - by End User
- 8.2.1. Hospitals
- 8.2.2. Diagnostic Centers
- 8.2.3. Other End Users
- 8.1. Market Analysis, Insights and Forecast - by Test Type
- 9. Middle East and Africa Chlamydia Infections Industry Analysis, Insights and Forecast, 2019-2031
- 9.1. Market Analysis, Insights and Forecast - by Test Type
- 9.1.1. Culture Tests
- 9.1.2. Nucleic Acid Amplification Test (NAAT)
- 9.1.3. Direct Fluorescent Antibody Test
- 9.1.4. Serology Tests
- 9.1.5. Other Test Types
- 9.2. Market Analysis, Insights and Forecast - by End User
- 9.2.1. Hospitals
- 9.2.2. Diagnostic Centers
- 9.2.3. Other End Users
- 9.1. Market Analysis, Insights and Forecast - by Test Type
- 10. South America Chlamydia Infections Industry Analysis, Insights and Forecast, 2019-2031
- 10.1. Market Analysis, Insights and Forecast - by Test Type
- 10.1.1. Culture Tests
- 10.1.2. Nucleic Acid Amplification Test (NAAT)
- 10.1.3. Direct Fluorescent Antibody Test
- 10.1.4. Serology Tests
- 10.1.5. Other Test Types
- 10.2. Market Analysis, Insights and Forecast - by End User
- 10.2.1. Hospitals
- 10.2.2. Diagnostic Centers
- 10.2.3. Other End Users
- 10.1. Market Analysis, Insights and Forecast - by Test Type
- 11. North America Chlamydia Infections Industry Analysis, Insights and Forecast, 2019-2031
- 11.1. Market Analysis, Insights and Forecast - By Country/Sub-region
- 11.1.1 United States
- 11.1.2 Canada
- 11.1.3 Mexico
- 12. South America Chlamydia Infections Industry Analysis, Insights and Forecast, 2019-2031
- 12.1. Market Analysis, Insights and Forecast - By Country/Sub-region
- 12.1.1 Brazil
- 12.1.2 Mexico
- 12.1.3 Rest of South America
- 13. Europe Chlamydia Infections Industry Analysis, Insights and Forecast, 2019-2031
- 13.1. Market Analysis, Insights and Forecast - By Country/Sub-region
- 13.1.1 United Kingdom
- 13.1.2 Germany
- 13.1.3 France
- 13.1.4 Italy
- 13.1.5 Spain
- 13.1.6 Russia
- 13.1.7 Rest of Europe
- 14. Asia Pacific Chlamydia Infections Industry Analysis, Insights and Forecast, 2019-2031
- 14.1. Market Analysis, Insights and Forecast - By Country/Sub-region
- 14.1.1 China
- 14.1.2 Japan
- 14.1.3 India
- 14.1.4 South Korea
- 14.1.5 Taiwan
- 14.1.6 Australia
- 14.1.7 Rest of Asia-Pacific
- 15. MEA Chlamydia Infections Industry Analysis, Insights and Forecast, 2019-2031
- 15.1. Market Analysis, Insights and Forecast - By Country/Sub-region
- 15.1.1 Middle East
- 15.1.2 Africa
- 16. Competitive Analysis
- 16.1. Global Market Share Analysis 2024
- 16.2. Company Profiles
- 16.2.1 Becton Dickinson and Company
- 16.2.1.1. Overview
- 16.2.1.2. Products
- 16.2.1.3. SWOT Analysis
- 16.2.1.4. Recent Developments
- 16.2.1.5. Financials (Based on Availability)
- 16.2.2 Danaher Corporation (Cepheid)
- 16.2.2.1. Overview
- 16.2.2.2. Products
- 16.2.2.3. SWOT Analysis
- 16.2.2.4. Recent Developments
- 16.2.2.5. Financials (Based on Availability)
- 16.2.3 Quidel Corporation
- 16.2.3.1. Overview
- 16.2.3.2. Products
- 16.2.3.3. SWOT Analysis
- 16.2.3.4. Recent Developments
- 16.2.3.5. Financials (Based on Availability)
- 16.2.4 DiaSorin SpA
- 16.2.4.1. Overview
- 16.2.4.2. Products
- 16.2.4.3. SWOT Analysis
- 16.2.4.4. Recent Developments
- 16.2.4.5. Financials (Based on Availability)
- 16.2.5 Bio-Rad Laboratories Inc
- 16.2.5.1. Overview
- 16.2.5.2. Products
- 16.2.5.3. SWOT Analysis
- 16.2.5.4. Recent Developments
- 16.2.5.5. Financials (Based on Availability)
- 16.2.6 Laxai Pharma Ltd (Savyon Diagnostics Ltd)
- 16.2.6.1. Overview
- 16.2.6.2. Products
- 16.2.6.3. SWOT Analysis
- 16.2.6.4. Recent Developments
- 16.2.6.5. Financials (Based on Availability)
- 16.2.7 F Hoffmann-La Roche Ltd
- 16.2.7.1. Overview
- 16.2.7.2. Products
- 16.2.7.3. SWOT Analysis
- 16.2.7.4. Recent Developments
- 16.2.7.5. Financials (Based on Availability)
- 16.2.8 Hologic Inc
- 16.2.8.1. Overview
- 16.2.8.2. Products
- 16.2.8.3. SWOT Analysis
- 16.2.8.4. Recent Developments
- 16.2.8.5. Financials (Based on Availability)
- 16.2.9 Abbott Laboratories
- 16.2.9.1. Overview
- 16.2.9.2. Products
- 16.2.9.3. SWOT Analysis
- 16.2.9.4. Recent Developments
- 16.2.9.5. Financials (Based on Availability)
- 16.2.10 Trinity Biotech Plc
- 16.2.10.1. Overview
- 16.2.10.2. Products
- 16.2.10.3. SWOT Analysis
- 16.2.10.4. Recent Developments
- 16.2.10.5. Financials (Based on Availability)
- 16.2.1 Becton Dickinson and Company
List of Figures
- Figure 1: Global Chlamydia Infections Industry Revenue Breakdown (Billion, %) by Region 2024 & 2032
- Figure 2: Global Chlamydia Infections Industry Volume Breakdown (K Unit, %) by Region 2024 & 2032
- Figure 3: North America Chlamydia Infections Industry Revenue (Billion), by Country 2024 & 2032
- Figure 4: North America Chlamydia Infections Industry Volume (K Unit), by Country 2024 & 2032
- Figure 5: North America Chlamydia Infections Industry Revenue Share (%), by Country 2024 & 2032
- Figure 6: North America Chlamydia Infections Industry Volume Share (%), by Country 2024 & 2032
- Figure 7: South America Chlamydia Infections Industry Revenue (Billion), by Country 2024 & 2032
- Figure 8: South America Chlamydia Infections Industry Volume (K Unit), by Country 2024 & 2032
- Figure 9: South America Chlamydia Infections Industry Revenue Share (%), by Country 2024 & 2032
- Figure 10: South America Chlamydia Infections Industry Volume Share (%), by Country 2024 & 2032
- Figure 11: Europe Chlamydia Infections Industry Revenue (Billion), by Country 2024 & 2032
- Figure 12: Europe Chlamydia Infections Industry Volume (K Unit), by Country 2024 & 2032
- Figure 13: Europe Chlamydia Infections Industry Revenue Share (%), by Country 2024 & 2032
- Figure 14: Europe Chlamydia Infections Industry Volume Share (%), by Country 2024 & 2032
- Figure 15: Asia Pacific Chlamydia Infections Industry Revenue (Billion), by Country 2024 & 2032
- Figure 16: Asia Pacific Chlamydia Infections Industry Volume (K Unit), by Country 2024 & 2032
- Figure 17: Asia Pacific Chlamydia Infections Industry Revenue Share (%), by Country 2024 & 2032
- Figure 18: Asia Pacific Chlamydia Infections Industry Volume Share (%), by Country 2024 & 2032
- Figure 19: MEA Chlamydia Infections Industry Revenue (Billion), by Country 2024 & 2032
- Figure 20: MEA Chlamydia Infections Industry Volume (K Unit), by Country 2024 & 2032
- Figure 21: MEA Chlamydia Infections Industry Revenue Share (%), by Country 2024 & 2032
- Figure 22: MEA Chlamydia Infections Industry Volume Share (%), by Country 2024 & 2032
- Figure 23: North America Chlamydia Infections Industry Revenue (Billion), by Test Type 2024 & 2032
- Figure 24: North America Chlamydia Infections Industry Volume (K Unit), by Test Type 2024 & 2032
- Figure 25: North America Chlamydia Infections Industry Revenue Share (%), by Test Type 2024 & 2032
- Figure 26: North America Chlamydia Infections Industry Volume Share (%), by Test Type 2024 & 2032
- Figure 27: North America Chlamydia Infections Industry Revenue (Billion), by End User 2024 & 2032
- Figure 28: North America Chlamydia Infections Industry Volume (K Unit), by End User 2024 & 2032
- Figure 29: North America Chlamydia Infections Industry Revenue Share (%), by End User 2024 & 2032
- Figure 30: North America Chlamydia Infections Industry Volume Share (%), by End User 2024 & 2032
- Figure 31: North America Chlamydia Infections Industry Revenue (Billion), by Country 2024 & 2032
- Figure 32: North America Chlamydia Infections Industry Volume (K Unit), by Country 2024 & 2032
- Figure 33: North America Chlamydia Infections Industry Revenue Share (%), by Country 2024 & 2032
- Figure 34: North America Chlamydia Infections Industry Volume Share (%), by Country 2024 & 2032
- Figure 35: Europe Chlamydia Infections Industry Revenue (Billion), by Test Type 2024 & 2032
- Figure 36: Europe Chlamydia Infections Industry Volume (K Unit), by Test Type 2024 & 2032
- Figure 37: Europe Chlamydia Infections Industry Revenue Share (%), by Test Type 2024 & 2032
- Figure 38: Europe Chlamydia Infections Industry Volume Share (%), by Test Type 2024 & 2032
- Figure 39: Europe Chlamydia Infections Industry Revenue (Billion), by End User 2024 & 2032
- Figure 40: Europe Chlamydia Infections Industry Volume (K Unit), by End User 2024 & 2032
- Figure 41: Europe Chlamydia Infections Industry Revenue Share (%), by End User 2024 & 2032
- Figure 42: Europe Chlamydia Infections Industry Volume Share (%), by End User 2024 & 2032
- Figure 43: Europe Chlamydia Infections Industry Revenue (Billion), by Country 2024 & 2032
- Figure 44: Europe Chlamydia Infections Industry Volume (K Unit), by Country 2024 & 2032
- Figure 45: Europe Chlamydia Infections Industry Revenue Share (%), by Country 2024 & 2032
- Figure 46: Europe Chlamydia Infections Industry Volume Share (%), by Country 2024 & 2032
- Figure 47: Asia Pacific Chlamydia Infections Industry Revenue (Billion), by Test Type 2024 & 2032
- Figure 48: Asia Pacific Chlamydia Infections Industry Volume (K Unit), by Test Type 2024 & 2032
- Figure 49: Asia Pacific Chlamydia Infections Industry Revenue Share (%), by Test Type 2024 & 2032
- Figure 50: Asia Pacific Chlamydia Infections Industry Volume Share (%), by Test Type 2024 & 2032
- Figure 51: Asia Pacific Chlamydia Infections Industry Revenue (Billion), by End User 2024 & 2032
- Figure 52: Asia Pacific Chlamydia Infections Industry Volume (K Unit), by End User 2024 & 2032
- Figure 53: Asia Pacific Chlamydia Infections Industry Revenue Share (%), by End User 2024 & 2032
- Figure 54: Asia Pacific Chlamydia Infections Industry Volume Share (%), by End User 2024 & 2032
- Figure 55: Asia Pacific Chlamydia Infections Industry Revenue (Billion), by Country 2024 & 2032
- Figure 56: Asia Pacific Chlamydia Infections Industry Volume (K Unit), by Country 2024 & 2032
- Figure 57: Asia Pacific Chlamydia Infections Industry Revenue Share (%), by Country 2024 & 2032
- Figure 58: Asia Pacific Chlamydia Infections Industry Volume Share (%), by Country 2024 & 2032
- Figure 59: Middle East and Africa Chlamydia Infections Industry Revenue (Billion), by Test Type 2024 & 2032
- Figure 60: Middle East and Africa Chlamydia Infections Industry Volume (K Unit), by Test Type 2024 & 2032
- Figure 61: Middle East and Africa Chlamydia Infections Industry Revenue Share (%), by Test Type 2024 & 2032
- Figure 62: Middle East and Africa Chlamydia Infections Industry Volume Share (%), by Test Type 2024 & 2032
- Figure 63: Middle East and Africa Chlamydia Infections Industry Revenue (Billion), by End User 2024 & 2032
- Figure 64: Middle East and Africa Chlamydia Infections Industry Volume (K Unit), by End User 2024 & 2032
- Figure 65: Middle East and Africa Chlamydia Infections Industry Revenue Share (%), by End User 2024 & 2032
- Figure 66: Middle East and Africa Chlamydia Infections Industry Volume Share (%), by End User 2024 & 2032
- Figure 67: Middle East and Africa Chlamydia Infections Industry Revenue (Billion), by Country 2024 & 2032
- Figure 68: Middle East and Africa Chlamydia Infections Industry Volume (K Unit), by Country 2024 & 2032
- Figure 69: Middle East and Africa Chlamydia Infections Industry Revenue Share (%), by Country 2024 & 2032
- Figure 70: Middle East and Africa Chlamydia Infections Industry Volume Share (%), by Country 2024 & 2032
- Figure 71: South America Chlamydia Infections Industry Revenue (Billion), by Test Type 2024 & 2032
- Figure 72: South America Chlamydia Infections Industry Volume (K Unit), by Test Type 2024 & 2032
- Figure 73: South America Chlamydia Infections Industry Revenue Share (%), by Test Type 2024 & 2032
- Figure 74: South America Chlamydia Infections Industry Volume Share (%), by Test Type 2024 & 2032
- Figure 75: South America Chlamydia Infections Industry Revenue (Billion), by End User 2024 & 2032
- Figure 76: South America Chlamydia Infections Industry Volume (K Unit), by End User 2024 & 2032
- Figure 77: South America Chlamydia Infections Industry Revenue Share (%), by End User 2024 & 2032
- Figure 78: South America Chlamydia Infections Industry Volume Share (%), by End User 2024 & 2032
- Figure 79: South America Chlamydia Infections Industry Revenue (Billion), by Country 2024 & 2032
- Figure 80: South America Chlamydia Infections Industry Volume (K Unit), by Country 2024 & 2032
- Figure 81: South America Chlamydia Infections Industry Revenue Share (%), by Country 2024 & 2032
- Figure 82: South America Chlamydia Infections Industry Volume Share (%), by Country 2024 & 2032
List of Tables
- Table 1: Global Chlamydia Infections Industry Revenue Billion Forecast, by Region 2019 & 2032
- Table 2: Global Chlamydia Infections Industry Volume K Unit Forecast, by Region 2019 & 2032
- Table 3: Global Chlamydia Infections Industry Revenue Billion Forecast, by Test Type 2019 & 2032
- Table 4: Global Chlamydia Infections Industry Volume K Unit Forecast, by Test Type 2019 & 2032
- Table 5: Global Chlamydia Infections Industry Revenue Billion Forecast, by End User 2019 & 2032
- Table 6: Global Chlamydia Infections Industry Volume K Unit Forecast, by End User 2019 & 2032
- Table 7: Global Chlamydia Infections Industry Revenue Billion Forecast, by Region 2019 & 2032
- Table 8: Global Chlamydia Infections Industry Volume K Unit Forecast, by Region 2019 & 2032
- Table 9: Global Chlamydia Infections Industry Revenue Billion Forecast, by Country 2019 & 2032
- Table 10: Global Chlamydia Infections Industry Volume K Unit Forecast, by Country 2019 & 2032
- Table 11: United States Chlamydia Infections Industry Revenue (Billion) Forecast, by Application 2019 & 2032
- Table 12: United States Chlamydia Infections Industry Volume (K Unit) Forecast, by Application 2019 & 2032
- Table 13: Canada Chlamydia Infections Industry Revenue (Billion) Forecast, by Application 2019 & 2032
- Table 14: Canada Chlamydia Infections Industry Volume (K Unit) Forecast, by Application 2019 & 2032
- Table 15: Mexico Chlamydia Infections Industry Revenue (Billion) Forecast, by Application 2019 & 2032
- Table 16: Mexico Chlamydia Infections Industry Volume (K Unit) Forecast, by Application 2019 & 2032
- Table 17: Global Chlamydia Infections Industry Revenue Billion Forecast, by Country 2019 & 2032
- Table 18: Global Chlamydia Infections Industry Volume K Unit Forecast, by Country 2019 & 2032
- Table 19: Brazil Chlamydia Infections Industry Revenue (Billion) Forecast, by Application 2019 & 2032
- Table 20: Brazil Chlamydia Infections Industry Volume (K Unit) Forecast, by Application 2019 & 2032
- Table 21: Mexico Chlamydia Infections Industry Revenue (Billion) Forecast, by Application 2019 & 2032
- Table 22: Mexico Chlamydia Infections Industry Volume (K Unit) Forecast, by Application 2019 & 2032
- Table 23: Rest of South America Chlamydia Infections Industry Revenue (Billion) Forecast, by Application 2019 & 2032
- Table 24: Rest of South America Chlamydia Infections Industry Volume (K Unit) Forecast, by Application 2019 & 2032
- Table 25: Global Chlamydia Infections Industry Revenue Billion Forecast, by Country 2019 & 2032
- Table 26: Global Chlamydia Infections Industry Volume K Unit Forecast, by Country 2019 & 2032
- Table 27: United Kingdom Chlamydia Infections Industry Revenue (Billion) Forecast, by Application 2019 & 2032
- Table 28: United Kingdom Chlamydia Infections Industry Volume (K Unit) Forecast, by Application 2019 & 2032
- Table 29: Germany Chlamydia Infections Industry Revenue (Billion) Forecast, by Application 2019 & 2032
- Table 30: Germany Chlamydia Infections Industry Volume (K Unit) Forecast, by Application 2019 & 2032
- Table 31: France Chlamydia Infections Industry Revenue (Billion) Forecast, by Application 2019 & 2032
- Table 32: France Chlamydia Infections Industry Volume (K Unit) Forecast, by Application 2019 & 2032
- Table 33: Italy Chlamydia Infections Industry Revenue (Billion) Forecast, by Application 2019 & 2032
- Table 34: Italy Chlamydia Infections Industry Volume (K Unit) Forecast, by Application 2019 & 2032
- Table 35: Spain Chlamydia Infections Industry Revenue (Billion) Forecast, by Application 2019 & 2032
- Table 36: Spain Chlamydia Infections Industry Volume (K Unit) Forecast, by Application 2019 & 2032
- Table 37: Russia Chlamydia Infections Industry Revenue (Billion) Forecast, by Application 2019 & 2032
- Table 38: Russia Chlamydia Infections Industry Volume (K Unit) Forecast, by Application 2019 & 2032
- Table 39: Rest of Europe Chlamydia Infections Industry Revenue (Billion) Forecast, by Application 2019 & 2032
- Table 40: Rest of Europe Chlamydia Infections Industry Volume (K Unit) Forecast, by Application 2019 & 2032
- Table 41: Global Chlamydia Infections Industry Revenue Billion Forecast, by Country 2019 & 2032
- Table 42: Global Chlamydia Infections Industry Volume K Unit Forecast, by Country 2019 & 2032
- Table 43: China Chlamydia Infections Industry Revenue (Billion) Forecast, by Application 2019 & 2032
- Table 44: China Chlamydia Infections Industry Volume (K Unit) Forecast, by Application 2019 & 2032
- Table 45: Japan Chlamydia Infections Industry Revenue (Billion) Forecast, by Application 2019 & 2032
- Table 46: Japan Chlamydia Infections Industry Volume (K Unit) Forecast, by Application 2019 & 2032
- Table 47: India Chlamydia Infections Industry Revenue (Billion) Forecast, by Application 2019 & 2032
- Table 48: India Chlamydia Infections Industry Volume (K Unit) Forecast, by Application 2019 & 2032
- Table 49: South Korea Chlamydia Infections Industry Revenue (Billion) Forecast, by Application 2019 & 2032
- Table 50: South Korea Chlamydia Infections Industry Volume (K Unit) Forecast, by Application 2019 & 2032
- Table 51: Taiwan Chlamydia Infections Industry Revenue (Billion) Forecast, by Application 2019 & 2032
- Table 52: Taiwan Chlamydia Infections Industry Volume (K Unit) Forecast, by Application 2019 & 2032
- Table 53: Australia Chlamydia Infections Industry Revenue (Billion) Forecast, by Application 2019 & 2032
- Table 54: Australia Chlamydia Infections Industry Volume (K Unit) Forecast, by Application 2019 & 2032
- Table 55: Rest of Asia-Pacific Chlamydia Infections Industry Revenue (Billion) Forecast, by Application 2019 & 2032
- Table 56: Rest of Asia-Pacific Chlamydia Infections Industry Volume (K Unit) Forecast, by Application 2019 & 2032
- Table 57: Global Chlamydia Infections Industry Revenue Billion Forecast, by Country 2019 & 2032
- Table 58: Global Chlamydia Infections Industry Volume K Unit Forecast, by Country 2019 & 2032
- Table 59: Middle East Chlamydia Infections Industry Revenue (Billion) Forecast, by Application 2019 & 2032
- Table 60: Middle East Chlamydia Infections Industry Volume (K Unit) Forecast, by Application 2019 & 2032
- Table 61: Africa Chlamydia Infections Industry Revenue (Billion) Forecast, by Application 2019 & 2032
- Table 62: Africa Chlamydia Infections Industry Volume (K Unit) Forecast, by Application 2019 & 2032
- Table 63: Global Chlamydia Infections Industry Revenue Billion Forecast, by Test Type 2019 & 2032
- Table 64: Global Chlamydia Infections Industry Volume K Unit Forecast, by Test Type 2019 & 2032
- Table 65: Global Chlamydia Infections Industry Revenue Billion Forecast, by End User 2019 & 2032
- Table 66: Global Chlamydia Infections Industry Volume K Unit Forecast, by End User 2019 & 2032
- Table 67: Global Chlamydia Infections Industry Revenue Billion Forecast, by Country 2019 & 2032
- Table 68: Global Chlamydia Infections Industry Volume K Unit Forecast, by Country 2019 & 2032
- Table 69: United States Chlamydia Infections Industry Revenue (Billion) Forecast, by Application 2019 & 2032
- Table 70: United States Chlamydia Infections Industry Volume (K Unit) Forecast, by Application 2019 & 2032
- Table 71: Canada Chlamydia Infections Industry Revenue (Billion) Forecast, by Application 2019 & 2032
- Table 72: Canada Chlamydia Infections Industry Volume (K Unit) Forecast, by Application 2019 & 2032
- Table 73: Mexico Chlamydia Infections Industry Revenue (Billion) Forecast, by Application 2019 & 2032
- Table 74: Mexico Chlamydia Infections Industry Volume (K Unit) Forecast, by Application 2019 & 2032
- Table 75: Global Chlamydia Infections Industry Revenue Billion Forecast, by Test Type 2019 & 2032
- Table 76: Global Chlamydia Infections Industry Volume K Unit Forecast, by Test Type 2019 & 2032
- Table 77: Global Chlamydia Infections Industry Revenue Billion Forecast, by End User 2019 & 2032
- Table 78: Global Chlamydia Infections Industry Volume K Unit Forecast, by End User 2019 & 2032
- Table 79: Global Chlamydia Infections Industry Revenue Billion Forecast, by Country 2019 & 2032
- Table 80: Global Chlamydia Infections Industry Volume K Unit Forecast, by Country 2019 & 2032
- Table 81: Germany Chlamydia Infections Industry Revenue (Billion) Forecast, by Application 2019 & 2032
- Table 82: Germany Chlamydia Infections Industry Volume (K Unit) Forecast, by Application 2019 & 2032
- Table 83: United Kingdom Chlamydia Infections Industry Revenue (Billion) Forecast, by Application 2019 & 2032
- Table 84: United Kingdom Chlamydia Infections Industry Volume (K Unit) Forecast, by Application 2019 & 2032
- Table 85: France Chlamydia Infections Industry Revenue (Billion) Forecast, by Application 2019 & 2032
- Table 86: France Chlamydia Infections Industry Volume (K Unit) Forecast, by Application 2019 & 2032
- Table 87: Italy Chlamydia Infections Industry Revenue (Billion) Forecast, by Application 2019 & 2032
- Table 88: Italy Chlamydia Infections Industry Volume (K Unit) Forecast, by Application 2019 & 2032
- Table 89: Spain Chlamydia Infections Industry Revenue (Billion) Forecast, by Application 2019 & 2032
- Table 90: Spain Chlamydia Infections Industry Volume (K Unit) Forecast, by Application 2019 & 2032
- Table 91: Rest of Europe Chlamydia Infections Industry Revenue (Billion) Forecast, by Application 2019 & 2032
- Table 92: Rest of Europe Chlamydia Infections Industry Volume (K Unit) Forecast, by Application 2019 & 2032
- Table 93: Global Chlamydia Infections Industry Revenue Billion Forecast, by Test Type 2019 & 2032
- Table 94: Global Chlamydia Infections Industry Volume K Unit Forecast, by Test Type 2019 & 2032
- Table 95: Global Chlamydia Infections Industry Revenue Billion Forecast, by End User 2019 & 2032
- Table 96: Global Chlamydia Infections Industry Volume K Unit Forecast, by End User 2019 & 2032
- Table 97: Global Chlamydia Infections Industry Revenue Billion Forecast, by Country 2019 & 2032
- Table 98: Global Chlamydia Infections Industry Volume K Unit Forecast, by Country 2019 & 2032
- Table 99: China Chlamydia Infections Industry Revenue (Billion) Forecast, by Application 2019 & 2032
- Table 100: China Chlamydia Infections Industry Volume (K Unit) Forecast, by Application 2019 & 2032
- Table 101: Japan Chlamydia Infections Industry Revenue (Billion) Forecast, by Application 2019 & 2032
- Table 102: Japan Chlamydia Infections Industry Volume (K Unit) Forecast, by Application 2019 & 2032
- Table 103: India Chlamydia Infections Industry Revenue (Billion) Forecast, by Application 2019 & 2032
- Table 104: India Chlamydia Infections Industry Volume (K Unit) Forecast, by Application 2019 & 2032
- Table 105: Australia Chlamydia Infections Industry Revenue (Billion) Forecast, by Application 2019 & 2032
- Table 106: Australia Chlamydia Infections Industry Volume (K Unit) Forecast, by Application 2019 & 2032
- Table 107: South Korea Chlamydia Infections Industry Revenue (Billion) Forecast, by Application 2019 & 2032
- Table 108: South Korea Chlamydia Infections Industry Volume (K Unit) Forecast, by Application 2019 & 2032
- Table 109: Rest of Asia Pacific Chlamydia Infections Industry Revenue (Billion) Forecast, by Application 2019 & 2032
- Table 110: Rest of Asia Pacific Chlamydia Infections Industry Volume (K Unit) Forecast, by Application 2019 & 2032
- Table 111: Global Chlamydia Infections Industry Revenue Billion Forecast, by Test Type 2019 & 2032
- Table 112: Global Chlamydia Infections Industry Volume K Unit Forecast, by Test Type 2019 & 2032
- Table 113: Global Chlamydia Infections Industry Revenue Billion Forecast, by End User 2019 & 2032
- Table 114: Global Chlamydia Infections Industry Volume K Unit Forecast, by End User 2019 & 2032
- Table 115: Global Chlamydia Infections Industry Revenue Billion Forecast, by Country 2019 & 2032
- Table 116: Global Chlamydia Infections Industry Volume K Unit Forecast, by Country 2019 & 2032
- Table 117: GCC Chlamydia Infections Industry Revenue (Billion) Forecast, by Application 2019 & 2032
- Table 118: GCC Chlamydia Infections Industry Volume (K Unit) Forecast, by Application 2019 & 2032
- Table 119: South Africa Chlamydia Infections Industry Revenue (Billion) Forecast, by Application 2019 & 2032
- Table 120: South Africa Chlamydia Infections Industry Volume (K Unit) Forecast, by Application 2019 & 2032
- Table 121: Rest of Middle East and Africa Chlamydia Infections Industry Revenue (Billion) Forecast, by Application 2019 & 2032
- Table 122: Rest of Middle East and Africa Chlamydia Infections Industry Volume (K Unit) Forecast, by Application 2019 & 2032
- Table 123: Global Chlamydia Infections Industry Revenue Billion Forecast, by Test Type 2019 & 2032
- Table 124: Global Chlamydia Infections Industry Volume K Unit Forecast, by Test Type 2019 & 2032
- Table 125: Global Chlamydia Infections Industry Revenue Billion Forecast, by End User 2019 & 2032
- Table 126: Global Chlamydia Infections Industry Volume K Unit Forecast, by End User 2019 & 2032
- Table 127: Global Chlamydia Infections Industry Revenue Billion Forecast, by Country 2019 & 2032
- Table 128: Global Chlamydia Infections Industry Volume K Unit Forecast, by Country 2019 & 2032
- Table 129: Brazil Chlamydia Infections Industry Revenue (Billion) Forecast, by Application 2019 & 2032
- Table 130: Brazil Chlamydia Infections Industry Volume (K Unit) Forecast, by Application 2019 & 2032
- Table 131: Argentina Chlamydia Infections Industry Revenue (Billion) Forecast, by Application 2019 & 2032
- Table 132: Argentina Chlamydia Infections Industry Volume (K Unit) Forecast, by Application 2019 & 2032
- Table 133: Rest of South America Chlamydia Infections Industry Revenue (Billion) Forecast, by Application 2019 & 2032
- Table 134: Rest of South America Chlamydia Infections Industry Volume (K Unit) Forecast, by Application 2019 & 2032
Frequently Asked Questions
1. What is the projected Compound Annual Growth Rate (CAGR) of the Chlamydia Infections Industry?
The projected CAGR is approximately 8.50%.
2. Which companies are prominent players in the Chlamydia Infections Industry?
Key companies in the market include Becton Dickinson and Company, Danaher Corporation (Cepheid), Quidel Corporation, DiaSorin SpA, Bio-Rad Laboratories Inc, Laxai Pharma Ltd (Savyon Diagnostics Ltd), F Hoffmann-La Roche Ltd, Hologic Inc, Abbott Laboratories, Trinity Biotech Plc.
3. What are the main segments of the Chlamydia Infections Industry?
The market segments include Test Type, End User.
4. Can you provide details about the market size?
The market size is estimated to be USD 4.1 Billion as of 2022.
5. What are some drivers contributing to market growth?
Increasing Prevalence Rate of Chlamydia Infection; Increasing Initiatives for Chlamydia Testing and Product Innovation.
6. What are the notable trends driving market growth?
Nucleic Acid Amplification Test (NAAT) Based Tests Dominates the Chlamydia Infection Diagnostics Market.
7. Are there any restraints impacting market growth?
Social Stigma Associated with Patients Visiting Specialized STD Clinics; Huge Proportion of Patients Infected with Chlamydia in Out-of-reach Geographic Areas.
8. Can you provide examples of recent developments in the market?
In May 2022, Becton, Dickinson, and Company launched a fully automated, high-throughput infectious disease molecular diagnostics platform in the United States. The BD COR MX instrument is a new analytic instrument option for the BD COR System. The first test available on the new BD COR MX system is the BD CTGCTV2 molecular assay, a single test that detects the three most prevalent non-viral sexually transmitted infections, Chlamydia trachomatis, Neisseria gonorrhoeae, and Trichomonas vaginalis.
9. What pricing options are available for accessing the report?
Pricing options include single-user, multi-user, and enterprise licenses priced at USD 4750, USD 5250, and USD 8750 respectively.
10. Is the market size provided in terms of value or volume?
The market size is provided in terms of value, measured in Billion and volume, measured in K Unit.
11. Are there any specific market keywords associated with the report?
Yes, the market keyword associated with the report is "Chlamydia Infections Industry," which aids in identifying and referencing the specific market segment covered.
12. How do I determine which pricing option suits my needs best?
The pricing options vary based on user requirements and access needs. Individual users may opt for single-user licenses, while businesses requiring broader access may choose multi-user or enterprise licenses for cost-effective access to the report.
13. Are there any additional resources or data provided in the Chlamydia Infections Industry report?
While the report offers comprehensive insights, it's advisable to review the specific contents or supplementary materials provided to ascertain if additional resources or data are available.
14. How can I stay updated on further developments or reports in the Chlamydia Infections Industry?
To stay informed about further developments, trends, and reports in the Chlamydia Infections Industry, consider subscribing to industry newsletters, following relevant companies and organizations, or regularly checking reputable industry news sources and publications.
Methodology
Step 1 - Identification of Relevant Samples Size from Population Database


Step 2 - Approaches for Defining Global Market Size (Value, Volume* & Price*)

Note*: In applicable scenarios
Step 3 - Data Sources
Primary Research
- Web Analytics
- Survey Reports
- Research Institute
- Latest Research Reports
- Opinion Leaders
Secondary Research
- Annual Reports
- White Paper
- Latest Press Release
- Industry Association
- Paid Database
- Investor Presentations

Step 4 - Data Triangulation
Involves using different sources of information in order to increase the validity of a study
These sources are likely to be stakeholders in a program - participants, other researchers, program staff, other community members, and so on.
Then we put all data in single framework & apply various statistical tools to find out the dynamic on the market.
During the analysis stage, feedback from the stakeholder groups would be compared to determine areas of agreement as well as areas of divergence


