
Key Insights
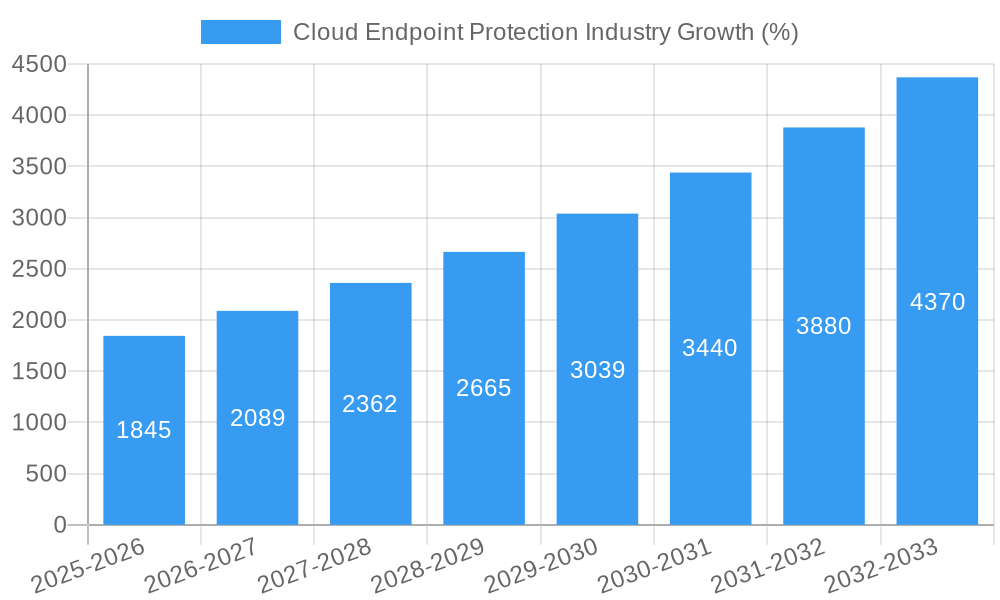
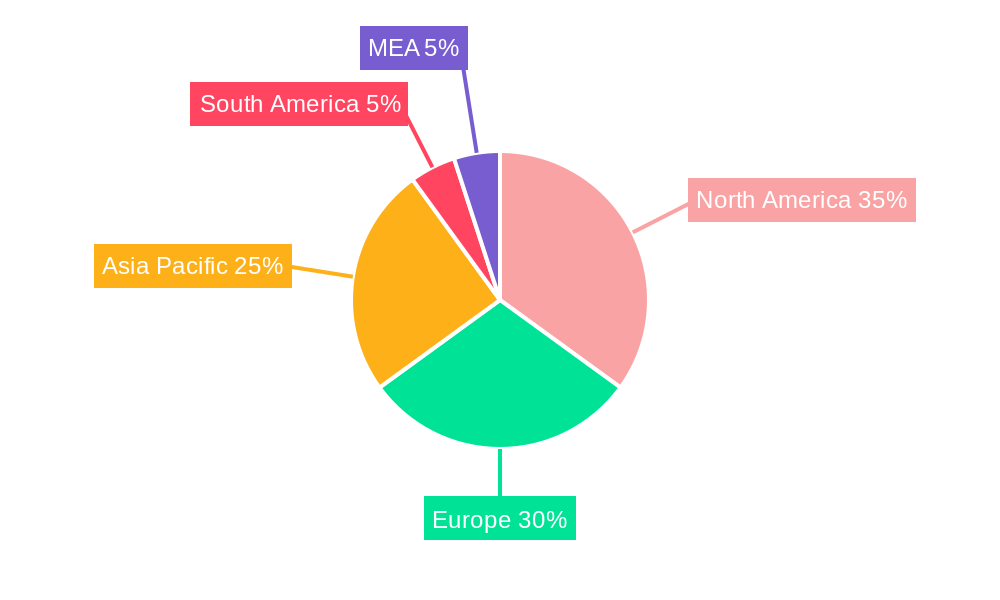
The cloud endpoint protection market is experiencing robust growth, driven by the increasing adoption of cloud-based services and the rising need for robust cybersecurity solutions in a distributed work environment. The market's Compound Annual Growth Rate (CAGR) of 12.30% from 2019 to 2024 indicates a significant expansion, projected to continue through 2033. Several factors contribute to this growth, including the proliferation of sophisticated cyber threats, stringent data privacy regulations (like GDPR), and the increasing reliance on remote work models. The market is segmented by enterprise size (SMEs and large enterprises), deployment model (private, public, and hybrid cloud), and end-user industry (BFSI, government, healthcare, energy, retail, IT & Telecom, and others). Large enterprises are currently the largest segment due to their greater IT budgets and higher vulnerability surface, but SMEs are expected to show significant growth due to increased awareness of cyber risks and the affordability of cloud-based solutions. The shift towards hybrid cloud deployments presents a particularly lucrative avenue for vendors, offering flexibility and enhanced security for organizations with diverse IT infrastructure. Geographical expansion is also a key driver, with North America and Europe currently holding significant market share, while Asia-Pacific is anticipated to experience substantial growth in the coming years due to rapid digitalization and expanding internet penetration. Competitive pressures among established players (Trend Micro, VMware, Kaspersky, Bitdefender, Avast, Fortinet, McAfee, CrowdStrike, Cisco, Microsoft, SentinelOne, Sophos, and Broadcom/Symantec) are driving innovation and the development of more sophisticated and cost-effective solutions.
The restraining factors include the complexity of integrating cloud endpoint protection solutions with existing IT infrastructures, concerns about data security and privacy in the cloud, and the potential for skill gaps in managing these sophisticated systems. However, the benefits of improved security posture, reduced IT management overhead, and enhanced scalability are overriding these concerns. The future trajectory of the market is expected to be shaped by advancements in artificial intelligence (AI) and machine learning (ML) for threat detection, the emergence of extended detection and response (XDR) capabilities, and the increasing importance of zero trust security frameworks. The continued focus on regulatory compliance will also play a significant role, driving demand for solutions that meet stringent data protection standards. Therefore, the long-term outlook for the cloud endpoint protection market remains exceptionally positive, with substantial opportunities for growth and innovation in the years ahead. Specific market size estimations for future years require access to more granular sales data, however the 12.30% CAGR provides a strong foundation for informed projection.
Cloud Endpoint Protection Industry Report: 2019-2033
This comprehensive report offers a detailed analysis of the Cloud Endpoint Protection industry, providing actionable insights for industry professionals and strategic decision-makers. With a study period spanning 2019-2033, a base year of 2025, and an estimated and forecast period of 2025-2033, this report covers historical data (2019-2024) and projects future market trends. The report analyzes market dynamics, identifies key players, and explores emerging opportunities within this rapidly evolving sector. The total market size is projected to reach xx Million by 2033.
Cloud Endpoint Protection Industry Market Structure & Innovation Trends
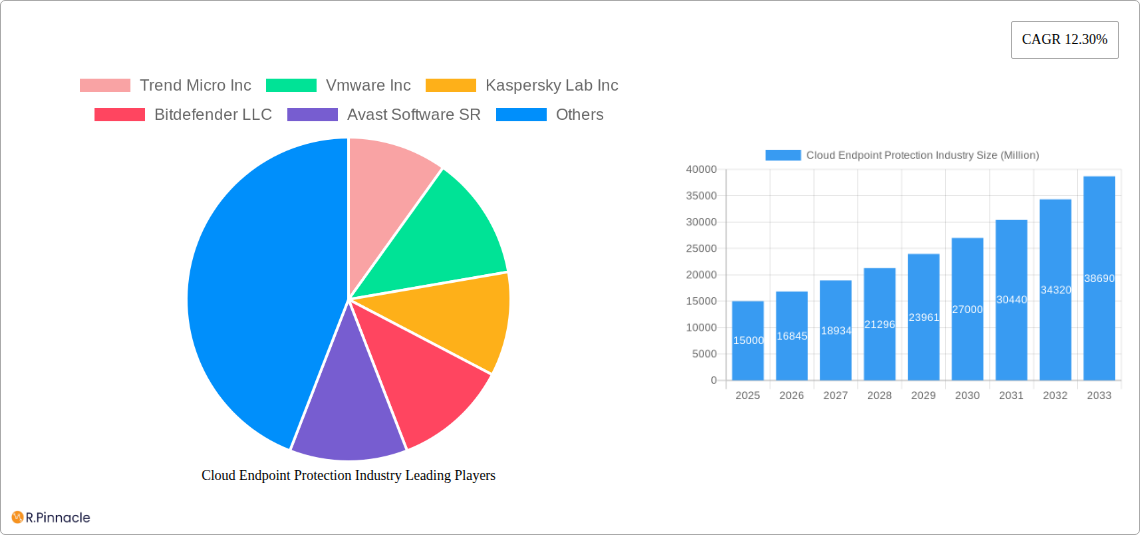
This section analyzes the competitive landscape, focusing on market concentration, innovation drivers, regulatory frameworks, and M&A activities within the Cloud Endpoint Protection market. The industry is characterized by a moderately concentrated market structure with several major players holding significant market share.
Market Concentration: The top 5 companies – Trend Micro Inc, VMware Inc, Kaspersky Lab Inc, Bitdefender LLC, and Avast Software SR – collectively hold an estimated xx% market share in 2025. This signifies a moderately competitive market with opportunities for both established players and emerging competitors.
Innovation Drivers: The primary innovation drivers include advancements in artificial intelligence (AI), machine learning (ML), and automation in threat detection and response. The growing adoption of cloud-native security solutions and the increasing sophistication of cyber threats also fuels innovation.
Regulatory Frameworks: Compliance requirements like GDPR, CCPA, and others significantly influence the market. Companies are investing heavily in solutions that ensure data privacy and regulatory compliance, driving adoption.
M&A Activities: The Cloud Endpoint Protection market has witnessed significant M&A activity in recent years, with deal values exceeding xx Million in the period between 2019 and 2024. This consolidation reflects the industry's ongoing evolution and the pursuit of enhanced capabilities and market reach. Examples include [Specific examples of M&A activity with deal values if available, otherwise use predicted values and explain the motivation behind the acquisitions.].
End-User Demographics: The market is segmented by enterprise size (Small & Medium Enterprises, Large Enterprises) and industry (BFSI, Government, Healthcare, Energy and Power, Retail, IT & Telecom, Other). Large enterprises represent a larger market share due to higher security budgets and complex IT infrastructure.
Cloud Endpoint Protection Industry Market Dynamics & Trends
This section details the factors driving market growth, technological disruptions, and competitive dynamics. The Cloud Endpoint Protection market is experiencing robust growth, driven by the increasing adoption of cloud services, the rise of remote work, and the escalating frequency and severity of cyberattacks.
The Compound Annual Growth Rate (CAGR) during the forecast period (2025-2033) is projected to be xx%, indicating substantial market expansion. Market penetration is expected to increase from xx% in 2025 to xx% by 2033, reflecting the widespread adoption of cloud-based security solutions across various industries. Several key factors contribute to this growth:
Increased Cloud Adoption: Organizations are rapidly migrating to cloud environments, creating a surge in demand for cloud-based endpoint protection solutions.
Rise of Remote Work: The shift toward remote work models has expanded the attack surface, necessitating robust endpoint protection measures across diverse locations and devices.
Sophistication of Cyberattacks: The ever-evolving nature of cyber threats necessitates advanced security solutions capable of countering increasingly complex attacks.
Enhanced Security Awareness: Growing awareness of cybersecurity risks among businesses and individuals is driving the demand for proactive and effective security measures.
Technological Advancements: AI, ML, and automation are enhancing the capabilities of endpoint protection solutions, making them more effective and efficient.
Dominant Regions & Segments in Cloud Endpoint Protection Industry
This section identifies leading regions and segments within the Cloud Endpoint Protection market. [Specific data on leading regions and segments would be included here, with details on market size, growth drivers, and competitive dynamics in each region and segment. Examples of specific drivers are included below.]
By Enterprise Size: Large enterprises dominate the market due to higher budgets and greater security concerns.
By Deployment Model: The Public Cloud segment is exhibiting the highest growth rate owing to the increasing adoption of cloud-based services.
By End-user Industry: The BFSI (Banking, Financial Services, and Insurance) sector holds a significant market share due to stringent regulatory compliance and sensitive data protection requirements.
Regional Dominance: [Specific details about leading regions, e.g., North America, Europe, Asia-Pacific, etc., mentioning factors such as economic development, technological advancements, regulatory environments, and market maturity]. Key Drivers for Specific Regions (examples): North America – strong tech infrastructure and high cybersecurity awareness; Asia-Pacific – rapid economic growth and increasing digitalization; Europe – stringent data protection regulations.
Cloud Endpoint Protection Industry Product Innovations
The Cloud Endpoint Protection market is witnessing rapid product innovation, driven by advancements in AI, ML, and automation. New solutions offer improved threat detection, response, and prevention capabilities. These innovations include enhanced threat intelligence, automated incident response, and seamless integration with other security tools. This enables proactive security posture management and facilitates better risk mitigation. Features like behavioral analysis and advanced threat hunting are differentiating factors, providing superior protection against sophisticated attacks. The market is moving toward more comprehensive solutions that integrate endpoint protection with other security services, creating a unified security platform.
Report Scope & Segmentation Analysis
This report segments the Cloud Endpoint Protection market by enterprise size (Small & Medium Enterprises, Large Enterprises), deployment model (Private Cloud, Public Cloud, Hybrid Cloud), and end-user industry (BFSI, Government, Healthcare, Energy and Power, Retail, IT & Telecom, Other). Each segment's growth projections, market size, and competitive landscape are analyzed. [Specific data on market size and growth projections for each segment would be included here].
Key Drivers of Cloud Endpoint Protection Industry Growth
The growth of the Cloud Endpoint Protection market is fueled by several key factors. The increasing adoption of cloud computing and the rising prevalence of remote work necessitate robust endpoint security solutions. Furthermore, the ever-growing sophistication of cyberattacks, along with heightened regulatory compliance requirements, drives demand for advanced protection technologies. Economic growth, particularly in developing economies, also contributes to market expansion as businesses invest in digital infrastructure and cybersecurity.
Challenges in the Cloud Endpoint Protection Industry Sector
Several challenges hinder the growth of the Cloud Endpoint Protection industry. The complexity of managing security across diverse cloud environments and the difficulty in keeping pace with rapidly evolving threats pose significant hurdles. The lack of skilled cybersecurity professionals and the high cost of implementing and maintaining advanced security solutions also restrict market growth. Regulatory compliance requirements, while necessary, can also present challenges for businesses. Supply chain vulnerabilities can also contribute to challenges.
Emerging Opportunities in Cloud Endpoint Protection Industry
The Cloud Endpoint Protection market presents significant opportunities for growth. The expansion of cloud computing to new industries and geographies, the increasing adoption of IoT devices, and the development of advanced security technologies like AI and ML create new avenues for market expansion. Opportunities also exist in developing solutions that address specific industry-related security needs and in expanding the market to small and medium-sized enterprises (SMEs), which currently have lower adoption rates. The creation of proactive security solutions will also help meet the growing need for early threat detection and response.
Leading Players in the Cloud Endpoint Protection Industry Market
- Trend Micro Inc
- Vmware Inc
- Kaspersky Lab Inc
- Bitdefender LLC
- Avast Software SR
- Fortinet Inc
- McAfee LLC
- CrowdStrike Holdings Inc
- Cisco Systems Inc
- Microsoft Corporation
- SentinelOne Inc
- Sophos Group PLC
- Broadcom Inc (Symantec Corporation)
Key Developments in Cloud Endpoint Protection Industry
- [Year/Month]: [Specific development, e.g., Launch of a new AI-powered threat detection solution by Company X]
- [Year/Month]: [Specific development, e.g., Acquisition of Company Y by Company Z]
- [Year/Month]: [Specific development, e.g., Release of a major security update addressing vulnerability X]
- [Continue adding key developments with year/month and a brief description of the impact.]
Future Outlook for Cloud Endpoint Protection Industry Market
The future of the Cloud Endpoint Protection market is bright. The ongoing adoption of cloud services, the increasing complexity of cyber threats, and advancements in security technologies will drive continued market growth. Strategic opportunities lie in developing innovative solutions that leverage AI, ML, and automation to provide comprehensive and proactive security. Furthermore, focusing on integrating endpoint protection with other security services and expanding market reach into new industries and regions will be crucial for success. The market is poised for substantial growth and presents significant opportunities for both established players and new entrants.
Cloud Endpoint Protection Industry Segmentation
-
1. Enterprise Size
- 1.1. Small & Medium Enterprises
- 1.2. Large Enterprises
-
2. Deployment Model
- 2.1. Private Cloud
- 2.2. Public Cloud
- 2.3. Hybrid Cloud
-
3. End-user Industry
- 3.1. BFSI
- 3.2. Government
- 3.3. Healthcare
- 3.4. Energy and Power
- 3.5. Retail
- 3.6. IT & Telecom
- 3.7. Other End-user Industry
Cloud Endpoint Protection Industry Segmentation By Geography
- 1. North America
- 2. Europe
- 3. Asia Pacific
- 4. Latin America
- 5. Middle East and Africa
Cloud Endpoint Protection Industry REPORT HIGHLIGHTS
| Aspects | Details |
|---|---|
| Study Period | 2019-2033 |
| Base Year | 2024 |
| Estimated Year | 2025 |
| Forecast Period | 2025-2033 |
| Historical Period | 2019-2024 |
| Growth Rate | CAGR of 12.30% from 2019-2033 |
| Segmentation |
|
Table of Contents
- 1. Introduction
- 1.1. Research Scope
- 1.2. Market Segmentation
- 1.3. Research Methodology
- 1.4. Definitions and Assumptions
- 2. Executive Summary
- 2.1. Introduction
- 3. Market Dynamics
- 3.1. Introduction
- 3.2. Market Drivers
- 3.2.1. ; Growth of Smart Devices; Increasing number of Data Breaches
- 3.3. Market Restrains
- 3.3.1. ; Lack of Awareness about Cyberattacks
- 3.4. Market Trends
- 3.4.1. Healthcare Segment is Expected to Witness Significant Growth
- 4. Market Factor Analysis
- 4.1. Porters Five Forces
- 4.2. Supply/Value Chain
- 4.3. PESTEL analysis
- 4.4. Market Entropy
- 4.5. Patent/Trademark Analysis
- 5. Global Cloud Endpoint Protection Industry Analysis, Insights and Forecast, 2019-2031
- 5.1. Market Analysis, Insights and Forecast - by Enterprise Size
- 5.1.1. Small & Medium Enterprises
- 5.1.2. Large Enterprises
- 5.2. Market Analysis, Insights and Forecast - by Deployment Model
- 5.2.1. Private Cloud
- 5.2.2. Public Cloud
- 5.2.3. Hybrid Cloud
- 5.3. Market Analysis, Insights and Forecast - by End-user Industry
- 5.3.1. BFSI
- 5.3.2. Government
- 5.3.3. Healthcare
- 5.3.4. Energy and Power
- 5.3.5. Retail
- 5.3.6. IT & Telecom
- 5.3.7. Other End-user Industry
- 5.4. Market Analysis, Insights and Forecast - by Region
- 5.4.1. North America
- 5.4.2. Europe
- 5.4.3. Asia Pacific
- 5.4.4. Latin America
- 5.4.5. Middle East and Africa
- 5.1. Market Analysis, Insights and Forecast - by Enterprise Size
- 6. North America Cloud Endpoint Protection Industry Analysis, Insights and Forecast, 2019-2031
- 6.1. Market Analysis, Insights and Forecast - by Enterprise Size
- 6.1.1. Small & Medium Enterprises
- 6.1.2. Large Enterprises
- 6.2. Market Analysis, Insights and Forecast - by Deployment Model
- 6.2.1. Private Cloud
- 6.2.2. Public Cloud
- 6.2.3. Hybrid Cloud
- 6.3. Market Analysis, Insights and Forecast - by End-user Industry
- 6.3.1. BFSI
- 6.3.2. Government
- 6.3.3. Healthcare
- 6.3.4. Energy and Power
- 6.3.5. Retail
- 6.3.6. IT & Telecom
- 6.3.7. Other End-user Industry
- 6.1. Market Analysis, Insights and Forecast - by Enterprise Size
- 7. Europe Cloud Endpoint Protection Industry Analysis, Insights and Forecast, 2019-2031
- 7.1. Market Analysis, Insights and Forecast - by Enterprise Size
- 7.1.1. Small & Medium Enterprises
- 7.1.2. Large Enterprises
- 7.2. Market Analysis, Insights and Forecast - by Deployment Model
- 7.2.1. Private Cloud
- 7.2.2. Public Cloud
- 7.2.3. Hybrid Cloud
- 7.3. Market Analysis, Insights and Forecast - by End-user Industry
- 7.3.1. BFSI
- 7.3.2. Government
- 7.3.3. Healthcare
- 7.3.4. Energy and Power
- 7.3.5. Retail
- 7.3.6. IT & Telecom
- 7.3.7. Other End-user Industry
- 7.1. Market Analysis, Insights and Forecast - by Enterprise Size
- 8. Asia Pacific Cloud Endpoint Protection Industry Analysis, Insights and Forecast, 2019-2031
- 8.1. Market Analysis, Insights and Forecast - by Enterprise Size
- 8.1.1. Small & Medium Enterprises
- 8.1.2. Large Enterprises
- 8.2. Market Analysis, Insights and Forecast - by Deployment Model
- 8.2.1. Private Cloud
- 8.2.2. Public Cloud
- 8.2.3. Hybrid Cloud
- 8.3. Market Analysis, Insights and Forecast - by End-user Industry
- 8.3.1. BFSI
- 8.3.2. Government
- 8.3.3. Healthcare
- 8.3.4. Energy and Power
- 8.3.5. Retail
- 8.3.6. IT & Telecom
- 8.3.7. Other End-user Industry
- 8.1. Market Analysis, Insights and Forecast - by Enterprise Size
- 9. Latin America Cloud Endpoint Protection Industry Analysis, Insights and Forecast, 2019-2031
- 9.1. Market Analysis, Insights and Forecast - by Enterprise Size
- 9.1.1. Small & Medium Enterprises
- 9.1.2. Large Enterprises
- 9.2. Market Analysis, Insights and Forecast - by Deployment Model
- 9.2.1. Private Cloud
- 9.2.2. Public Cloud
- 9.2.3. Hybrid Cloud
- 9.3. Market Analysis, Insights and Forecast - by End-user Industry
- 9.3.1. BFSI
- 9.3.2. Government
- 9.3.3. Healthcare
- 9.3.4. Energy and Power
- 9.3.5. Retail
- 9.3.6. IT & Telecom
- 9.3.7. Other End-user Industry
- 9.1. Market Analysis, Insights and Forecast - by Enterprise Size
- 10. Middle East and Africa Cloud Endpoint Protection Industry Analysis, Insights and Forecast, 2019-2031
- 10.1. Market Analysis, Insights and Forecast - by Enterprise Size
- 10.1.1. Small & Medium Enterprises
- 10.1.2. Large Enterprises
- 10.2. Market Analysis, Insights and Forecast - by Deployment Model
- 10.2.1. Private Cloud
- 10.2.2. Public Cloud
- 10.2.3. Hybrid Cloud
- 10.3. Market Analysis, Insights and Forecast - by End-user Industry
- 10.3.1. BFSI
- 10.3.2. Government
- 10.3.3. Healthcare
- 10.3.4. Energy and Power
- 10.3.5. Retail
- 10.3.6. IT & Telecom
- 10.3.7. Other End-user Industry
- 10.1. Market Analysis, Insights and Forecast - by Enterprise Size
- 11. North America Cloud Endpoint Protection Industry Analysis, Insights and Forecast, 2019-2031
- 11.1. Market Analysis, Insights and Forecast - By Country/Sub-region
- 11.1.1 United States
- 11.1.2 Canada
- 11.1.3 Mexico
- 12. Europe Cloud Endpoint Protection Industry Analysis, Insights and Forecast, 2019-2031
- 12.1. Market Analysis, Insights and Forecast - By Country/Sub-region
- 12.1.1 Germany
- 12.1.2 United Kingdom
- 12.1.3 France
- 12.1.4 Spain
- 12.1.5 Italy
- 12.1.6 Spain
- 12.1.7 Belgium
- 12.1.8 Netherland
- 12.1.9 Nordics
- 12.1.10 Rest of Europe
- 13. Asia Pacific Cloud Endpoint Protection Industry Analysis, Insights and Forecast, 2019-2031
- 13.1. Market Analysis, Insights and Forecast - By Country/Sub-region
- 13.1.1 China
- 13.1.2 Japan
- 13.1.3 India
- 13.1.4 South Korea
- 13.1.5 Southeast Asia
- 13.1.6 Australia
- 13.1.7 Indonesia
- 13.1.8 Phillipes
- 13.1.9 Singapore
- 13.1.10 Thailandc
- 13.1.11 Rest of Asia Pacific
- 14. South America Cloud Endpoint Protection Industry Analysis, Insights and Forecast, 2019-2031
- 14.1. Market Analysis, Insights and Forecast - By Country/Sub-region
- 14.1.1 Brazil
- 14.1.2 Argentina
- 14.1.3 Peru
- 14.1.4 Chile
- 14.1.5 Colombia
- 14.1.6 Ecuador
- 14.1.7 Venezuela
- 14.1.8 Rest of South America
- 15. North America Cloud Endpoint Protection Industry Analysis, Insights and Forecast, 2019-2031
- 15.1. Market Analysis, Insights and Forecast - By Country/Sub-region
- 15.1.1 United States
- 15.1.2 Canada
- 15.1.3 Mexico
- 16. MEA Cloud Endpoint Protection Industry Analysis, Insights and Forecast, 2019-2031
- 16.1. Market Analysis, Insights and Forecast - By Country/Sub-region
- 16.1.1 United Arab Emirates
- 16.1.2 Saudi Arabia
- 16.1.3 South Africa
- 16.1.4 Rest of Middle East and Africa
- 17. Competitive Analysis
- 17.1. Global Market Share Analysis 2024
- 17.2. Company Profiles
- 17.2.1 Trend Micro Inc
- 17.2.1.1. Overview
- 17.2.1.2. Products
- 17.2.1.3. SWOT Analysis
- 17.2.1.4. Recent Developments
- 17.2.1.5. Financials (Based on Availability)
- 17.2.2 Vmware Inc
- 17.2.2.1. Overview
- 17.2.2.2. Products
- 17.2.2.3. SWOT Analysis
- 17.2.2.4. Recent Developments
- 17.2.2.5. Financials (Based on Availability)
- 17.2.3 Kaspersky Lab Inc
- 17.2.3.1. Overview
- 17.2.3.2. Products
- 17.2.3.3. SWOT Analysis
- 17.2.3.4. Recent Developments
- 17.2.3.5. Financials (Based on Availability)
- 17.2.4 Bitdefender LLC
- 17.2.4.1. Overview
- 17.2.4.2. Products
- 17.2.4.3. SWOT Analysis
- 17.2.4.4. Recent Developments
- 17.2.4.5. Financials (Based on Availability)
- 17.2.5 Avast Software SR
- 17.2.5.1. Overview
- 17.2.5.2. Products
- 17.2.5.3. SWOT Analysis
- 17.2.5.4. Recent Developments
- 17.2.5.5. Financials (Based on Availability)
- 17.2.6 Fortinet Inc
- 17.2.6.1. Overview
- 17.2.6.2. Products
- 17.2.6.3. SWOT Analysis
- 17.2.6.4. Recent Developments
- 17.2.6.5. Financials (Based on Availability)
- 17.2.7 McAfee LLC
- 17.2.7.1. Overview
- 17.2.7.2. Products
- 17.2.7.3. SWOT Analysis
- 17.2.7.4. Recent Developments
- 17.2.7.5. Financials (Based on Availability)
- 17.2.8 CrowdStrike Holdings Inc
- 17.2.8.1. Overview
- 17.2.8.2. Products
- 17.2.8.3. SWOT Analysis
- 17.2.8.4. Recent Developments
- 17.2.8.5. Financials (Based on Availability)
- 17.2.9 Cisco Systems Inc
- 17.2.9.1. Overview
- 17.2.9.2. Products
- 17.2.9.3. SWOT Analysis
- 17.2.9.4. Recent Developments
- 17.2.9.5. Financials (Based on Availability)
- 17.2.10 Microsoft Corporation
- 17.2.10.1. Overview
- 17.2.10.2. Products
- 17.2.10.3. SWOT Analysis
- 17.2.10.4. Recent Developments
- 17.2.10.5. Financials (Based on Availability)
- 17.2.11 SentinelOne Inc
- 17.2.11.1. Overview
- 17.2.11.2. Products
- 17.2.11.3. SWOT Analysis
- 17.2.11.4. Recent Developments
- 17.2.11.5. Financials (Based on Availability)
- 17.2.12 Sophos Group PLC
- 17.2.12.1. Overview
- 17.2.12.2. Products
- 17.2.12.3. SWOT Analysis
- 17.2.12.4. Recent Developments
- 17.2.12.5. Financials (Based on Availability)
- 17.2.13 Broadcom Inc (Symantec Corporation)
- 17.2.13.1. Overview
- 17.2.13.2. Products
- 17.2.13.3. SWOT Analysis
- 17.2.13.4. Recent Developments
- 17.2.13.5. Financials (Based on Availability)
- 17.2.1 Trend Micro Inc
List of Figures
- Figure 1: Global Cloud Endpoint Protection Industry Revenue Breakdown (Million, %) by Region 2024 & 2032
- Figure 2: Global Cloud Endpoint Protection Industry Volume Breakdown (K Unit, %) by Region 2024 & 2032
- Figure 3: North America Cloud Endpoint Protection Industry Revenue (Million), by Country 2024 & 2032
- Figure 4: North America Cloud Endpoint Protection Industry Volume (K Unit), by Country 2024 & 2032
- Figure 5: North America Cloud Endpoint Protection Industry Revenue Share (%), by Country 2024 & 2032
- Figure 6: North America Cloud Endpoint Protection Industry Volume Share (%), by Country 2024 & 2032
- Figure 7: Europe Cloud Endpoint Protection Industry Revenue (Million), by Country 2024 & 2032
- Figure 8: Europe Cloud Endpoint Protection Industry Volume (K Unit), by Country 2024 & 2032
- Figure 9: Europe Cloud Endpoint Protection Industry Revenue Share (%), by Country 2024 & 2032
- Figure 10: Europe Cloud Endpoint Protection Industry Volume Share (%), by Country 2024 & 2032
- Figure 11: Asia Pacific Cloud Endpoint Protection Industry Revenue (Million), by Country 2024 & 2032
- Figure 12: Asia Pacific Cloud Endpoint Protection Industry Volume (K Unit), by Country 2024 & 2032
- Figure 13: Asia Pacific Cloud Endpoint Protection Industry Revenue Share (%), by Country 2024 & 2032
- Figure 14: Asia Pacific Cloud Endpoint Protection Industry Volume Share (%), by Country 2024 & 2032
- Figure 15: South America Cloud Endpoint Protection Industry Revenue (Million), by Country 2024 & 2032
- Figure 16: South America Cloud Endpoint Protection Industry Volume (K Unit), by Country 2024 & 2032
- Figure 17: South America Cloud Endpoint Protection Industry Revenue Share (%), by Country 2024 & 2032
- Figure 18: South America Cloud Endpoint Protection Industry Volume Share (%), by Country 2024 & 2032
- Figure 19: North America Cloud Endpoint Protection Industry Revenue (Million), by Country 2024 & 2032
- Figure 20: North America Cloud Endpoint Protection Industry Volume (K Unit), by Country 2024 & 2032
- Figure 21: North America Cloud Endpoint Protection Industry Revenue Share (%), by Country 2024 & 2032
- Figure 22: North America Cloud Endpoint Protection Industry Volume Share (%), by Country 2024 & 2032
- Figure 23: MEA Cloud Endpoint Protection Industry Revenue (Million), by Country 2024 & 2032
- Figure 24: MEA Cloud Endpoint Protection Industry Volume (K Unit), by Country 2024 & 2032
- Figure 25: MEA Cloud Endpoint Protection Industry Revenue Share (%), by Country 2024 & 2032
- Figure 26: MEA Cloud Endpoint Protection Industry Volume Share (%), by Country 2024 & 2032
- Figure 27: North America Cloud Endpoint Protection Industry Revenue (Million), by Enterprise Size 2024 & 2032
- Figure 28: North America Cloud Endpoint Protection Industry Volume (K Unit), by Enterprise Size 2024 & 2032
- Figure 29: North America Cloud Endpoint Protection Industry Revenue Share (%), by Enterprise Size 2024 & 2032
- Figure 30: North America Cloud Endpoint Protection Industry Volume Share (%), by Enterprise Size 2024 & 2032
- Figure 31: North America Cloud Endpoint Protection Industry Revenue (Million), by Deployment Model 2024 & 2032
- Figure 32: North America Cloud Endpoint Protection Industry Volume (K Unit), by Deployment Model 2024 & 2032
- Figure 33: North America Cloud Endpoint Protection Industry Revenue Share (%), by Deployment Model 2024 & 2032
- Figure 34: North America Cloud Endpoint Protection Industry Volume Share (%), by Deployment Model 2024 & 2032
- Figure 35: North America Cloud Endpoint Protection Industry Revenue (Million), by End-user Industry 2024 & 2032
- Figure 36: North America Cloud Endpoint Protection Industry Volume (K Unit), by End-user Industry 2024 & 2032
- Figure 37: North America Cloud Endpoint Protection Industry Revenue Share (%), by End-user Industry 2024 & 2032
- Figure 38: North America Cloud Endpoint Protection Industry Volume Share (%), by End-user Industry 2024 & 2032
- Figure 39: North America Cloud Endpoint Protection Industry Revenue (Million), by Country 2024 & 2032
- Figure 40: North America Cloud Endpoint Protection Industry Volume (K Unit), by Country 2024 & 2032
- Figure 41: North America Cloud Endpoint Protection Industry Revenue Share (%), by Country 2024 & 2032
- Figure 42: North America Cloud Endpoint Protection Industry Volume Share (%), by Country 2024 & 2032
- Figure 43: Europe Cloud Endpoint Protection Industry Revenue (Million), by Enterprise Size 2024 & 2032
- Figure 44: Europe Cloud Endpoint Protection Industry Volume (K Unit), by Enterprise Size 2024 & 2032
- Figure 45: Europe Cloud Endpoint Protection Industry Revenue Share (%), by Enterprise Size 2024 & 2032
- Figure 46: Europe Cloud Endpoint Protection Industry Volume Share (%), by Enterprise Size 2024 & 2032
- Figure 47: Europe Cloud Endpoint Protection Industry Revenue (Million), by Deployment Model 2024 & 2032
- Figure 48: Europe Cloud Endpoint Protection Industry Volume (K Unit), by Deployment Model 2024 & 2032
- Figure 49: Europe Cloud Endpoint Protection Industry Revenue Share (%), by Deployment Model 2024 & 2032
- Figure 50: Europe Cloud Endpoint Protection Industry Volume Share (%), by Deployment Model 2024 & 2032
- Figure 51: Europe Cloud Endpoint Protection Industry Revenue (Million), by End-user Industry 2024 & 2032
- Figure 52: Europe Cloud Endpoint Protection Industry Volume (K Unit), by End-user Industry 2024 & 2032
- Figure 53: Europe Cloud Endpoint Protection Industry Revenue Share (%), by End-user Industry 2024 & 2032
- Figure 54: Europe Cloud Endpoint Protection Industry Volume Share (%), by End-user Industry 2024 & 2032
- Figure 55: Europe Cloud Endpoint Protection Industry Revenue (Million), by Country 2024 & 2032
- Figure 56: Europe Cloud Endpoint Protection Industry Volume (K Unit), by Country 2024 & 2032
- Figure 57: Europe Cloud Endpoint Protection Industry Revenue Share (%), by Country 2024 & 2032
- Figure 58: Europe Cloud Endpoint Protection Industry Volume Share (%), by Country 2024 & 2032
- Figure 59: Asia Pacific Cloud Endpoint Protection Industry Revenue (Million), by Enterprise Size 2024 & 2032
- Figure 60: Asia Pacific Cloud Endpoint Protection Industry Volume (K Unit), by Enterprise Size 2024 & 2032
- Figure 61: Asia Pacific Cloud Endpoint Protection Industry Revenue Share (%), by Enterprise Size 2024 & 2032
- Figure 62: Asia Pacific Cloud Endpoint Protection Industry Volume Share (%), by Enterprise Size 2024 & 2032
- Figure 63: Asia Pacific Cloud Endpoint Protection Industry Revenue (Million), by Deployment Model 2024 & 2032
- Figure 64: Asia Pacific Cloud Endpoint Protection Industry Volume (K Unit), by Deployment Model 2024 & 2032
- Figure 65: Asia Pacific Cloud Endpoint Protection Industry Revenue Share (%), by Deployment Model 2024 & 2032
- Figure 66: Asia Pacific Cloud Endpoint Protection Industry Volume Share (%), by Deployment Model 2024 & 2032
- Figure 67: Asia Pacific Cloud Endpoint Protection Industry Revenue (Million), by End-user Industry 2024 & 2032
- Figure 68: Asia Pacific Cloud Endpoint Protection Industry Volume (K Unit), by End-user Industry 2024 & 2032
- Figure 69: Asia Pacific Cloud Endpoint Protection Industry Revenue Share (%), by End-user Industry 2024 & 2032
- Figure 70: Asia Pacific Cloud Endpoint Protection Industry Volume Share (%), by End-user Industry 2024 & 2032
- Figure 71: Asia Pacific Cloud Endpoint Protection Industry Revenue (Million), by Country 2024 & 2032
- Figure 72: Asia Pacific Cloud Endpoint Protection Industry Volume (K Unit), by Country 2024 & 2032
- Figure 73: Asia Pacific Cloud Endpoint Protection Industry Revenue Share (%), by Country 2024 & 2032
- Figure 74: Asia Pacific Cloud Endpoint Protection Industry Volume Share (%), by Country 2024 & 2032
- Figure 75: Latin America Cloud Endpoint Protection Industry Revenue (Million), by Enterprise Size 2024 & 2032
- Figure 76: Latin America Cloud Endpoint Protection Industry Volume (K Unit), by Enterprise Size 2024 & 2032
- Figure 77: Latin America Cloud Endpoint Protection Industry Revenue Share (%), by Enterprise Size 2024 & 2032
- Figure 78: Latin America Cloud Endpoint Protection Industry Volume Share (%), by Enterprise Size 2024 & 2032
- Figure 79: Latin America Cloud Endpoint Protection Industry Revenue (Million), by Deployment Model 2024 & 2032
- Figure 80: Latin America Cloud Endpoint Protection Industry Volume (K Unit), by Deployment Model 2024 & 2032
- Figure 81: Latin America Cloud Endpoint Protection Industry Revenue Share (%), by Deployment Model 2024 & 2032
- Figure 82: Latin America Cloud Endpoint Protection Industry Volume Share (%), by Deployment Model 2024 & 2032
- Figure 83: Latin America Cloud Endpoint Protection Industry Revenue (Million), by End-user Industry 2024 & 2032
- Figure 84: Latin America Cloud Endpoint Protection Industry Volume (K Unit), by End-user Industry 2024 & 2032
- Figure 85: Latin America Cloud Endpoint Protection Industry Revenue Share (%), by End-user Industry 2024 & 2032
- Figure 86: Latin America Cloud Endpoint Protection Industry Volume Share (%), by End-user Industry 2024 & 2032
- Figure 87: Latin America Cloud Endpoint Protection Industry Revenue (Million), by Country 2024 & 2032
- Figure 88: Latin America Cloud Endpoint Protection Industry Volume (K Unit), by Country 2024 & 2032
- Figure 89: Latin America Cloud Endpoint Protection Industry Revenue Share (%), by Country 2024 & 2032
- Figure 90: Latin America Cloud Endpoint Protection Industry Volume Share (%), by Country 2024 & 2032
- Figure 91: Middle East and Africa Cloud Endpoint Protection Industry Revenue (Million), by Enterprise Size 2024 & 2032
- Figure 92: Middle East and Africa Cloud Endpoint Protection Industry Volume (K Unit), by Enterprise Size 2024 & 2032
- Figure 93: Middle East and Africa Cloud Endpoint Protection Industry Revenue Share (%), by Enterprise Size 2024 & 2032
- Figure 94: Middle East and Africa Cloud Endpoint Protection Industry Volume Share (%), by Enterprise Size 2024 & 2032
- Figure 95: Middle East and Africa Cloud Endpoint Protection Industry Revenue (Million), by Deployment Model 2024 & 2032
- Figure 96: Middle East and Africa Cloud Endpoint Protection Industry Volume (K Unit), by Deployment Model 2024 & 2032
- Figure 97: Middle East and Africa Cloud Endpoint Protection Industry Revenue Share (%), by Deployment Model 2024 & 2032
- Figure 98: Middle East and Africa Cloud Endpoint Protection Industry Volume Share (%), by Deployment Model 2024 & 2032
- Figure 99: Middle East and Africa Cloud Endpoint Protection Industry Revenue (Million), by End-user Industry 2024 & 2032
- Figure 100: Middle East and Africa Cloud Endpoint Protection Industry Volume (K Unit), by End-user Industry 2024 & 2032
- Figure 101: Middle East and Africa Cloud Endpoint Protection Industry Revenue Share (%), by End-user Industry 2024 & 2032
- Figure 102: Middle East and Africa Cloud Endpoint Protection Industry Volume Share (%), by End-user Industry 2024 & 2032
- Figure 103: Middle East and Africa Cloud Endpoint Protection Industry Revenue (Million), by Country 2024 & 2032
- Figure 104: Middle East and Africa Cloud Endpoint Protection Industry Volume (K Unit), by Country 2024 & 2032
- Figure 105: Middle East and Africa Cloud Endpoint Protection Industry Revenue Share (%), by Country 2024 & 2032
- Figure 106: Middle East and Africa Cloud Endpoint Protection Industry Volume Share (%), by Country 2024 & 2032
List of Tables
- Table 1: Global Cloud Endpoint Protection Industry Revenue Million Forecast, by Region 2019 & 2032
- Table 2: Global Cloud Endpoint Protection Industry Volume K Unit Forecast, by Region 2019 & 2032
- Table 3: Global Cloud Endpoint Protection Industry Revenue Million Forecast, by Enterprise Size 2019 & 2032
- Table 4: Global Cloud Endpoint Protection Industry Volume K Unit Forecast, by Enterprise Size 2019 & 2032
- Table 5: Global Cloud Endpoint Protection Industry Revenue Million Forecast, by Deployment Model 2019 & 2032
- Table 6: Global Cloud Endpoint Protection Industry Volume K Unit Forecast, by Deployment Model 2019 & 2032
- Table 7: Global Cloud Endpoint Protection Industry Revenue Million Forecast, by End-user Industry 2019 & 2032
- Table 8: Global Cloud Endpoint Protection Industry Volume K Unit Forecast, by End-user Industry 2019 & 2032
- Table 9: Global Cloud Endpoint Protection Industry Revenue Million Forecast, by Region 2019 & 2032
- Table 10: Global Cloud Endpoint Protection Industry Volume K Unit Forecast, by Region 2019 & 2032
- Table 11: Global Cloud Endpoint Protection Industry Revenue Million Forecast, by Country 2019 & 2032
- Table 12: Global Cloud Endpoint Protection Industry Volume K Unit Forecast, by Country 2019 & 2032
- Table 13: United States Cloud Endpoint Protection Industry Revenue (Million) Forecast, by Application 2019 & 2032
- Table 14: United States Cloud Endpoint Protection Industry Volume (K Unit) Forecast, by Application 2019 & 2032
- Table 15: Canada Cloud Endpoint Protection Industry Revenue (Million) Forecast, by Application 2019 & 2032
- Table 16: Canada Cloud Endpoint Protection Industry Volume (K Unit) Forecast, by Application 2019 & 2032
- Table 17: Mexico Cloud Endpoint Protection Industry Revenue (Million) Forecast, by Application 2019 & 2032
- Table 18: Mexico Cloud Endpoint Protection Industry Volume (K Unit) Forecast, by Application 2019 & 2032
- Table 19: Global Cloud Endpoint Protection Industry Revenue Million Forecast, by Country 2019 & 2032
- Table 20: Global Cloud Endpoint Protection Industry Volume K Unit Forecast, by Country 2019 & 2032
- Table 21: Germany Cloud Endpoint Protection Industry Revenue (Million) Forecast, by Application 2019 & 2032
- Table 22: Germany Cloud Endpoint Protection Industry Volume (K Unit) Forecast, by Application 2019 & 2032
- Table 23: United Kingdom Cloud Endpoint Protection Industry Revenue (Million) Forecast, by Application 2019 & 2032
- Table 24: United Kingdom Cloud Endpoint Protection Industry Volume (K Unit) Forecast, by Application 2019 & 2032
- Table 25: France Cloud Endpoint Protection Industry Revenue (Million) Forecast, by Application 2019 & 2032
- Table 26: France Cloud Endpoint Protection Industry Volume (K Unit) Forecast, by Application 2019 & 2032
- Table 27: Spain Cloud Endpoint Protection Industry Revenue (Million) Forecast, by Application 2019 & 2032
- Table 28: Spain Cloud Endpoint Protection Industry Volume (K Unit) Forecast, by Application 2019 & 2032
- Table 29: Italy Cloud Endpoint Protection Industry Revenue (Million) Forecast, by Application 2019 & 2032
- Table 30: Italy Cloud Endpoint Protection Industry Volume (K Unit) Forecast, by Application 2019 & 2032
- Table 31: Spain Cloud Endpoint Protection Industry Revenue (Million) Forecast, by Application 2019 & 2032
- Table 32: Spain Cloud Endpoint Protection Industry Volume (K Unit) Forecast, by Application 2019 & 2032
- Table 33: Belgium Cloud Endpoint Protection Industry Revenue (Million) Forecast, by Application 2019 & 2032
- Table 34: Belgium Cloud Endpoint Protection Industry Volume (K Unit) Forecast, by Application 2019 & 2032
- Table 35: Netherland Cloud Endpoint Protection Industry Revenue (Million) Forecast, by Application 2019 & 2032
- Table 36: Netherland Cloud Endpoint Protection Industry Volume (K Unit) Forecast, by Application 2019 & 2032
- Table 37: Nordics Cloud Endpoint Protection Industry Revenue (Million) Forecast, by Application 2019 & 2032
- Table 38: Nordics Cloud Endpoint Protection Industry Volume (K Unit) Forecast, by Application 2019 & 2032
- Table 39: Rest of Europe Cloud Endpoint Protection Industry Revenue (Million) Forecast, by Application 2019 & 2032
- Table 40: Rest of Europe Cloud Endpoint Protection Industry Volume (K Unit) Forecast, by Application 2019 & 2032
- Table 41: Global Cloud Endpoint Protection Industry Revenue Million Forecast, by Country 2019 & 2032
- Table 42: Global Cloud Endpoint Protection Industry Volume K Unit Forecast, by Country 2019 & 2032
- Table 43: China Cloud Endpoint Protection Industry Revenue (Million) Forecast, by Application 2019 & 2032
- Table 44: China Cloud Endpoint Protection Industry Volume (K Unit) Forecast, by Application 2019 & 2032
- Table 45: Japan Cloud Endpoint Protection Industry Revenue (Million) Forecast, by Application 2019 & 2032
- Table 46: Japan Cloud Endpoint Protection Industry Volume (K Unit) Forecast, by Application 2019 & 2032
- Table 47: India Cloud Endpoint Protection Industry Revenue (Million) Forecast, by Application 2019 & 2032
- Table 48: India Cloud Endpoint Protection Industry Volume (K Unit) Forecast, by Application 2019 & 2032
- Table 49: South Korea Cloud Endpoint Protection Industry Revenue (Million) Forecast, by Application 2019 & 2032
- Table 50: South Korea Cloud Endpoint Protection Industry Volume (K Unit) Forecast, by Application 2019 & 2032
- Table 51: Southeast Asia Cloud Endpoint Protection Industry Revenue (Million) Forecast, by Application 2019 & 2032
- Table 52: Southeast Asia Cloud Endpoint Protection Industry Volume (K Unit) Forecast, by Application 2019 & 2032
- Table 53: Australia Cloud Endpoint Protection Industry Revenue (Million) Forecast, by Application 2019 & 2032
- Table 54: Australia Cloud Endpoint Protection Industry Volume (K Unit) Forecast, by Application 2019 & 2032
- Table 55: Indonesia Cloud Endpoint Protection Industry Revenue (Million) Forecast, by Application 2019 & 2032
- Table 56: Indonesia Cloud Endpoint Protection Industry Volume (K Unit) Forecast, by Application 2019 & 2032
- Table 57: Phillipes Cloud Endpoint Protection Industry Revenue (Million) Forecast, by Application 2019 & 2032
- Table 58: Phillipes Cloud Endpoint Protection Industry Volume (K Unit) Forecast, by Application 2019 & 2032
- Table 59: Singapore Cloud Endpoint Protection Industry Revenue (Million) Forecast, by Application 2019 & 2032
- Table 60: Singapore Cloud Endpoint Protection Industry Volume (K Unit) Forecast, by Application 2019 & 2032
- Table 61: Thailandc Cloud Endpoint Protection Industry Revenue (Million) Forecast, by Application 2019 & 2032
- Table 62: Thailandc Cloud Endpoint Protection Industry Volume (K Unit) Forecast, by Application 2019 & 2032
- Table 63: Rest of Asia Pacific Cloud Endpoint Protection Industry Revenue (Million) Forecast, by Application 2019 & 2032
- Table 64: Rest of Asia Pacific Cloud Endpoint Protection Industry Volume (K Unit) Forecast, by Application 2019 & 2032
- Table 65: Global Cloud Endpoint Protection Industry Revenue Million Forecast, by Country 2019 & 2032
- Table 66: Global Cloud Endpoint Protection Industry Volume K Unit Forecast, by Country 2019 & 2032
- Table 67: Brazil Cloud Endpoint Protection Industry Revenue (Million) Forecast, by Application 2019 & 2032
- Table 68: Brazil Cloud Endpoint Protection Industry Volume (K Unit) Forecast, by Application 2019 & 2032
- Table 69: Argentina Cloud Endpoint Protection Industry Revenue (Million) Forecast, by Application 2019 & 2032
- Table 70: Argentina Cloud Endpoint Protection Industry Volume (K Unit) Forecast, by Application 2019 & 2032
- Table 71: Peru Cloud Endpoint Protection Industry Revenue (Million) Forecast, by Application 2019 & 2032
- Table 72: Peru Cloud Endpoint Protection Industry Volume (K Unit) Forecast, by Application 2019 & 2032
- Table 73: Chile Cloud Endpoint Protection Industry Revenue (Million) Forecast, by Application 2019 & 2032
- Table 74: Chile Cloud Endpoint Protection Industry Volume (K Unit) Forecast, by Application 2019 & 2032
- Table 75: Colombia Cloud Endpoint Protection Industry Revenue (Million) Forecast, by Application 2019 & 2032
- Table 76: Colombia Cloud Endpoint Protection Industry Volume (K Unit) Forecast, by Application 2019 & 2032
- Table 77: Ecuador Cloud Endpoint Protection Industry Revenue (Million) Forecast, by Application 2019 & 2032
- Table 78: Ecuador Cloud Endpoint Protection Industry Volume (K Unit) Forecast, by Application 2019 & 2032
- Table 79: Venezuela Cloud Endpoint Protection Industry Revenue (Million) Forecast, by Application 2019 & 2032
- Table 80: Venezuela Cloud Endpoint Protection Industry Volume (K Unit) Forecast, by Application 2019 & 2032
- Table 81: Rest of South America Cloud Endpoint Protection Industry Revenue (Million) Forecast, by Application 2019 & 2032
- Table 82: Rest of South America Cloud Endpoint Protection Industry Volume (K Unit) Forecast, by Application 2019 & 2032
- Table 83: Global Cloud Endpoint Protection Industry Revenue Million Forecast, by Country 2019 & 2032
- Table 84: Global Cloud Endpoint Protection Industry Volume K Unit Forecast, by Country 2019 & 2032
- Table 85: United States Cloud Endpoint Protection Industry Revenue (Million) Forecast, by Application 2019 & 2032
- Table 86: United States Cloud Endpoint Protection Industry Volume (K Unit) Forecast, by Application 2019 & 2032
- Table 87: Canada Cloud Endpoint Protection Industry Revenue (Million) Forecast, by Application 2019 & 2032
- Table 88: Canada Cloud Endpoint Protection Industry Volume (K Unit) Forecast, by Application 2019 & 2032
- Table 89: Mexico Cloud Endpoint Protection Industry Revenue (Million) Forecast, by Application 2019 & 2032
- Table 90: Mexico Cloud Endpoint Protection Industry Volume (K Unit) Forecast, by Application 2019 & 2032
- Table 91: Global Cloud Endpoint Protection Industry Revenue Million Forecast, by Country 2019 & 2032
- Table 92: Global Cloud Endpoint Protection Industry Volume K Unit Forecast, by Country 2019 & 2032
- Table 93: United Arab Emirates Cloud Endpoint Protection Industry Revenue (Million) Forecast, by Application 2019 & 2032
- Table 94: United Arab Emirates Cloud Endpoint Protection Industry Volume (K Unit) Forecast, by Application 2019 & 2032
- Table 95: Saudi Arabia Cloud Endpoint Protection Industry Revenue (Million) Forecast, by Application 2019 & 2032
- Table 96: Saudi Arabia Cloud Endpoint Protection Industry Volume (K Unit) Forecast, by Application 2019 & 2032
- Table 97: South Africa Cloud Endpoint Protection Industry Revenue (Million) Forecast, by Application 2019 & 2032
- Table 98: South Africa Cloud Endpoint Protection Industry Volume (K Unit) Forecast, by Application 2019 & 2032
- Table 99: Rest of Middle East and Africa Cloud Endpoint Protection Industry Revenue (Million) Forecast, by Application 2019 & 2032
- Table 100: Rest of Middle East and Africa Cloud Endpoint Protection Industry Volume (K Unit) Forecast, by Application 2019 & 2032
- Table 101: Global Cloud Endpoint Protection Industry Revenue Million Forecast, by Enterprise Size 2019 & 2032
- Table 102: Global Cloud Endpoint Protection Industry Volume K Unit Forecast, by Enterprise Size 2019 & 2032
- Table 103: Global Cloud Endpoint Protection Industry Revenue Million Forecast, by Deployment Model 2019 & 2032
- Table 104: Global Cloud Endpoint Protection Industry Volume K Unit Forecast, by Deployment Model 2019 & 2032
- Table 105: Global Cloud Endpoint Protection Industry Revenue Million Forecast, by End-user Industry 2019 & 2032
- Table 106: Global Cloud Endpoint Protection Industry Volume K Unit Forecast, by End-user Industry 2019 & 2032
- Table 107: Global Cloud Endpoint Protection Industry Revenue Million Forecast, by Country 2019 & 2032
- Table 108: Global Cloud Endpoint Protection Industry Volume K Unit Forecast, by Country 2019 & 2032
- Table 109: Global Cloud Endpoint Protection Industry Revenue Million Forecast, by Enterprise Size 2019 & 2032
- Table 110: Global Cloud Endpoint Protection Industry Volume K Unit Forecast, by Enterprise Size 2019 & 2032
- Table 111: Global Cloud Endpoint Protection Industry Revenue Million Forecast, by Deployment Model 2019 & 2032
- Table 112: Global Cloud Endpoint Protection Industry Volume K Unit Forecast, by Deployment Model 2019 & 2032
- Table 113: Global Cloud Endpoint Protection Industry Revenue Million Forecast, by End-user Industry 2019 & 2032
- Table 114: Global Cloud Endpoint Protection Industry Volume K Unit Forecast, by End-user Industry 2019 & 2032
- Table 115: Global Cloud Endpoint Protection Industry Revenue Million Forecast, by Country 2019 & 2032
- Table 116: Global Cloud Endpoint Protection Industry Volume K Unit Forecast, by Country 2019 & 2032
- Table 117: Global Cloud Endpoint Protection Industry Revenue Million Forecast, by Enterprise Size 2019 & 2032
- Table 118: Global Cloud Endpoint Protection Industry Volume K Unit Forecast, by Enterprise Size 2019 & 2032
- Table 119: Global Cloud Endpoint Protection Industry Revenue Million Forecast, by Deployment Model 2019 & 2032
- Table 120: Global Cloud Endpoint Protection Industry Volume K Unit Forecast, by Deployment Model 2019 & 2032
- Table 121: Global Cloud Endpoint Protection Industry Revenue Million Forecast, by End-user Industry 2019 & 2032
- Table 122: Global Cloud Endpoint Protection Industry Volume K Unit Forecast, by End-user Industry 2019 & 2032
- Table 123: Global Cloud Endpoint Protection Industry Revenue Million Forecast, by Country 2019 & 2032
- Table 124: Global Cloud Endpoint Protection Industry Volume K Unit Forecast, by Country 2019 & 2032
- Table 125: Global Cloud Endpoint Protection Industry Revenue Million Forecast, by Enterprise Size 2019 & 2032
- Table 126: Global Cloud Endpoint Protection Industry Volume K Unit Forecast, by Enterprise Size 2019 & 2032
- Table 127: Global Cloud Endpoint Protection Industry Revenue Million Forecast, by Deployment Model 2019 & 2032
- Table 128: Global Cloud Endpoint Protection Industry Volume K Unit Forecast, by Deployment Model 2019 & 2032
- Table 129: Global Cloud Endpoint Protection Industry Revenue Million Forecast, by End-user Industry 2019 & 2032
- Table 130: Global Cloud Endpoint Protection Industry Volume K Unit Forecast, by End-user Industry 2019 & 2032
- Table 131: Global Cloud Endpoint Protection Industry Revenue Million Forecast, by Country 2019 & 2032
- Table 132: Global Cloud Endpoint Protection Industry Volume K Unit Forecast, by Country 2019 & 2032
- Table 133: Global Cloud Endpoint Protection Industry Revenue Million Forecast, by Enterprise Size 2019 & 2032
- Table 134: Global Cloud Endpoint Protection Industry Volume K Unit Forecast, by Enterprise Size 2019 & 2032
- Table 135: Global Cloud Endpoint Protection Industry Revenue Million Forecast, by Deployment Model 2019 & 2032
- Table 136: Global Cloud Endpoint Protection Industry Volume K Unit Forecast, by Deployment Model 2019 & 2032
- Table 137: Global Cloud Endpoint Protection Industry Revenue Million Forecast, by End-user Industry 2019 & 2032
- Table 138: Global Cloud Endpoint Protection Industry Volume K Unit Forecast, by End-user Industry 2019 & 2032
- Table 139: Global Cloud Endpoint Protection Industry Revenue Million Forecast, by Country 2019 & 2032
- Table 140: Global Cloud Endpoint Protection Industry Volume K Unit Forecast, by Country 2019 & 2032
Frequently Asked Questions
1. What is the projected Compound Annual Growth Rate (CAGR) of the Cloud Endpoint Protection Industry?
The projected CAGR is approximately 12.30%.
2. Which companies are prominent players in the Cloud Endpoint Protection Industry?
Key companies in the market include Trend Micro Inc, Vmware Inc, Kaspersky Lab Inc, Bitdefender LLC, Avast Software SR, Fortinet Inc, McAfee LLC, CrowdStrike Holdings Inc, Cisco Systems Inc, Microsoft Corporation, SentinelOne Inc, Sophos Group PLC, Broadcom Inc (Symantec Corporation).
3. What are the main segments of the Cloud Endpoint Protection Industry?
The market segments include Enterprise Size, Deployment Model, End-user Industry.
4. Can you provide details about the market size?
The market size is estimated to be USD XX Million as of 2022.
5. What are some drivers contributing to market growth?
; Growth of Smart Devices; Increasing number of Data Breaches.
6. What are the notable trends driving market growth?
Healthcare Segment is Expected to Witness Significant Growth.
7. Are there any restraints impacting market growth?
; Lack of Awareness about Cyberattacks.
8. Can you provide examples of recent developments in the market?
N/A
9. What pricing options are available for accessing the report?
Pricing options include single-user, multi-user, and enterprise licenses priced at USD 4750, USD 5250, and USD 8750 respectively.
10. Is the market size provided in terms of value or volume?
The market size is provided in terms of value, measured in Million and volume, measured in K Unit.
11. Are there any specific market keywords associated with the report?
Yes, the market keyword associated with the report is "Cloud Endpoint Protection Industry," which aids in identifying and referencing the specific market segment covered.
12. How do I determine which pricing option suits my needs best?
The pricing options vary based on user requirements and access needs. Individual users may opt for single-user licenses, while businesses requiring broader access may choose multi-user or enterprise licenses for cost-effective access to the report.
13. Are there any additional resources or data provided in the Cloud Endpoint Protection Industry report?
While the report offers comprehensive insights, it's advisable to review the specific contents or supplementary materials provided to ascertain if additional resources or data are available.
14. How can I stay updated on further developments or reports in the Cloud Endpoint Protection Industry?
To stay informed about further developments, trends, and reports in the Cloud Endpoint Protection Industry, consider subscribing to industry newsletters, following relevant companies and organizations, or regularly checking reputable industry news sources and publications.
Methodology
Step 1 - Identification of Relevant Samples Size from Population Database


Step 2 - Approaches for Defining Global Market Size (Value, Volume* & Price*)

Note*: In applicable scenarios
Step 3 - Data Sources
Primary Research
- Web Analytics
- Survey Reports
- Research Institute
- Latest Research Reports
- Opinion Leaders
Secondary Research
- Annual Reports
- White Paper
- Latest Press Release
- Industry Association
- Paid Database
- Investor Presentations

Step 4 - Data Triangulation
Involves using different sources of information in order to increase the validity of a study
These sources are likely to be stakeholders in a program - participants, other researchers, program staff, other community members, and so on.
Then we put all data in single framework & apply various statistical tools to find out the dynamic on the market.
During the analysis stage, feedback from the stakeholder groups would be compared to determine areas of agreement as well as areas of divergence


