
Key Insights
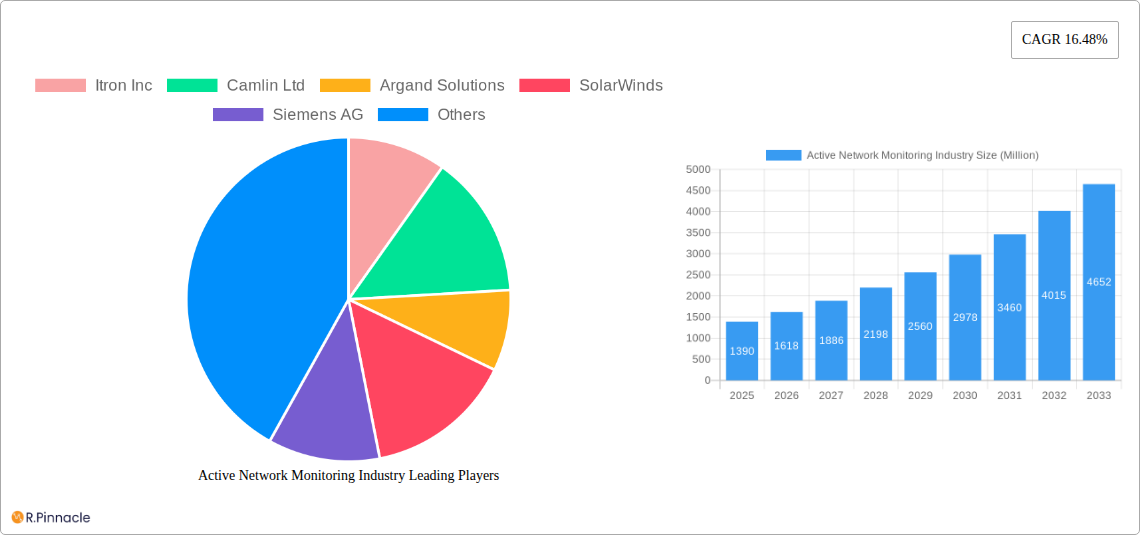
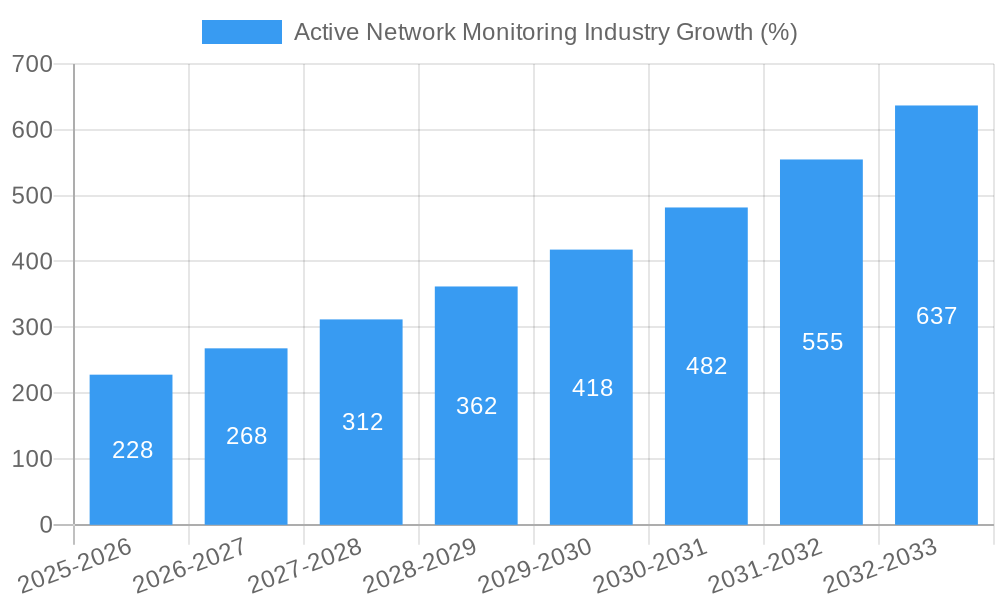
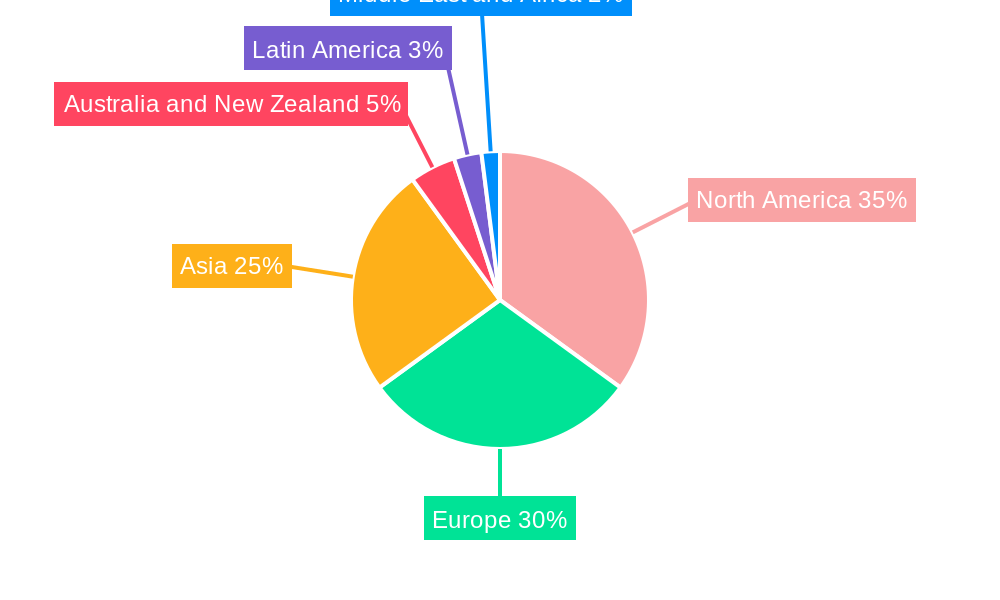
The Active Network Monitoring market is experiencing robust growth, projected to reach a value of $1.39 billion in 2025 and maintain a Compound Annual Growth Rate (CAGR) of 16.48% from 2025 to 2033. This expansion is driven by several key factors. The increasing adoption of smart grids and renewable energy sources necessitates sophisticated monitoring systems to ensure grid stability and optimize energy distribution. Furthermore, the rising prevalence of automation in various industries, coupled with the growing demand for real-time operational insights, fuels the demand for advanced network monitoring solutions. The shift towards predictive maintenance strategies, aimed at minimizing downtime and maximizing operational efficiency, also significantly contributes to market growth. Software solutions dominate the market due to their scalability, flexibility, and cost-effectiveness compared to traditional hardware-based systems. North America and Europe currently hold significant market shares, driven by early adoption of smart grid technologies and a strong regulatory framework supporting grid modernization. However, Asia-Pacific is expected to exhibit significant growth in the coming years, fueled by rapid industrialization and increasing investments in infrastructure development.
The market segmentation reveals a strong focus on applications such as automation, grid-asset monitoring, and real-time monitoring. Key players like Itron Inc, Siemens AG, and Schneider Electric SE are driving innovation through the development of advanced analytics capabilities, AI-powered predictive maintenance tools, and integration with IoT devices. While the market faces challenges such as high initial investment costs and the complexity of integrating diverse systems, these are being addressed through the development of more user-friendly interfaces and cloud-based solutions that reduce infrastructure requirements. The competitive landscape is characterized by both established players and emerging technology providers, leading to continuous product innovation and price competition. The forecast period highlights continued growth, driven by expanding smart grid deployments, increasing digitalization across industries, and the growing focus on enhancing grid resilience and efficiency.
Active Network Monitoring Industry Report: 2019-2033
This comprehensive report provides a detailed analysis of the Active Network Monitoring industry, offering invaluable insights for industry professionals, investors, and strategic decision-makers. With a study period spanning 2019-2033, a base year of 2025, and a forecast period of 2025-2033, this report delivers actionable intelligence on market size (reaching xx Million by 2033), growth drivers, challenges, and future opportunities within this dynamic sector. The report analyzes key market segments, including Software and Services, along with applications such as Automation, Grid-Asset Monitoring, and Real-Time Monitoring. Leading players like Itron Inc, Siemens AG, and General Electric Company are profiled, highlighting their market positions and innovative strategies.
Active Network Monitoring Industry Market Structure & Innovation Trends
The Active Network Monitoring market is characterized by a moderately concentrated structure with several major players holding significant market share. Itron Inc and Siemens AG, for example, collectively account for an estimated xx% of the global market in 2025. However, the market also exhibits a dynamic landscape with numerous smaller players contributing to innovation and competition.
Innovation Drivers:
- Advancements in sensor technology and IoT (Internet of Things) integration.
- Growing demand for real-time grid monitoring and predictive analytics capabilities.
- Stringent regulatory requirements for grid reliability and efficiency.
Regulatory Frameworks: Varying government regulations across different regions significantly impact market growth and adoption rates.
Product Substitutes: While direct substitutes are limited, alternative solutions like traditional monitoring systems exert competitive pressure.
End-User Demographics: The primary end-users are utility companies, power grid operators, and industrial facilities.
M&A Activities: The past five years have witnessed a moderate level of M&A activity, with deal values averaging xx Million per transaction. Consolidation is expected to continue, driven by the need for increased scale and technological capabilities. Examples include (though specific deal values are not publicly available for all and are thus omitted):
- Siemens AG's strategic acquisitions to bolster its software portfolio.
- Consolidation amongst smaller players to achieve greater market share.
Active Network Monitoring Industry Market Dynamics & Trends
The Active Network Monitoring market exhibits robust growth, driven by increasing electricity demand, the integration of renewable energy sources, and the need for advanced grid management solutions. The market's Compound Annual Growth Rate (CAGR) is projected at xx% during the forecast period (2025-2033). Market penetration is expected to increase significantly, particularly in developing economies with rapidly expanding power grids. Technological disruptions, including the rise of AI and machine learning, are transforming how grids are monitored and managed. Consumer preferences are shifting towards solutions that offer greater visibility, predictive capabilities, and improved grid resilience. Competitive dynamics are marked by innovation, strategic partnerships, and a focus on delivering comprehensive solutions that address the evolving needs of utility companies.
Dominant Regions & Segments in Active Network Monitoring Industry
The North American region currently holds the largest market share, followed by Europe and Asia-Pacific. However, Asia-Pacific is expected to experience the highest growth rate during the forecast period, driven by rapid industrialization and investments in grid modernization.
By Application:
- Grid-Asset Monitoring: This segment is experiencing significant growth due to the need for improved asset management and reduced downtime. Key drivers include increasing aging infrastructure and growing concerns about grid reliability.
- Real-Time Monitoring: This segment is crucial for proactive grid management and enhancing operational efficiency. The key driver is the need for immediate response to grid anomalies.
- Automation: This segment is gaining traction, enabled by advancements in IoT and AI technologies. Drivers include the need for automated grid operations and reduced manual intervention.
By Type:
- Software: This segment dominates the market due to the increasing adoption of sophisticated software solutions for grid management and analytics. Growth is driven by features like predictive maintenance and AI-driven insights.
- Services: This segment provides essential support for software deployment and system maintenance. Growing complexity of grid systems drives the demand for professional services.
Active Network Monitoring Industry Product Innovations
Recent product developments emphasize enhanced data analytics, AI-powered predictive maintenance, and seamless integration with existing grid infrastructure. New applications include advanced grid optimization, improved cybersecurity measures, and support for the increasing integration of renewable energy sources. These innovations are improving the efficiency, reliability, and resilience of power grids, offering significant competitive advantages for vendors who offer the most advanced solutions.
Report Scope & Segmentation Analysis
This report provides a comprehensive segmentation analysis of the Active Network Monitoring market, divided by Application (Automation, Grid-Asset Monitoring, Real-Time Monitoring) and Type (Software, Services). Each segment's growth projections, market size (in Millions), and competitive dynamics are detailed within the full report. For example, the Software segment is projected to grow at a faster rate than the Services segment during the forecast period due to increasing demand for advanced analytics capabilities.
Key Drivers of Active Network Monitoring Industry Growth
The growth of the Active Network Monitoring industry is driven by several key factors:
- Technological advancements: The development of advanced sensors, AI-powered analytics, and IoT integration enables more efficient and reliable grid management.
- Increasing electricity demand: Globally rising energy needs necessitate improved grid infrastructure and management capabilities.
- Integration of renewable energy sources: The expansion of renewable energy necessitates sophisticated monitoring and management solutions.
- Regulatory mandates: Government regulations focused on grid reliability and efficiency drive the adoption of advanced monitoring systems.
Challenges in the Active Network Monitoring Industry Sector
The Active Network Monitoring industry faces several challenges:
- High initial investment costs: The implementation of advanced monitoring systems requires significant capital expenditure for utilities.
- Cybersecurity threats: The increasing reliance on networked systems raises concerns about potential cyberattacks and data breaches.
- Data management complexity: The vast amount of data generated by monitoring systems requires robust data management and analytics capabilities.
- Integration complexities: Integrating new monitoring systems with legacy grid infrastructure can be challenging and time-consuming.
Emerging Opportunities in Active Network Monitoring Industry
Significant opportunities exist in the Active Network Monitoring industry, including:
- Expansion into emerging markets with growing electricity demand.
- Development of advanced analytics and AI-powered solutions.
- Integration of blockchain technology for improved data security and transparency.
- Focus on providing comprehensive solutions addressing grid modernization and decarbonization.
Leading Players in the Active Network Monitoring Industry Market
- Itron Inc
- Camlin Ltd
- Argand Solutions
- SolarWinds
- Siemens AG
- Landis+Gy
- Schneider Electric SE
- ABB Group
- Chemtrols Industries Pvt Ltd
- Smarter Grid Solutions Ltd
- General Electric Company
Key Developments in Active Network Monitoring Industry
- August 2023: GE Digital launched GridOS, a comprehensive software portfolio for grid orchestration, significantly advancing grid modernization and the clean energy transition.
- June 2023: Siemens introduced LV Insights X software, enhancing distribution grid capacity and reducing outage times by up to 30%, addressing challenges posed by decentralized renewable energy sources and increased demand.
Future Outlook for Active Network Monitoring Industry Market
The Active Network Monitoring market is poised for significant growth, driven by ongoing technological innovation, increasing investments in grid infrastructure, and the global transition to a cleaner, more sustainable energy future. Strategic partnerships and mergers & acquisitions will continue to reshape the industry, leading to the development of more comprehensive and integrated solutions. The market is expected to reach xx Million by 2033, presenting substantial opportunities for both established players and new entrants.
Active Network Monitoring Industry Segmentation
-
1. Type
- 1.1. Software
- 1.2. Services
-
2. Application
- 2.1. Automation
- 2.2. Grid-Asset Monitoring
- 2.3. Real-Time Monitoring
Active Network Monitoring Industry Segmentation By Geography
-
1. North America
- 1.1. United States
- 1.2. Canada
-
2. Europe
- 2.1. Germany
- 2.2. United Kingdom
- 2.3. France
-
3. Asia
- 3.1. India
- 3.2. China
- 3.3. Japan
- 4. Australia and New Zealand
- 5. Latin America
- 6. Middle East and Africa
Active Network Monitoring Industry REPORT HIGHLIGHTS
| Aspects | Details |
|---|---|
| Study Period | 2019-2033 |
| Base Year | 2024 |
| Estimated Year | 2025 |
| Forecast Period | 2025-2033 |
| Historical Period | 2019-2024 |
| Growth Rate | CAGR of 16.48% from 2019-2033 |
| Segmentation |
|
Table of Contents
- 1. Introduction
- 1.1. Research Scope
- 1.2. Market Segmentation
- 1.3. Research Methodology
- 1.4. Definitions and Assumptions
- 2. Executive Summary
- 2.1. Introduction
- 3. Market Dynamics
- 3.1. Introduction
- 3.2. Market Drivers
- 3.2.1. Growth in Renewable Energy Commercialization; Rising Number of Smart City Projects
- 3.3. Market Restrains
- 3.3.1. Stringent Environmental and Safety Regulations; Increasing Competition from the Unorganized Sectors
- 3.4. Market Trends
- 3.4.1. Grid Asset Monitoring to Hold the Significant Market Share
- 4. Market Factor Analysis
- 4.1. Porters Five Forces
- 4.2. Supply/Value Chain
- 4.3. PESTEL analysis
- 4.4. Market Entropy
- 4.5. Patent/Trademark Analysis
- 5. Global Active Network Monitoring Industry Analysis, Insights and Forecast, 2019-2031
- 5.1. Market Analysis, Insights and Forecast - by Type
- 5.1.1. Software
- 5.1.2. Services
- 5.2. Market Analysis, Insights and Forecast - by Application
- 5.2.1. Automation
- 5.2.2. Grid-Asset Monitoring
- 5.2.3. Real-Time Monitoring
- 5.3. Market Analysis, Insights and Forecast - by Region
- 5.3.1. North America
- 5.3.2. Europe
- 5.3.3. Asia
- 5.3.4. Australia and New Zealand
- 5.3.5. Latin America
- 5.3.6. Middle East and Africa
- 5.1. Market Analysis, Insights and Forecast - by Type
- 6. North America Active Network Monitoring Industry Analysis, Insights and Forecast, 2019-2031
- 6.1. Market Analysis, Insights and Forecast - by Type
- 6.1.1. Software
- 6.1.2. Services
- 6.2. Market Analysis, Insights and Forecast - by Application
- 6.2.1. Automation
- 6.2.2. Grid-Asset Monitoring
- 6.2.3. Real-Time Monitoring
- 6.1. Market Analysis, Insights and Forecast - by Type
- 7. Europe Active Network Monitoring Industry Analysis, Insights and Forecast, 2019-2031
- 7.1. Market Analysis, Insights and Forecast - by Type
- 7.1.1. Software
- 7.1.2. Services
- 7.2. Market Analysis, Insights and Forecast - by Application
- 7.2.1. Automation
- 7.2.2. Grid-Asset Monitoring
- 7.2.3. Real-Time Monitoring
- 7.1. Market Analysis, Insights and Forecast - by Type
- 8. Asia Active Network Monitoring Industry Analysis, Insights and Forecast, 2019-2031
- 8.1. Market Analysis, Insights and Forecast - by Type
- 8.1.1. Software
- 8.1.2. Services
- 8.2. Market Analysis, Insights and Forecast - by Application
- 8.2.1. Automation
- 8.2.2. Grid-Asset Monitoring
- 8.2.3. Real-Time Monitoring
- 8.1. Market Analysis, Insights and Forecast - by Type
- 9. Australia and New Zealand Active Network Monitoring Industry Analysis, Insights and Forecast, 2019-2031
- 9.1. Market Analysis, Insights and Forecast - by Type
- 9.1.1. Software
- 9.1.2. Services
- 9.2. Market Analysis, Insights and Forecast - by Application
- 9.2.1. Automation
- 9.2.2. Grid-Asset Monitoring
- 9.2.3. Real-Time Monitoring
- 9.1. Market Analysis, Insights and Forecast - by Type
- 10. Latin America Active Network Monitoring Industry Analysis, Insights and Forecast, 2019-2031
- 10.1. Market Analysis, Insights and Forecast - by Type
- 10.1.1. Software
- 10.1.2. Services
- 10.2. Market Analysis, Insights and Forecast - by Application
- 10.2.1. Automation
- 10.2.2. Grid-Asset Monitoring
- 10.2.3. Real-Time Monitoring
- 10.1. Market Analysis, Insights and Forecast - by Type
- 11. Middle East and Africa Active Network Monitoring Industry Analysis, Insights and Forecast, 2019-2031
- 11.1. Market Analysis, Insights and Forecast - by Type
- 11.1.1. Software
- 11.1.2. Services
- 11.2. Market Analysis, Insights and Forecast - by Application
- 11.2.1. Automation
- 11.2.2. Grid-Asset Monitoring
- 11.2.3. Real-Time Monitoring
- 11.1. Market Analysis, Insights and Forecast - by Type
- 12. North America Active Network Monitoring Industry Analysis, Insights and Forecast, 2019-2031
- 12.1. Market Analysis, Insights and Forecast - By Country/Sub-region
- 12.1.1 United States
- 12.1.2 Canada
- 13. Europe Active Network Monitoring Industry Analysis, Insights and Forecast, 2019-2031
- 13.1. Market Analysis, Insights and Forecast - By Country/Sub-region
- 13.1.1 Germany
- 13.1.2 United Kingdom
- 13.1.3 France
- 14. Asia Active Network Monitoring Industry Analysis, Insights and Forecast, 2019-2031
- 14.1. Market Analysis, Insights and Forecast - By Country/Sub-region
- 14.1.1 India
- 14.1.2 China
- 14.1.3 Japan
- 15. Australia and New Zealand Active Network Monitoring Industry Analysis, Insights and Forecast, 2019-2031
- 15.1. Market Analysis, Insights and Forecast - By Country/Sub-region
- 15.1.1.
- 16. Latin America Active Network Monitoring Industry Analysis, Insights and Forecast, 2019-2031
- 16.1. Market Analysis, Insights and Forecast - By Country/Sub-region
- 16.1.1.
- 17. Middle East and Africa Active Network Monitoring Industry Analysis, Insights and Forecast, 2019-2031
- 17.1. Market Analysis, Insights and Forecast - By Country/Sub-region
- 17.1.1.
- 18. Competitive Analysis
- 18.1. Global Market Share Analysis 2024
- 18.2. Company Profiles
- 18.2.1 Itron Inc
- 18.2.1.1. Overview
- 18.2.1.2. Products
- 18.2.1.3. SWOT Analysis
- 18.2.1.4. Recent Developments
- 18.2.1.5. Financials (Based on Availability)
- 18.2.2 Camlin Ltd
- 18.2.2.1. Overview
- 18.2.2.2. Products
- 18.2.2.3. SWOT Analysis
- 18.2.2.4. Recent Developments
- 18.2.2.5. Financials (Based on Availability)
- 18.2.3 Argand Solutions
- 18.2.3.1. Overview
- 18.2.3.2. Products
- 18.2.3.3. SWOT Analysis
- 18.2.3.4. Recent Developments
- 18.2.3.5. Financials (Based on Availability)
- 18.2.4 SolarWinds
- 18.2.4.1. Overview
- 18.2.4.2. Products
- 18.2.4.3. SWOT Analysis
- 18.2.4.4. Recent Developments
- 18.2.4.5. Financials (Based on Availability)
- 18.2.5 Siemens AG
- 18.2.5.1. Overview
- 18.2.5.2. Products
- 18.2.5.3. SWOT Analysis
- 18.2.5.4. Recent Developments
- 18.2.5.5. Financials (Based on Availability)
- 18.2.6 Landis+Gy
- 18.2.6.1. Overview
- 18.2.6.2. Products
- 18.2.6.3. SWOT Analysis
- 18.2.6.4. Recent Developments
- 18.2.6.5. Financials (Based on Availability)
- 18.2.7 Schneider Electric SE
- 18.2.7.1. Overview
- 18.2.7.2. Products
- 18.2.7.3. SWOT Analysis
- 18.2.7.4. Recent Developments
- 18.2.7.5. Financials (Based on Availability)
- 18.2.8 ABB Group
- 18.2.8.1. Overview
- 18.2.8.2. Products
- 18.2.8.3. SWOT Analysis
- 18.2.8.4. Recent Developments
- 18.2.8.5. Financials (Based on Availability)
- 18.2.9 Chemtrols Industries Pvt Ltd
- 18.2.9.1. Overview
- 18.2.9.2. Products
- 18.2.9.3. SWOT Analysis
- 18.2.9.4. Recent Developments
- 18.2.9.5. Financials (Based on Availability)
- 18.2.10 Smarter Grid Solutions Ltd
- 18.2.10.1. Overview
- 18.2.10.2. Products
- 18.2.10.3. SWOT Analysis
- 18.2.10.4. Recent Developments
- 18.2.10.5. Financials (Based on Availability)
- 18.2.11 General Electric Company
- 18.2.11.1. Overview
- 18.2.11.2. Products
- 18.2.11.3. SWOT Analysis
- 18.2.11.4. Recent Developments
- 18.2.11.5. Financials (Based on Availability)
- 18.2.1 Itron Inc
List of Figures
- Figure 1: Global Active Network Monitoring Industry Revenue Breakdown (Million, %) by Region 2024 & 2032
- Figure 2: North America Active Network Monitoring Industry Revenue (Million), by Country 2024 & 2032
- Figure 3: North America Active Network Monitoring Industry Revenue Share (%), by Country 2024 & 2032
- Figure 4: Europe Active Network Monitoring Industry Revenue (Million), by Country 2024 & 2032
- Figure 5: Europe Active Network Monitoring Industry Revenue Share (%), by Country 2024 & 2032
- Figure 6: Asia Active Network Monitoring Industry Revenue (Million), by Country 2024 & 2032
- Figure 7: Asia Active Network Monitoring Industry Revenue Share (%), by Country 2024 & 2032
- Figure 8: Australia and New Zealand Active Network Monitoring Industry Revenue (Million), by Country 2024 & 2032
- Figure 9: Australia and New Zealand Active Network Monitoring Industry Revenue Share (%), by Country 2024 & 2032
- Figure 10: Latin America Active Network Monitoring Industry Revenue (Million), by Country 2024 & 2032
- Figure 11: Latin America Active Network Monitoring Industry Revenue Share (%), by Country 2024 & 2032
- Figure 12: Middle East and Africa Active Network Monitoring Industry Revenue (Million), by Country 2024 & 2032
- Figure 13: Middle East and Africa Active Network Monitoring Industry Revenue Share (%), by Country 2024 & 2032
- Figure 14: North America Active Network Monitoring Industry Revenue (Million), by Type 2024 & 2032
- Figure 15: North America Active Network Monitoring Industry Revenue Share (%), by Type 2024 & 2032
- Figure 16: North America Active Network Monitoring Industry Revenue (Million), by Application 2024 & 2032
- Figure 17: North America Active Network Monitoring Industry Revenue Share (%), by Application 2024 & 2032
- Figure 18: North America Active Network Monitoring Industry Revenue (Million), by Country 2024 & 2032
- Figure 19: North America Active Network Monitoring Industry Revenue Share (%), by Country 2024 & 2032
- Figure 20: Europe Active Network Monitoring Industry Revenue (Million), by Type 2024 & 2032
- Figure 21: Europe Active Network Monitoring Industry Revenue Share (%), by Type 2024 & 2032
- Figure 22: Europe Active Network Monitoring Industry Revenue (Million), by Application 2024 & 2032
- Figure 23: Europe Active Network Monitoring Industry Revenue Share (%), by Application 2024 & 2032
- Figure 24: Europe Active Network Monitoring Industry Revenue (Million), by Country 2024 & 2032
- Figure 25: Europe Active Network Monitoring Industry Revenue Share (%), by Country 2024 & 2032
- Figure 26: Asia Active Network Monitoring Industry Revenue (Million), by Type 2024 & 2032
- Figure 27: Asia Active Network Monitoring Industry Revenue Share (%), by Type 2024 & 2032
- Figure 28: Asia Active Network Monitoring Industry Revenue (Million), by Application 2024 & 2032
- Figure 29: Asia Active Network Monitoring Industry Revenue Share (%), by Application 2024 & 2032
- Figure 30: Asia Active Network Monitoring Industry Revenue (Million), by Country 2024 & 2032
- Figure 31: Asia Active Network Monitoring Industry Revenue Share (%), by Country 2024 & 2032
- Figure 32: Australia and New Zealand Active Network Monitoring Industry Revenue (Million), by Type 2024 & 2032
- Figure 33: Australia and New Zealand Active Network Monitoring Industry Revenue Share (%), by Type 2024 & 2032
- Figure 34: Australia and New Zealand Active Network Monitoring Industry Revenue (Million), by Application 2024 & 2032
- Figure 35: Australia and New Zealand Active Network Monitoring Industry Revenue Share (%), by Application 2024 & 2032
- Figure 36: Australia and New Zealand Active Network Monitoring Industry Revenue (Million), by Country 2024 & 2032
- Figure 37: Australia and New Zealand Active Network Monitoring Industry Revenue Share (%), by Country 2024 & 2032
- Figure 38: Latin America Active Network Monitoring Industry Revenue (Million), by Type 2024 & 2032
- Figure 39: Latin America Active Network Monitoring Industry Revenue Share (%), by Type 2024 & 2032
- Figure 40: Latin America Active Network Monitoring Industry Revenue (Million), by Application 2024 & 2032
- Figure 41: Latin America Active Network Monitoring Industry Revenue Share (%), by Application 2024 & 2032
- Figure 42: Latin America Active Network Monitoring Industry Revenue (Million), by Country 2024 & 2032
- Figure 43: Latin America Active Network Monitoring Industry Revenue Share (%), by Country 2024 & 2032
- Figure 44: Middle East and Africa Active Network Monitoring Industry Revenue (Million), by Type 2024 & 2032
- Figure 45: Middle East and Africa Active Network Monitoring Industry Revenue Share (%), by Type 2024 & 2032
- Figure 46: Middle East and Africa Active Network Monitoring Industry Revenue (Million), by Application 2024 & 2032
- Figure 47: Middle East and Africa Active Network Monitoring Industry Revenue Share (%), by Application 2024 & 2032
- Figure 48: Middle East and Africa Active Network Monitoring Industry Revenue (Million), by Country 2024 & 2032
- Figure 49: Middle East and Africa Active Network Monitoring Industry Revenue Share (%), by Country 2024 & 2032
List of Tables
- Table 1: Global Active Network Monitoring Industry Revenue Million Forecast, by Region 2019 & 2032
- Table 2: Global Active Network Monitoring Industry Revenue Million Forecast, by Type 2019 & 2032
- Table 3: Global Active Network Monitoring Industry Revenue Million Forecast, by Application 2019 & 2032
- Table 4: Global Active Network Monitoring Industry Revenue Million Forecast, by Region 2019 & 2032
- Table 5: Global Active Network Monitoring Industry Revenue Million Forecast, by Country 2019 & 2032
- Table 6: United States Active Network Monitoring Industry Revenue (Million) Forecast, by Application 2019 & 2032
- Table 7: Canada Active Network Monitoring Industry Revenue (Million) Forecast, by Application 2019 & 2032
- Table 8: Global Active Network Monitoring Industry Revenue Million Forecast, by Country 2019 & 2032
- Table 9: Germany Active Network Monitoring Industry Revenue (Million) Forecast, by Application 2019 & 2032
- Table 10: United Kingdom Active Network Monitoring Industry Revenue (Million) Forecast, by Application 2019 & 2032
- Table 11: France Active Network Monitoring Industry Revenue (Million) Forecast, by Application 2019 & 2032
- Table 12: Global Active Network Monitoring Industry Revenue Million Forecast, by Country 2019 & 2032
- Table 13: India Active Network Monitoring Industry Revenue (Million) Forecast, by Application 2019 & 2032
- Table 14: China Active Network Monitoring Industry Revenue (Million) Forecast, by Application 2019 & 2032
- Table 15: Japan Active Network Monitoring Industry Revenue (Million) Forecast, by Application 2019 & 2032
- Table 16: Global Active Network Monitoring Industry Revenue Million Forecast, by Country 2019 & 2032
- Table 17: Active Network Monitoring Industry Revenue (Million) Forecast, by Application 2019 & 2032
- Table 18: Global Active Network Monitoring Industry Revenue Million Forecast, by Country 2019 & 2032
- Table 19: Active Network Monitoring Industry Revenue (Million) Forecast, by Application 2019 & 2032
- Table 20: Global Active Network Monitoring Industry Revenue Million Forecast, by Country 2019 & 2032
- Table 21: Active Network Monitoring Industry Revenue (Million) Forecast, by Application 2019 & 2032
- Table 22: Global Active Network Monitoring Industry Revenue Million Forecast, by Type 2019 & 2032
- Table 23: Global Active Network Monitoring Industry Revenue Million Forecast, by Application 2019 & 2032
- Table 24: Global Active Network Monitoring Industry Revenue Million Forecast, by Country 2019 & 2032
- Table 25: United States Active Network Monitoring Industry Revenue (Million) Forecast, by Application 2019 & 2032
- Table 26: Canada Active Network Monitoring Industry Revenue (Million) Forecast, by Application 2019 & 2032
- Table 27: Global Active Network Monitoring Industry Revenue Million Forecast, by Type 2019 & 2032
- Table 28: Global Active Network Monitoring Industry Revenue Million Forecast, by Application 2019 & 2032
- Table 29: Global Active Network Monitoring Industry Revenue Million Forecast, by Country 2019 & 2032
- Table 30: Germany Active Network Monitoring Industry Revenue (Million) Forecast, by Application 2019 & 2032
- Table 31: United Kingdom Active Network Monitoring Industry Revenue (Million) Forecast, by Application 2019 & 2032
- Table 32: France Active Network Monitoring Industry Revenue (Million) Forecast, by Application 2019 & 2032
- Table 33: Global Active Network Monitoring Industry Revenue Million Forecast, by Type 2019 & 2032
- Table 34: Global Active Network Monitoring Industry Revenue Million Forecast, by Application 2019 & 2032
- Table 35: Global Active Network Monitoring Industry Revenue Million Forecast, by Country 2019 & 2032
- Table 36: India Active Network Monitoring Industry Revenue (Million) Forecast, by Application 2019 & 2032
- Table 37: China Active Network Monitoring Industry Revenue (Million) Forecast, by Application 2019 & 2032
- Table 38: Japan Active Network Monitoring Industry Revenue (Million) Forecast, by Application 2019 & 2032
- Table 39: Global Active Network Monitoring Industry Revenue Million Forecast, by Type 2019 & 2032
- Table 40: Global Active Network Monitoring Industry Revenue Million Forecast, by Application 2019 & 2032
- Table 41: Global Active Network Monitoring Industry Revenue Million Forecast, by Country 2019 & 2032
- Table 42: Global Active Network Monitoring Industry Revenue Million Forecast, by Type 2019 & 2032
- Table 43: Global Active Network Monitoring Industry Revenue Million Forecast, by Application 2019 & 2032
- Table 44: Global Active Network Monitoring Industry Revenue Million Forecast, by Country 2019 & 2032
- Table 45: Global Active Network Monitoring Industry Revenue Million Forecast, by Type 2019 & 2032
- Table 46: Global Active Network Monitoring Industry Revenue Million Forecast, by Application 2019 & 2032
- Table 47: Global Active Network Monitoring Industry Revenue Million Forecast, by Country 2019 & 2032
Frequently Asked Questions
1. What is the projected Compound Annual Growth Rate (CAGR) of the Active Network Monitoring Industry?
The projected CAGR is approximately 16.48%.
2. Which companies are prominent players in the Active Network Monitoring Industry?
Key companies in the market include Itron Inc, Camlin Ltd, Argand Solutions, SolarWinds, Siemens AG, Landis+Gy, Schneider Electric SE, ABB Group, Chemtrols Industries Pvt Ltd, Smarter Grid Solutions Ltd, General Electric Company.
3. What are the main segments of the Active Network Monitoring Industry?
The market segments include Type, Application.
4. Can you provide details about the market size?
The market size is estimated to be USD 1.39 Million as of 2022.
5. What are some drivers contributing to market growth?
Growth in Renewable Energy Commercialization; Rising Number of Smart City Projects.
6. What are the notable trends driving market growth?
Grid Asset Monitoring to Hold the Significant Market Share.
7. Are there any restraints impacting market growth?
Stringent Environmental and Safety Regulations; Increasing Competition from the Unorganized Sectors.
8. Can you provide examples of recent developments in the market?
August 2023: GE Digital unveiled GridOS, an extensive software portfolio engineered to facilitate grid orchestration. Designed to revolutionize and shape the electric grid into a clean energy powerhouse, GridOS offers a robust and secure platform along with a suite of applications. This empowers utility companies across the globe with the resilience and adaptability essential for success in the clean energy transition. GridOS equips them with the necessary infrastructure from cloud service providers and system integrator partners, accelerating grid modernization and fostering the expansion of a clean energy grid.
9. What pricing options are available for accessing the report?
Pricing options include single-user, multi-user, and enterprise licenses priced at USD 4750, USD 5250, and USD 8750 respectively.
10. Is the market size provided in terms of value or volume?
The market size is provided in terms of value, measured in Million.
11. Are there any specific market keywords associated with the report?
Yes, the market keyword associated with the report is "Active Network Monitoring Industry," which aids in identifying and referencing the specific market segment covered.
12. How do I determine which pricing option suits my needs best?
The pricing options vary based on user requirements and access needs. Individual users may opt for single-user licenses, while businesses requiring broader access may choose multi-user or enterprise licenses for cost-effective access to the report.
13. Are there any additional resources or data provided in the Active Network Monitoring Industry report?
While the report offers comprehensive insights, it's advisable to review the specific contents or supplementary materials provided to ascertain if additional resources or data are available.
14. How can I stay updated on further developments or reports in the Active Network Monitoring Industry?
To stay informed about further developments, trends, and reports in the Active Network Monitoring Industry, consider subscribing to industry newsletters, following relevant companies and organizations, or regularly checking reputable industry news sources and publications.
Methodology
Step 1 - Identification of Relevant Samples Size from Population Database


Step 2 - Approaches for Defining Global Market Size (Value, Volume* & Price*)

Note*: In applicable scenarios
Step 3 - Data Sources
Primary Research
- Web Analytics
- Survey Reports
- Research Institute
- Latest Research Reports
- Opinion Leaders
Secondary Research
- Annual Reports
- White Paper
- Latest Press Release
- Industry Association
- Paid Database
- Investor Presentations

Step 4 - Data Triangulation
Involves using different sources of information in order to increase the validity of a study
These sources are likely to be stakeholders in a program - participants, other researchers, program staff, other community members, and so on.
Then we put all data in single framework & apply various statistical tools to find out the dynamic on the market.
During the analysis stage, feedback from the stakeholder groups would be compared to determine areas of agreement as well as areas of divergence


