
Key Insights
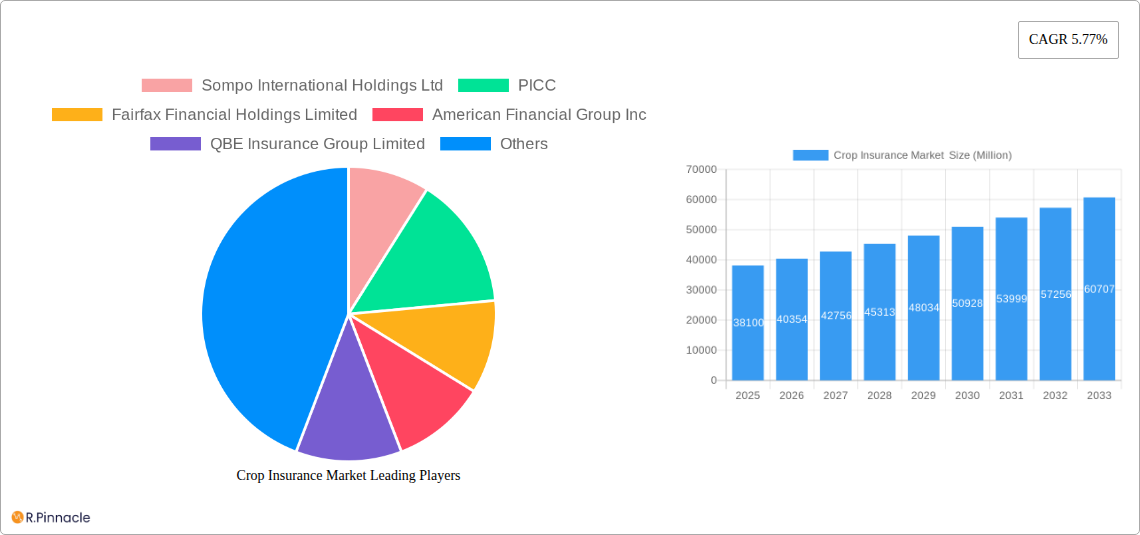
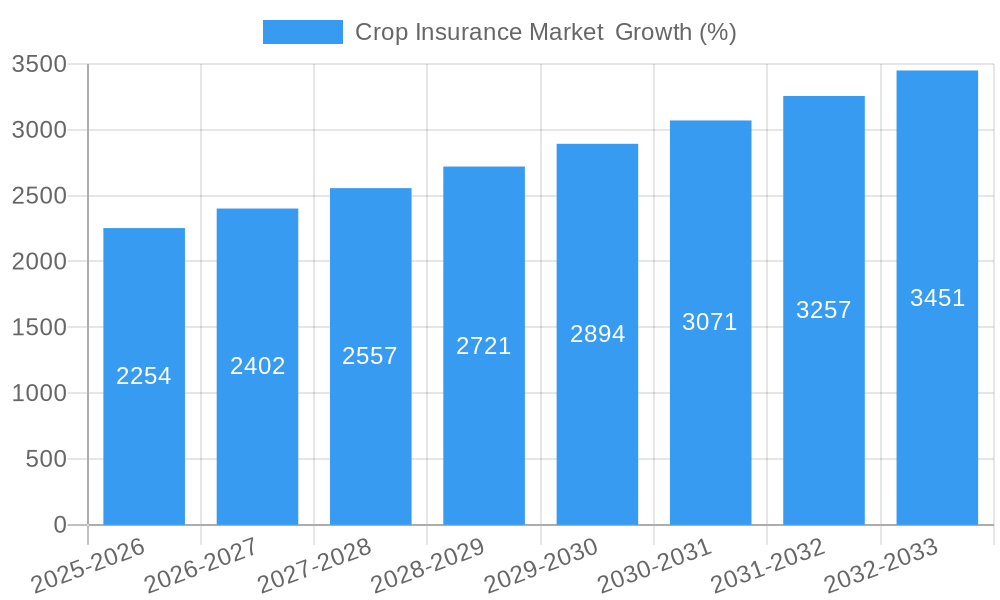
The global crop insurance market, valued at $38.10 billion in 2025, is projected to experience robust growth, exhibiting a Compound Annual Growth Rate (CAGR) of 5.77% from 2025 to 2033. This expansion is driven by several key factors. Increasing frequency and severity of extreme weather events, such as droughts, floods, and heatwaves, are compelling farmers to seek financial protection against crop failures. Government initiatives promoting agricultural insurance schemes, coupled with rising awareness among farmers about risk mitigation strategies, are further stimulating market growth. The market is segmented by coverage type (localized calamities, sowing/planting/germination risk, standing crop loss, post-harvest losses), distribution channel (banks, insurance companies, brokers and agents, other channels), and insurance type (multiple peril crop insurance, actual production history, crop revenue coverage). The multiple peril crop insurance segment is expected to dominate due to its comprehensive coverage against a wide range of risks. Banks and insurance companies constitute the major distribution channels, leveraging their extensive networks and established relationships with farmers.
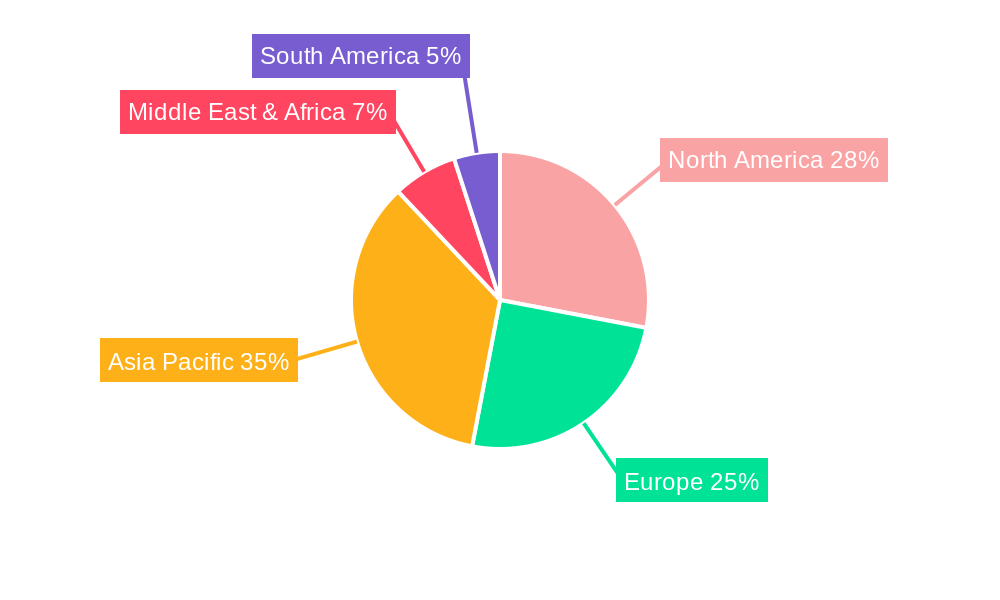
Geographically, the Asia-Pacific region, driven by large agricultural economies like India and China, is anticipated to hold a significant market share. North America and Europe also contribute substantially, owing to established agricultural insurance markets and higher insurance penetration rates. However, the Middle East and Africa region presents significant growth potential due to increasing government support for agricultural development and the rising adoption of advanced farming techniques, which necessitate corresponding risk management strategies. Competition within the market is intense, with both global players like Sompo International Holdings, PICC, Fairfax Financial, and American Financial Group, and regional insurers like ICICI Lombard and the Agriculture Insurance Company of India (AIC) vying for market share. The ongoing technological advancements in data analytics and remote sensing are further shaping the market, enabling more precise risk assessment and efficient claims processing.
Crop Insurance Market Report: 2019-2033
This comprehensive report provides a detailed analysis of the Crop Insurance Market, offering invaluable insights for industry professionals, investors, and stakeholders. With a study period spanning 2019-2033, a base year of 2025, and an estimated year of 2025, this report forecasts market trends through 2033, leveraging historical data from 2019-2024. The report segments the market by coverage type, distribution channel, and insurance type, providing a granular understanding of market dynamics and future potential. Projected market values are expressed in Millions (USD).
Crop Insurance Market Structure & Innovation Trends
This section analyzes the competitive landscape of the crop insurance market, examining market concentration, innovation drivers, regulatory frameworks, and M&A activities. The market shows moderate concentration, with key players such as Sompo International Holdings Ltd, PICC, Fairfax Financial Holdings Limited, American Financial Group Inc, QBE Insurance Group Limited, ICICI Lombard General Insurance Company Limited, Zurich, Chubb, Tokio Marine HCC, and Agriculture Insurance Company of India Limited (AIC) holding significant market share. However, the market remains fragmented, with numerous smaller regional players.
- Market Concentration: The top 5 players account for approximately xx% of the global market share in 2025 (estimated).
- Innovation Drivers: Technological advancements in data analytics, remote sensing, and precision agriculture are driving innovation, enabling more accurate risk assessment and efficient claims processing.
- Regulatory Frameworks: Government regulations and subsidies play a crucial role in shaping market dynamics, influencing both the adoption of crop insurance and the types of coverage offered. Varying regulations across different regions contribute to market fragmentation.
- Product Substitutes: Alternative risk management strategies such as diversification and hedging practices compete with traditional crop insurance.
- End-User Demographics: The primary end-users are farmers of varying sizes and agricultural businesses, with specific needs varying by crop type, geographical location, and farming practices.
- M&A Activities: Recent mergers and acquisitions, such as American Financial Group's acquisition of Crop Risk Services in July 2023, demonstrate consolidation within the industry. The total value of M&A deals in the crop insurance sector between 2019 and 2024 was approximately xx Million.
Crop Insurance Market Dynamics & Trends
The global crop insurance market is experiencing robust growth, driven by several key factors. Increasing frequency and severity of climate-related events, coupled with rising food prices and growing awareness of risk management among farmers, are fueling demand. Technological advancements in risk assessment and claims management are enhancing efficiency and affordability. Competitive dynamics remain intense, with companies focusing on product innovation, geographical expansion, and strategic partnerships to gain market share. The market is expected to exhibit a CAGR of xx% during the forecast period (2025-2033). Market penetration remains relatively low in many emerging economies, presenting significant growth opportunities.
Dominant Regions & Segments in Crop Insurance Market
The North American market currently dominates the global crop insurance landscape due to robust agricultural sectors and well-established insurance infrastructure. However, rapidly growing economies in Asia and other developing regions present significant untapped potential.
By Coverage:
- Standing Crop Loss: This segment holds the largest market share due to the significant financial risks associated with crop failures. Key drivers include unpredictable weather patterns and pest infestations.
- Multiple Peril Crop Insurance: This is the fastest-growing segment due to its comprehensive coverage against a wide range of risks.
- Localized Calamities: This segment is experiencing growth driven by increasing frequency of localized weather events.
- Sowing/Planting/Germination Risk: This segment is gaining traction as farmers seek protection against early-stage crop failures.
- Post-harvest Losses: This segment shows potential for future growth due to rising awareness of post-harvest losses and advancements in technology that facilitate accurate assessments.
By Distribution Channel:
- Insurance Companies: This remains the dominant distribution channel, leveraging their extensive networks and expertise.
- Banks: Banks are increasingly incorporating crop insurance into their financial services offerings, expanding reach to rural communities.
By Type:
- Multiple Peril Crop Insurance: The dominant type due to its comprehensive coverage.
Key Regional Drivers:
- North America: Government support programs and well-developed insurance infrastructure.
- Asia: Rapid economic growth, increasing agricultural production, and government initiatives promoting crop insurance.
Crop Insurance Market Product Innovations
Recent innovations in crop insurance include the integration of remote sensing technologies and data analytics for improved risk assessment and claims processing. This leads to more accurate pricing models, reduced administrative costs, and faster payouts for farmers. Furthermore, the development of parametric insurance products, which provide payouts based on pre-defined weather events, is gaining traction due to its ease of implementation and reduced reliance on individual crop assessments.
Report Scope & Segmentation Analysis
This report provides a comprehensive segmentation analysis of the crop insurance market across three key parameters:
By Coverage: Localized Calamities, Sowing/Planting/Germination Risk, Standing Crop Loss, Post-harvest Losses. Each segment is analysed with respect to market size, growth projections, and competitive dynamics. The Standing Crop Loss segment is projected to experience the highest growth over the forecast period.
By Distribution Channel: Banks, Insurance Companies, Brokers and Agents, Other Distribution Channels. Insurance companies dominate this segment, but banks are expanding rapidly.
By Type: Multiple Peril Crop Insurance, Actual Production History, Crop Revenue Coverage. Multiple Peril Crop Insurance is the largest and fastest-growing segment.
Key Drivers of Crop Insurance Market Growth
Several factors are driving the growth of the crop insurance market. These include increasing climate change risks leading to more frequent and severe weather events impacting crop yields. Government initiatives and subsidies aimed at promoting agricultural insurance are also key drivers, along with rising food prices and increasing awareness among farmers regarding risk management. Technological advancements, such as precision agriculture and remote sensing, are improving risk assessment and claims processing.
Challenges in the Crop Insurance Market Sector
Challenges facing the crop insurance market include high administrative costs, difficulties in accurately assessing crop losses, and the need for improved data collection and analysis in many regions. Furthermore, regulatory hurdles and lack of awareness among farmers in some regions hinder adoption. The impact of these challenges is estimated to limit market growth by approximately xx% over the forecast period.
Emerging Opportunities in Crop Insurance Market
Emerging opportunities lie in expanding insurance coverage to underinsured regions, particularly in developing countries. The development and adoption of innovative insurance products like index-based insurance and the use of advanced technologies, such as blockchain for improved transparency and efficiency, will also drive market expansion.
Leading Players in the Crop Insurance Market Market
- Sompo International Holdings Ltd
- PICC
- Fairfax Financial Holdings Limited
- American Financial Group Inc
- QBE Insurance Group Limited
- ICICI Lombard General Insurance Company Limited
- Zurich
- Chubb
- Tokio Marine HCC
- Agriculture Insurance Company of India Limited (AIC)
Key Developments in Crop Insurance Market Industry
- September 2023: Launch of the Shrimp Crop Insurance scheme by the Agricultural Insurance Company of India.
- July 2023: American Financial Group (AFG) completes the acquisition of Crop Risk Services (CRS) from AIG.
Future Outlook for Crop Insurance Market Market
The future of the crop insurance market is promising, with significant growth potential driven by several factors. Technological advancements, increasing climate change risks, and government support will continue to fuel market expansion. Strategic partnerships and product diversification will be key for companies to thrive in this evolving landscape. The market is expected to reach xx Million by 2033.
Crop Insurance Market Segmentation
-
1. Type
- 1.1. Multiple Peril Crop Insurance
- 1.2. Actual Production History
- 1.3. Crop Revenue Coverage
-
2. Coverage
- 2.1. Localized Calamities
- 2.2. Sowing/Planting/Germination Risk
- 2.3. Standing Crop Loss
- 2.4. Post-harvest Losses
-
3. Distribution Channel
- 3.1. Banks
- 3.2. Insurance Companies
- 3.3. Brokers and Agents
- 3.4. Other Distribution Channels
Crop Insurance Market Segmentation By Geography
-
1. North America
- 1.1. United States
- 1.2. Canada
- 1.3. Mexico
-
2. South America
- 2.1. Brazil
- 2.2. Argentina
- 2.3. Rest of South America
-
3. Europe
- 3.1. United Kingdom
- 3.2. Germany
- 3.3. France
- 3.4. Italy
- 3.5. Spain
- 3.6. Russia
- 3.7. Benelux
- 3.8. Nordics
- 3.9. Rest of Europe
-
4. Middle East & Africa
- 4.1. Turkey
- 4.2. Israel
- 4.3. GCC
- 4.4. North Africa
- 4.5. South Africa
- 4.6. Rest of Middle East & Africa
-
5. Asia Pacific
- 5.1. China
- 5.2. India
- 5.3. Japan
- 5.4. South Korea
- 5.5. ASEAN
- 5.6. Oceania
- 5.7. Rest of Asia Pacific
Crop Insurance Market REPORT HIGHLIGHTS
| Aspects | Details |
|---|---|
| Study Period | 2019-2033 |
| Base Year | 2024 |
| Estimated Year | 2025 |
| Forecast Period | 2025-2033 |
| Historical Period | 2019-2024 |
| Growth Rate | CAGR of 5.77% from 2019-2033 |
| Segmentation |
|
Table of Contents
- 1. Introduction
- 1.1. Research Scope
- 1.2. Market Segmentation
- 1.3. Research Methodology
- 1.4. Definitions and Assumptions
- 2. Executive Summary
- 2.1. Introduction
- 3. Market Dynamics
- 3.1. Introduction
- 3.2. Market Drivers
- 3.2.1 Government Support
- 3.2.2 Including Subsidies and Initiatives
- 3.2.3 is a Significant Driver
- 3.3. Market Restrains
- 3.3.1. Instances of Fraud or Misreporting can Impact the Integrity of the Crop Insurance System
- 3.4. Market Trends
- 3.4.1. Increasing Value Crop Protection Globally
- 4. Market Factor Analysis
- 4.1. Porters Five Forces
- 4.2. Supply/Value Chain
- 4.3. PESTEL analysis
- 4.4. Market Entropy
- 4.5. Patent/Trademark Analysis
- 5. Global Crop Insurance Market Analysis, Insights and Forecast, 2019-2031
- 5.1. Market Analysis, Insights and Forecast - by Type
- 5.1.1. Multiple Peril Crop Insurance
- 5.1.2. Actual Production History
- 5.1.3. Crop Revenue Coverage
- 5.2. Market Analysis, Insights and Forecast - by Coverage
- 5.2.1. Localized Calamities
- 5.2.2. Sowing/Planting/Germination Risk
- 5.2.3. Standing Crop Loss
- 5.2.4. Post-harvest Losses
- 5.3. Market Analysis, Insights and Forecast - by Distribution Channel
- 5.3.1. Banks
- 5.3.2. Insurance Companies
- 5.3.3. Brokers and Agents
- 5.3.4. Other Distribution Channels
- 5.4. Market Analysis, Insights and Forecast - by Region
- 5.4.1. North America
- 5.4.2. South America
- 5.4.3. Europe
- 5.4.4. Middle East & Africa
- 5.4.5. Asia Pacific
- 5.1. Market Analysis, Insights and Forecast - by Type
- 6. North America Crop Insurance Market Analysis, Insights and Forecast, 2019-2031
- 6.1. Market Analysis, Insights and Forecast - by Type
- 6.1.1. Multiple Peril Crop Insurance
- 6.1.2. Actual Production History
- 6.1.3. Crop Revenue Coverage
- 6.2. Market Analysis, Insights and Forecast - by Coverage
- 6.2.1. Localized Calamities
- 6.2.2. Sowing/Planting/Germination Risk
- 6.2.3. Standing Crop Loss
- 6.2.4. Post-harvest Losses
- 6.3. Market Analysis, Insights and Forecast - by Distribution Channel
- 6.3.1. Banks
- 6.3.2. Insurance Companies
- 6.3.3. Brokers and Agents
- 6.3.4. Other Distribution Channels
- 6.1. Market Analysis, Insights and Forecast - by Type
- 7. South America Crop Insurance Market Analysis, Insights and Forecast, 2019-2031
- 7.1. Market Analysis, Insights and Forecast - by Type
- 7.1.1. Multiple Peril Crop Insurance
- 7.1.2. Actual Production History
- 7.1.3. Crop Revenue Coverage
- 7.2. Market Analysis, Insights and Forecast - by Coverage
- 7.2.1. Localized Calamities
- 7.2.2. Sowing/Planting/Germination Risk
- 7.2.3. Standing Crop Loss
- 7.2.4. Post-harvest Losses
- 7.3. Market Analysis, Insights and Forecast - by Distribution Channel
- 7.3.1. Banks
- 7.3.2. Insurance Companies
- 7.3.3. Brokers and Agents
- 7.3.4. Other Distribution Channels
- 7.1. Market Analysis, Insights and Forecast - by Type
- 8. Europe Crop Insurance Market Analysis, Insights and Forecast, 2019-2031
- 8.1. Market Analysis, Insights and Forecast - by Type
- 8.1.1. Multiple Peril Crop Insurance
- 8.1.2. Actual Production History
- 8.1.3. Crop Revenue Coverage
- 8.2. Market Analysis, Insights and Forecast - by Coverage
- 8.2.1. Localized Calamities
- 8.2.2. Sowing/Planting/Germination Risk
- 8.2.3. Standing Crop Loss
- 8.2.4. Post-harvest Losses
- 8.3. Market Analysis, Insights and Forecast - by Distribution Channel
- 8.3.1. Banks
- 8.3.2. Insurance Companies
- 8.3.3. Brokers and Agents
- 8.3.4. Other Distribution Channels
- 8.1. Market Analysis, Insights and Forecast - by Type
- 9. Middle East & Africa Crop Insurance Market Analysis, Insights and Forecast, 2019-2031
- 9.1. Market Analysis, Insights and Forecast - by Type
- 9.1.1. Multiple Peril Crop Insurance
- 9.1.2. Actual Production History
- 9.1.3. Crop Revenue Coverage
- 9.2. Market Analysis, Insights and Forecast - by Coverage
- 9.2.1. Localized Calamities
- 9.2.2. Sowing/Planting/Germination Risk
- 9.2.3. Standing Crop Loss
- 9.2.4. Post-harvest Losses
- 9.3. Market Analysis, Insights and Forecast - by Distribution Channel
- 9.3.1. Banks
- 9.3.2. Insurance Companies
- 9.3.3. Brokers and Agents
- 9.3.4. Other Distribution Channels
- 9.1. Market Analysis, Insights and Forecast - by Type
- 10. Asia Pacific Crop Insurance Market Analysis, Insights and Forecast, 2019-2031
- 10.1. Market Analysis, Insights and Forecast - by Type
- 10.1.1. Multiple Peril Crop Insurance
- 10.1.2. Actual Production History
- 10.1.3. Crop Revenue Coverage
- 10.2. Market Analysis, Insights and Forecast - by Coverage
- 10.2.1. Localized Calamities
- 10.2.2. Sowing/Planting/Germination Risk
- 10.2.3. Standing Crop Loss
- 10.2.4. Post-harvest Losses
- 10.3. Market Analysis, Insights and Forecast - by Distribution Channel
- 10.3.1. Banks
- 10.3.2. Insurance Companies
- 10.3.3. Brokers and Agents
- 10.3.4. Other Distribution Channels
- 10.1. Market Analysis, Insights and Forecast - by Type
- 11. North America Crop Insurance Market Analysis, Insights and Forecast, 2019-2031
- 11.1. Market Analysis, Insights and Forecast - By Country/Sub-region
- 11.1.1 United States
- 11.1.2 Canada
- 11.1.3 Mexico
- 12. South America Crop Insurance Market Analysis, Insights and Forecast, 2019-2031
- 12.1. Market Analysis, Insights and Forecast - By Country/Sub-region
- 12.1.1 Brazil
- 12.1.2 Argentina
- 12.1.3 Rest of South America
- 13. Europe Crop Insurance Market Analysis, Insights and Forecast, 2019-2031
- 13.1. Market Analysis, Insights and Forecast - By Country/Sub-region
- 13.1.1 Germany
- 13.1.2 France
- 13.1.3 Italy
- 13.1.4 United Kingdom
- 13.1.5 Netherlands
- 13.1.6 Sweden
- 13.1.7 Rest of Europe
- 14. Asia Pacific Crop Insurance Market Analysis, Insights and Forecast, 2019-2031
- 14.1. Market Analysis, Insights and Forecast - By Country/Sub-region
- 14.1.1 China
- 14.1.2 Japan
- 14.1.3 India
- 14.1.4 South Korea
- 14.1.5 Taiwan
- 14.1.6 Australia
- 14.1.7 Rest of Asia-Pacific
- 15. Middle East & Africa Crop Insurance Market Analysis, Insights and Forecast, 2019-2031
- 15.1. Market Analysis, Insights and Forecast - By Country/Sub-region
- 15.1.1 UAE
- 15.1.2 South Africa
- 15.1.3 Saudi Arabia
- 15.1.4 Rest of MEA
- 16. Competitive Analysis
- 16.1. Global Market Share Analysis 2024
- 16.2. Company Profiles
- 16.2.1 Sompo International Holdings Ltd
- 16.2.1.1. Overview
- 16.2.1.2. Products
- 16.2.1.3. SWOT Analysis
- 16.2.1.4. Recent Developments
- 16.2.1.5. Financials (Based on Availability)
- 16.2.2 PICC
- 16.2.2.1. Overview
- 16.2.2.2. Products
- 16.2.2.3. SWOT Analysis
- 16.2.2.4. Recent Developments
- 16.2.2.5. Financials (Based on Availability)
- 16.2.3 Fairfax Financial Holdings Limited
- 16.2.3.1. Overview
- 16.2.3.2. Products
- 16.2.3.3. SWOT Analysis
- 16.2.3.4. Recent Developments
- 16.2.3.5. Financials (Based on Availability)
- 16.2.4 American Financial Group Inc
- 16.2.4.1. Overview
- 16.2.4.2. Products
- 16.2.4.3. SWOT Analysis
- 16.2.4.4. Recent Developments
- 16.2.4.5. Financials (Based on Availability)
- 16.2.5 QBE Insurance Group Limited
- 16.2.5.1. Overview
- 16.2.5.2. Products
- 16.2.5.3. SWOT Analysis
- 16.2.5.4. Recent Developments
- 16.2.5.5. Financials (Based on Availability)
- 16.2.6 ICICI Lombard General Insurance Company Limited
- 16.2.6.1. Overview
- 16.2.6.2. Products
- 16.2.6.3. SWOT Analysis
- 16.2.6.4. Recent Developments
- 16.2.6.5. Financials (Based on Availability)
- 16.2.7 Zurich**List Not Exhaustive
- 16.2.7.1. Overview
- 16.2.7.2. Products
- 16.2.7.3. SWOT Analysis
- 16.2.7.4. Recent Developments
- 16.2.7.5. Financials (Based on Availability)
- 16.2.8 Chubb
- 16.2.8.1. Overview
- 16.2.8.2. Products
- 16.2.8.3. SWOT Analysis
- 16.2.8.4. Recent Developments
- 16.2.8.5. Financials (Based on Availability)
- 16.2.9 Tokio Marine HCC
- 16.2.9.1. Overview
- 16.2.9.2. Products
- 16.2.9.3. SWOT Analysis
- 16.2.9.4. Recent Developments
- 16.2.9.5. Financials (Based on Availability)
- 16.2.10 Agriculture Insurance Company of India Limited (AIC)
- 16.2.10.1. Overview
- 16.2.10.2. Products
- 16.2.10.3. SWOT Analysis
- 16.2.10.4. Recent Developments
- 16.2.10.5. Financials (Based on Availability)
- 16.2.1 Sompo International Holdings Ltd
List of Figures
- Figure 1: Global Crop Insurance Market Revenue Breakdown (Million, %) by Region 2024 & 2032
- Figure 2: North America Crop Insurance Market Revenue (Million), by Country 2024 & 2032
- Figure 3: North America Crop Insurance Market Revenue Share (%), by Country 2024 & 2032
- Figure 4: South America Crop Insurance Market Revenue (Million), by Country 2024 & 2032
- Figure 5: South America Crop Insurance Market Revenue Share (%), by Country 2024 & 2032
- Figure 6: Europe Crop Insurance Market Revenue (Million), by Country 2024 & 2032
- Figure 7: Europe Crop Insurance Market Revenue Share (%), by Country 2024 & 2032
- Figure 8: Asia Pacific Crop Insurance Market Revenue (Million), by Country 2024 & 2032
- Figure 9: Asia Pacific Crop Insurance Market Revenue Share (%), by Country 2024 & 2032
- Figure 10: Middle East & Africa Crop Insurance Market Revenue (Million), by Country 2024 & 2032
- Figure 11: Middle East & Africa Crop Insurance Market Revenue Share (%), by Country 2024 & 2032
- Figure 12: North America Crop Insurance Market Revenue (Million), by Type 2024 & 2032
- Figure 13: North America Crop Insurance Market Revenue Share (%), by Type 2024 & 2032
- Figure 14: North America Crop Insurance Market Revenue (Million), by Coverage 2024 & 2032
- Figure 15: North America Crop Insurance Market Revenue Share (%), by Coverage 2024 & 2032
- Figure 16: North America Crop Insurance Market Revenue (Million), by Distribution Channel 2024 & 2032
- Figure 17: North America Crop Insurance Market Revenue Share (%), by Distribution Channel 2024 & 2032
- Figure 18: North America Crop Insurance Market Revenue (Million), by Country 2024 & 2032
- Figure 19: North America Crop Insurance Market Revenue Share (%), by Country 2024 & 2032
- Figure 20: South America Crop Insurance Market Revenue (Million), by Type 2024 & 2032
- Figure 21: South America Crop Insurance Market Revenue Share (%), by Type 2024 & 2032
- Figure 22: South America Crop Insurance Market Revenue (Million), by Coverage 2024 & 2032
- Figure 23: South America Crop Insurance Market Revenue Share (%), by Coverage 2024 & 2032
- Figure 24: South America Crop Insurance Market Revenue (Million), by Distribution Channel 2024 & 2032
- Figure 25: South America Crop Insurance Market Revenue Share (%), by Distribution Channel 2024 & 2032
- Figure 26: South America Crop Insurance Market Revenue (Million), by Country 2024 & 2032
- Figure 27: South America Crop Insurance Market Revenue Share (%), by Country 2024 & 2032
- Figure 28: Europe Crop Insurance Market Revenue (Million), by Type 2024 & 2032
- Figure 29: Europe Crop Insurance Market Revenue Share (%), by Type 2024 & 2032
- Figure 30: Europe Crop Insurance Market Revenue (Million), by Coverage 2024 & 2032
- Figure 31: Europe Crop Insurance Market Revenue Share (%), by Coverage 2024 & 2032
- Figure 32: Europe Crop Insurance Market Revenue (Million), by Distribution Channel 2024 & 2032
- Figure 33: Europe Crop Insurance Market Revenue Share (%), by Distribution Channel 2024 & 2032
- Figure 34: Europe Crop Insurance Market Revenue (Million), by Country 2024 & 2032
- Figure 35: Europe Crop Insurance Market Revenue Share (%), by Country 2024 & 2032
- Figure 36: Middle East & Africa Crop Insurance Market Revenue (Million), by Type 2024 & 2032
- Figure 37: Middle East & Africa Crop Insurance Market Revenue Share (%), by Type 2024 & 2032
- Figure 38: Middle East & Africa Crop Insurance Market Revenue (Million), by Coverage 2024 & 2032
- Figure 39: Middle East & Africa Crop Insurance Market Revenue Share (%), by Coverage 2024 & 2032
- Figure 40: Middle East & Africa Crop Insurance Market Revenue (Million), by Distribution Channel 2024 & 2032
- Figure 41: Middle East & Africa Crop Insurance Market Revenue Share (%), by Distribution Channel 2024 & 2032
- Figure 42: Middle East & Africa Crop Insurance Market Revenue (Million), by Country 2024 & 2032
- Figure 43: Middle East & Africa Crop Insurance Market Revenue Share (%), by Country 2024 & 2032
- Figure 44: Asia Pacific Crop Insurance Market Revenue (Million), by Type 2024 & 2032
- Figure 45: Asia Pacific Crop Insurance Market Revenue Share (%), by Type 2024 & 2032
- Figure 46: Asia Pacific Crop Insurance Market Revenue (Million), by Coverage 2024 & 2032
- Figure 47: Asia Pacific Crop Insurance Market Revenue Share (%), by Coverage 2024 & 2032
- Figure 48: Asia Pacific Crop Insurance Market Revenue (Million), by Distribution Channel 2024 & 2032
- Figure 49: Asia Pacific Crop Insurance Market Revenue Share (%), by Distribution Channel 2024 & 2032
- Figure 50: Asia Pacific Crop Insurance Market Revenue (Million), by Country 2024 & 2032
- Figure 51: Asia Pacific Crop Insurance Market Revenue Share (%), by Country 2024 & 2032
List of Tables
- Table 1: Global Crop Insurance Market Revenue Million Forecast, by Region 2019 & 2032
- Table 2: Global Crop Insurance Market Revenue Million Forecast, by Type 2019 & 2032
- Table 3: Global Crop Insurance Market Revenue Million Forecast, by Coverage 2019 & 2032
- Table 4: Global Crop Insurance Market Revenue Million Forecast, by Distribution Channel 2019 & 2032
- Table 5: Global Crop Insurance Market Revenue Million Forecast, by Region 2019 & 2032
- Table 6: Global Crop Insurance Market Revenue Million Forecast, by Country 2019 & 2032
- Table 7: United States Crop Insurance Market Revenue (Million) Forecast, by Application 2019 & 2032
- Table 8: Canada Crop Insurance Market Revenue (Million) Forecast, by Application 2019 & 2032
- Table 9: Mexico Crop Insurance Market Revenue (Million) Forecast, by Application 2019 & 2032
- Table 10: Global Crop Insurance Market Revenue Million Forecast, by Country 2019 & 2032
- Table 11: Brazil Crop Insurance Market Revenue (Million) Forecast, by Application 2019 & 2032
- Table 12: Argentina Crop Insurance Market Revenue (Million) Forecast, by Application 2019 & 2032
- Table 13: Rest of South America Crop Insurance Market Revenue (Million) Forecast, by Application 2019 & 2032
- Table 14: Global Crop Insurance Market Revenue Million Forecast, by Country 2019 & 2032
- Table 15: Germany Crop Insurance Market Revenue (Million) Forecast, by Application 2019 & 2032
- Table 16: France Crop Insurance Market Revenue (Million) Forecast, by Application 2019 & 2032
- Table 17: Italy Crop Insurance Market Revenue (Million) Forecast, by Application 2019 & 2032
- Table 18: United Kingdom Crop Insurance Market Revenue (Million) Forecast, by Application 2019 & 2032
- Table 19: Netherlands Crop Insurance Market Revenue (Million) Forecast, by Application 2019 & 2032
- Table 20: Sweden Crop Insurance Market Revenue (Million) Forecast, by Application 2019 & 2032
- Table 21: Rest of Europe Crop Insurance Market Revenue (Million) Forecast, by Application 2019 & 2032
- Table 22: Global Crop Insurance Market Revenue Million Forecast, by Country 2019 & 2032
- Table 23: China Crop Insurance Market Revenue (Million) Forecast, by Application 2019 & 2032
- Table 24: Japan Crop Insurance Market Revenue (Million) Forecast, by Application 2019 & 2032
- Table 25: India Crop Insurance Market Revenue (Million) Forecast, by Application 2019 & 2032
- Table 26: South Korea Crop Insurance Market Revenue (Million) Forecast, by Application 2019 & 2032
- Table 27: Taiwan Crop Insurance Market Revenue (Million) Forecast, by Application 2019 & 2032
- Table 28: Australia Crop Insurance Market Revenue (Million) Forecast, by Application 2019 & 2032
- Table 29: Rest of Asia-Pacific Crop Insurance Market Revenue (Million) Forecast, by Application 2019 & 2032
- Table 30: Global Crop Insurance Market Revenue Million Forecast, by Country 2019 & 2032
- Table 31: UAE Crop Insurance Market Revenue (Million) Forecast, by Application 2019 & 2032
- Table 32: South Africa Crop Insurance Market Revenue (Million) Forecast, by Application 2019 & 2032
- Table 33: Saudi Arabia Crop Insurance Market Revenue (Million) Forecast, by Application 2019 & 2032
- Table 34: Rest of MEA Crop Insurance Market Revenue (Million) Forecast, by Application 2019 & 2032
- Table 35: Global Crop Insurance Market Revenue Million Forecast, by Type 2019 & 2032
- Table 36: Global Crop Insurance Market Revenue Million Forecast, by Coverage 2019 & 2032
- Table 37: Global Crop Insurance Market Revenue Million Forecast, by Distribution Channel 2019 & 2032
- Table 38: Global Crop Insurance Market Revenue Million Forecast, by Country 2019 & 2032
- Table 39: United States Crop Insurance Market Revenue (Million) Forecast, by Application 2019 & 2032
- Table 40: Canada Crop Insurance Market Revenue (Million) Forecast, by Application 2019 & 2032
- Table 41: Mexico Crop Insurance Market Revenue (Million) Forecast, by Application 2019 & 2032
- Table 42: Global Crop Insurance Market Revenue Million Forecast, by Type 2019 & 2032
- Table 43: Global Crop Insurance Market Revenue Million Forecast, by Coverage 2019 & 2032
- Table 44: Global Crop Insurance Market Revenue Million Forecast, by Distribution Channel 2019 & 2032
- Table 45: Global Crop Insurance Market Revenue Million Forecast, by Country 2019 & 2032
- Table 46: Brazil Crop Insurance Market Revenue (Million) Forecast, by Application 2019 & 2032
- Table 47: Argentina Crop Insurance Market Revenue (Million) Forecast, by Application 2019 & 2032
- Table 48: Rest of South America Crop Insurance Market Revenue (Million) Forecast, by Application 2019 & 2032
- Table 49: Global Crop Insurance Market Revenue Million Forecast, by Type 2019 & 2032
- Table 50: Global Crop Insurance Market Revenue Million Forecast, by Coverage 2019 & 2032
- Table 51: Global Crop Insurance Market Revenue Million Forecast, by Distribution Channel 2019 & 2032
- Table 52: Global Crop Insurance Market Revenue Million Forecast, by Country 2019 & 2032
- Table 53: United Kingdom Crop Insurance Market Revenue (Million) Forecast, by Application 2019 & 2032
- Table 54: Germany Crop Insurance Market Revenue (Million) Forecast, by Application 2019 & 2032
- Table 55: France Crop Insurance Market Revenue (Million) Forecast, by Application 2019 & 2032
- Table 56: Italy Crop Insurance Market Revenue (Million) Forecast, by Application 2019 & 2032
- Table 57: Spain Crop Insurance Market Revenue (Million) Forecast, by Application 2019 & 2032
- Table 58: Russia Crop Insurance Market Revenue (Million) Forecast, by Application 2019 & 2032
- Table 59: Benelux Crop Insurance Market Revenue (Million) Forecast, by Application 2019 & 2032
- Table 60: Nordics Crop Insurance Market Revenue (Million) Forecast, by Application 2019 & 2032
- Table 61: Rest of Europe Crop Insurance Market Revenue (Million) Forecast, by Application 2019 & 2032
- Table 62: Global Crop Insurance Market Revenue Million Forecast, by Type 2019 & 2032
- Table 63: Global Crop Insurance Market Revenue Million Forecast, by Coverage 2019 & 2032
- Table 64: Global Crop Insurance Market Revenue Million Forecast, by Distribution Channel 2019 & 2032
- Table 65: Global Crop Insurance Market Revenue Million Forecast, by Country 2019 & 2032
- Table 66: Turkey Crop Insurance Market Revenue (Million) Forecast, by Application 2019 & 2032
- Table 67: Israel Crop Insurance Market Revenue (Million) Forecast, by Application 2019 & 2032
- Table 68: GCC Crop Insurance Market Revenue (Million) Forecast, by Application 2019 & 2032
- Table 69: North Africa Crop Insurance Market Revenue (Million) Forecast, by Application 2019 & 2032
- Table 70: South Africa Crop Insurance Market Revenue (Million) Forecast, by Application 2019 & 2032
- Table 71: Rest of Middle East & Africa Crop Insurance Market Revenue (Million) Forecast, by Application 2019 & 2032
- Table 72: Global Crop Insurance Market Revenue Million Forecast, by Type 2019 & 2032
- Table 73: Global Crop Insurance Market Revenue Million Forecast, by Coverage 2019 & 2032
- Table 74: Global Crop Insurance Market Revenue Million Forecast, by Distribution Channel 2019 & 2032
- Table 75: Global Crop Insurance Market Revenue Million Forecast, by Country 2019 & 2032
- Table 76: China Crop Insurance Market Revenue (Million) Forecast, by Application 2019 & 2032
- Table 77: India Crop Insurance Market Revenue (Million) Forecast, by Application 2019 & 2032
- Table 78: Japan Crop Insurance Market Revenue (Million) Forecast, by Application 2019 & 2032
- Table 79: South Korea Crop Insurance Market Revenue (Million) Forecast, by Application 2019 & 2032
- Table 80: ASEAN Crop Insurance Market Revenue (Million) Forecast, by Application 2019 & 2032
- Table 81: Oceania Crop Insurance Market Revenue (Million) Forecast, by Application 2019 & 2032
- Table 82: Rest of Asia Pacific Crop Insurance Market Revenue (Million) Forecast, by Application 2019 & 2032
Frequently Asked Questions
1. What is the projected Compound Annual Growth Rate (CAGR) of the Crop Insurance Market ?
The projected CAGR is approximately 5.77%.
2. Which companies are prominent players in the Crop Insurance Market ?
Key companies in the market include Sompo International Holdings Ltd, PICC, Fairfax Financial Holdings Limited, American Financial Group Inc, QBE Insurance Group Limited, ICICI Lombard General Insurance Company Limited, Zurich**List Not Exhaustive, Chubb, Tokio Marine HCC, Agriculture Insurance Company of India Limited (AIC).
3. What are the main segments of the Crop Insurance Market ?
The market segments include Type, Coverage, Distribution Channel.
4. Can you provide details about the market size?
The market size is estimated to be USD 38.10 Million as of 2022.
5. What are some drivers contributing to market growth?
Government Support. Including Subsidies and Initiatives. is a Significant Driver.
6. What are the notable trends driving market growth?
Increasing Value Crop Protection Globally.
7. Are there any restraints impacting market growth?
Instances of Fraud or Misreporting can Impact the Integrity of the Crop Insurance System.
8. Can you provide examples of recent developments in the market?
September 2023: The Shrimp Crop Insurance scheme developed by the Agricultural Insurance Company was launched in India. The insurance cover starts from the initial stage to 130 days till the shrimps are ready.
9. What pricing options are available for accessing the report?
Pricing options include single-user, multi-user, and enterprise licenses priced at USD 3800, USD 4500, and USD 5800 respectively.
10. Is the market size provided in terms of value or volume?
The market size is provided in terms of value, measured in Million.
11. Are there any specific market keywords associated with the report?
Yes, the market keyword associated with the report is "Crop Insurance Market ," which aids in identifying and referencing the specific market segment covered.
12. How do I determine which pricing option suits my needs best?
The pricing options vary based on user requirements and access needs. Individual users may opt for single-user licenses, while businesses requiring broader access may choose multi-user or enterprise licenses for cost-effective access to the report.
13. Are there any additional resources or data provided in the Crop Insurance Market report?
While the report offers comprehensive insights, it's advisable to review the specific contents or supplementary materials provided to ascertain if additional resources or data are available.
14. How can I stay updated on further developments or reports in the Crop Insurance Market ?
To stay informed about further developments, trends, and reports in the Crop Insurance Market , consider subscribing to industry newsletters, following relevant companies and organizations, or regularly checking reputable industry news sources and publications.
Methodology
Step 1 - Identification of Relevant Samples Size from Population Database


Step 2 - Approaches for Defining Global Market Size (Value, Volume* & Price*)

Note*: In applicable scenarios
Step 3 - Data Sources
Primary Research
- Web Analytics
- Survey Reports
- Research Institute
- Latest Research Reports
- Opinion Leaders
Secondary Research
- Annual Reports
- White Paper
- Latest Press Release
- Industry Association
- Paid Database
- Investor Presentations

Step 4 - Data Triangulation
Involves using different sources of information in order to increase the validity of a study
These sources are likely to be stakeholders in a program - participants, other researchers, program staff, other community members, and so on.
Then we put all data in single framework & apply various statistical tools to find out the dynamic on the market.
During the analysis stage, feedback from the stakeholder groups would be compared to determine areas of agreement as well as areas of divergence


