
Key Insights
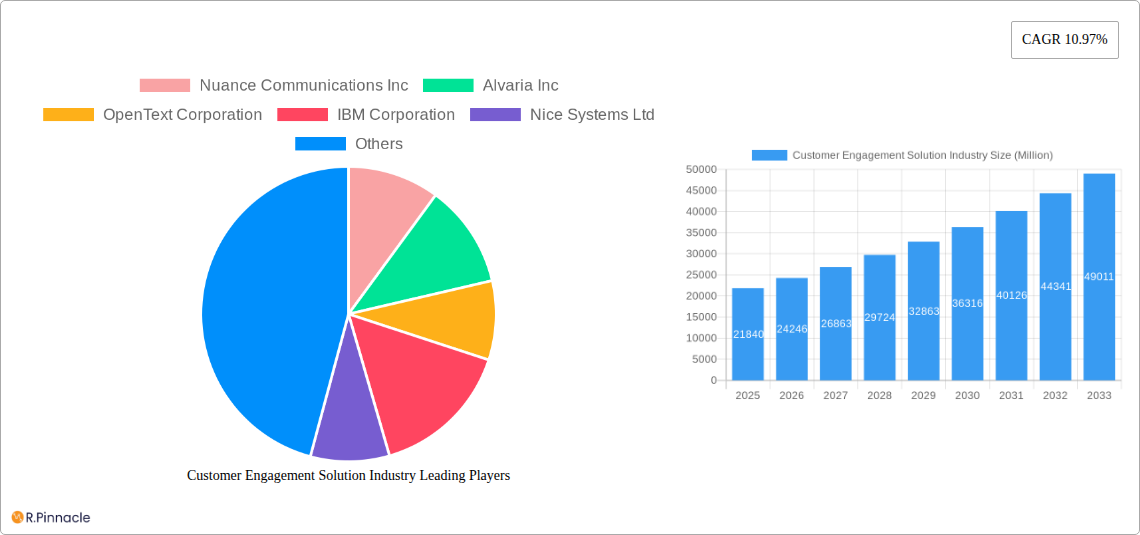
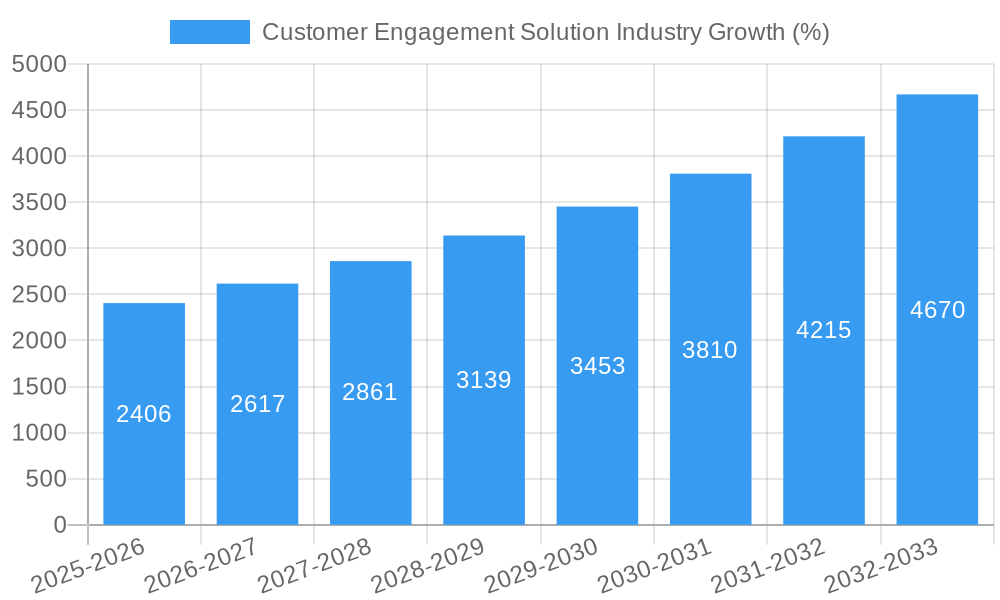
The Customer Engagement Solutions market, valued at $21.84 billion in 2025, is projected to experience robust growth, exhibiting a Compound Annual Growth Rate (CAGR) of 10.97% from 2025 to 2033. This expansion is fueled by several key factors. The increasing adoption of cloud-based solutions offers scalability and cost-effectiveness, driving market penetration across various organization sizes, from small and medium enterprises (SMEs) to large enterprises. Furthermore, the rising demand for personalized customer experiences and omnichannel engagement strategies is prompting businesses across sectors like BFSI (Banking, Financial Services, and Insurance), Telecom & IT, Retail & Consumer Goods, and Media & Entertainment to invest heavily in sophisticated customer engagement platforms. Advanced features like AI-powered chatbots, predictive analytics for improved customer service, and robust CRM integration are further accelerating market growth. Competition among established players like Nuance Communications, Alvaria, OpenText, IBM, and Salesforce, alongside emerging technology providers, fosters innovation and drives down costs, making these solutions accessible to a broader range of businesses.
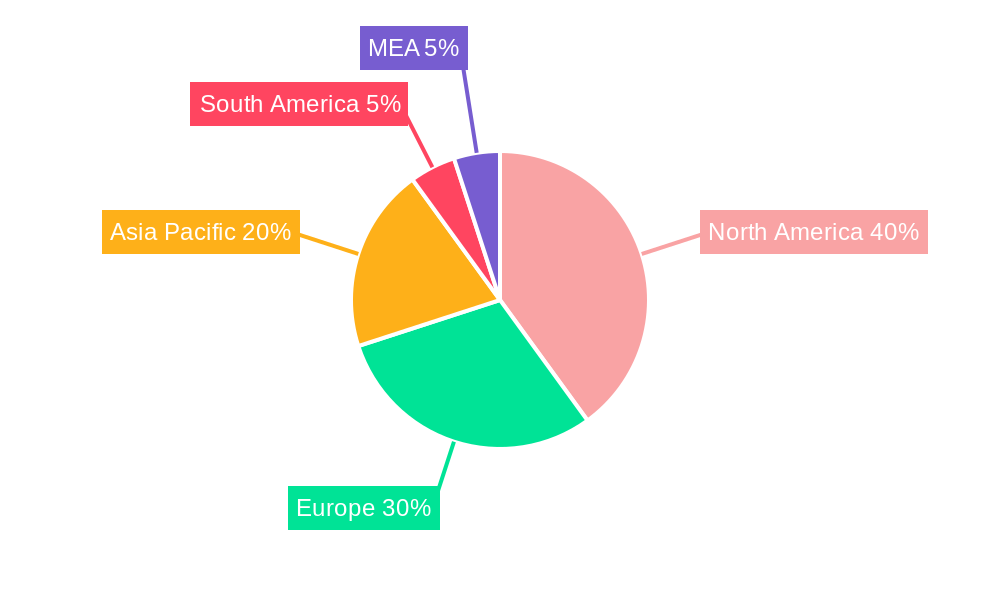
The market segmentation reveals a dynamic landscape. While solutions and services hold significant market share, the growth of Robotic Process Optimization (RPO) and self-service options within "Other Solutions" signifies an increasing automation trend. Cloud deployment is expected to dominate, surpassing on-premise solutions due to its inherent flexibility and accessibility. Large enterprises currently represent a larger market segment, but the SME sector is poised for substantial growth driven by affordability and ease of implementation of cloud-based solutions. Geographically, North America and Europe currently hold a significant market share, but the Asia-Pacific region is projected to witness the highest growth rate due to rapid digitalization and increasing adoption of advanced technologies in developing economies. Sustained investment in research and development by major players is expected to fuel the development of more innovative and integrated customer engagement solutions, ultimately driving further market expansion throughout the forecast period.
Customer Engagement Solution Industry Report: A Comprehensive Market Analysis (2019-2033)
This in-depth report provides a comprehensive analysis of the Customer Engagement Solution industry, offering actionable insights for industry professionals and strategic decision-makers. With a study period spanning 2019-2033, a base year of 2025, and a forecast period of 2025-2033, this report leverages extensive market data and expert analysis to illuminate key trends, opportunities, and challenges. The total market size is estimated to reach xx Million by 2025, exhibiting a robust CAGR of xx% during the forecast period.
Customer Engagement Solution Industry Market Structure & Innovation Trends
The Customer Engagement Solution market is characterized by a moderately concentrated structure, with key players such as Nuance Communications Inc, Alvaria Inc, OpenText Corporation, IBM Corporation, Nice Systems Ltd, SAP SE, Salesforce.com Inc, Avaya Inc, Pegasystems Inc, Verint Systems Inc, Genesys, Oracle Corporation, and Calabrio Inc. holding significant market share. The combined market share of the top 5 players is estimated at xx%. Innovation is driven by advancements in AI, machine learning, and cloud computing, leading to the development of sophisticated omnichannel solutions. Regulatory frameworks, particularly concerning data privacy (GDPR, CCPA), significantly influence market dynamics. Product substitutes, such as traditional customer service methods, face increasing competition due to the enhanced efficiency and personalization offered by customer engagement solutions. The end-user demographic is diversifying, encompassing both SMEs and large enterprises across various sectors. M&A activity has been substantial, with notable deals totaling over xx Million in the past five years.
- Market Concentration: Top 5 players hold xx% market share.
- Innovation Drivers: AI, Machine Learning, Cloud Computing.
- Regulatory Impact: GDPR, CCPA compliance mandates.
- M&A Activity: Total deal value exceeding xx Million in the last 5 years.
Customer Engagement Solution Industry Market Dynamics & Trends
The Customer Engagement Solution market is experiencing significant growth, fueled by the increasing adoption of digital channels, the rising demand for personalized customer experiences, and the growing need for efficient customer service management. Technological disruptions, such as the rise of AI-powered chatbots and conversational AI, are reshaping the market landscape. Consumer preferences are shifting towards seamless omnichannel experiences and personalized interactions. Competitive dynamics are intense, with established players facing competition from agile startups and innovative technology providers. The market penetration of cloud-based solutions is increasing rapidly, driven by their scalability, cost-effectiveness, and flexibility.
Dominant Regions & Segments in Customer Engagement Solution Industry
The North American region currently dominates the Customer Engagement Solution market, driven by strong technological advancements, high adoption rates, and a well-established IT infrastructure. However, Asia-Pacific is projected to witness the fastest growth rate over the forecast period.
- By Component: The “Solution” segment holds the largest market share, driven by the increasing demand for comprehensive engagement platforms. The “Other Solutions” segment, including Robotic Process Optimization and Self-Service, is also experiencing significant growth, driven by automation needs.
- By Deployment Type: The Cloud segment is experiencing rapid growth, exceeding the On-premise segment, owing to its scalability and cost-effectiveness.
- By Organization Size: Large Enterprises constitute the larger market segment, driven by their higher budgets and complex needs. However, the SME segment is showing promising growth, driven by increasing digital adoption.
- By End-user Industry: The BFSI sector currently dominates due to the stringent regulatory requirements and the need for secure and efficient customer interactions. Telecom and IT sectors are also significant contributors.
Customer Engagement Solution Industry Product Innovations
Recent innovations include AI-powered chatbots, personalized recommendation engines, and advanced analytics dashboards that provide real-time customer insights. These solutions offer enhanced customer experiences, improved operational efficiency, and better data-driven decision-making. The market is witnessing a convergence of communication channels, leading to seamless omnichannel experiences.
Report Scope & Segmentation Analysis
This report segments the Customer Engagement Solution market by component (Solution, Other Solutions), deployment type (On-premise, Cloud), organization size (SMEs, Large Enterprises), and end-user industry (BFSI, Telecom & IT, Retail & Consumer Goods, Media & Entertainment, Other). Each segment's growth projections, market sizes, and competitive dynamics are analyzed in detail. The market size for each segment is predicted to reach xx Million by 2025, showcasing varying growth rates based on specific market drivers and challenges.
Key Drivers of Customer Engagement Solution Industry Growth
Growth is propelled by several factors: increasing digitalization across industries, the need for personalized customer experiences, advancements in AI and machine learning, growing adoption of cloud-based solutions, and government initiatives promoting digital transformation. Companies are increasingly investing in CRM systems and omnichannel strategies to improve customer engagement.
Challenges in the Customer Engagement Solution Industry Sector
Challenges include the high cost of implementation, concerns around data security and privacy, integration complexities with existing systems, and the need for skilled professionals to manage and maintain these solutions. Competitive pressures and rapid technological advancements also pose challenges for industry players. The market is estimated to face a revenue reduction of xx Million due to these challenges by 2033.
Emerging Opportunities in Customer Engagement Solution Industry
Significant opportunities exist in emerging markets, particularly in developing economies where digital penetration is increasing rapidly. The integration of emerging technologies like IoT and blockchain offers new avenues for growth. The demand for AI-driven personalization and proactive customer service solutions is expected to drive significant market expansion.
Leading Players in the Customer Engagement Solution Industry Market
- Nuance Communications Inc
- Alvaria Inc
- OpenText Corporation
- IBM Corporation
- Nice Systems Ltd
- SAP SE
- Salesforce.com Inc
- Avaya Inc
- Pegasystems Inc
- Verint Systems Inc
- Genesys
- Oracle Corporation
- Calabrio Inc
Key Developments in Customer Engagement Solution Industry
- February 2023: GoTo launched GoTo Customer Engagement, a multi-channel solution integrating communication tools and analytics. This launch is expected to increase market competition and drive innovation in the multi-channel communication space.
- May 2022: HCL Technologies launched X, a digital engagement platform focusing on enhancing customer loyalty and conversions. This contributes to the ongoing trend of companies adopting comprehensive digital engagement solutions.
Future Outlook for Customer Engagement Solution Industry Market
The Customer Engagement Solution market is poised for sustained growth, driven by ongoing technological advancements, increasing digital adoption across sectors, and the growing need for personalized and efficient customer experiences. Strategic partnerships, acquisitions, and investments in R&D will play a pivotal role in shaping the future landscape. The market is projected to reach xx Million by 2033, representing a significant expansion of market opportunities for existing and emerging players.
Customer Engagement Solution Industry Segmentation
-
1. Component
- 1.1. Omni Channel
- 1.2. Workforce Optimization
- 1.3. Other
-
2. Deployment Type
- 2.1. On-premise
- 2.2. Cloud
-
3. Organization Size
- 3.1. Small and Medium Enterprises
- 3.2. Large Enterprises
-
4. End-user Industry
- 4.1. BFSI
- 4.2. Telecom and IT
- 4.3. Retail and Consumer Goods
- 4.4. Media and Entertainment
- 4.5. Other End-user Industries
-
5. Services
- 5.1. Managed services
- 5.2. Professional services
Customer Engagement Solution Industry Segmentation By Geography
-
1. North America
- 1.1. United States
- 1.2. Canada
-
2. Europe
- 2.1. United Kingdom
- 2.2. Germany
- 2.3. France
-
3. Asia
- 3.1. China
- 3.2. India
- 3.3. Japan
-
4. Latin America
- 4.1. Brazil
- 4.2. Argentina
- 4.3. Rest of South America
-
5. Middle East and Africa
- 5.1. UAE
- 5.2. South Africa
- 5.3. Saudi Arabia
- 5.4. Rest Of MEA
Customer Engagement Solution Industry REPORT HIGHLIGHTS
| Aspects | Details |
|---|---|
| Study Period | 2019-2033 |
| Base Year | 2024 |
| Estimated Year | 2025 |
| Forecast Period | 2025-2033 |
| Historical Period | 2019-2024 |
| Growth Rate | CAGR of 10.97% from 2019-2033 |
| Segmentation |
|
Table of Contents
- 1. Introduction
- 1.1. Research Scope
- 1.2. Market Segmentation
- 1.3. Research Methodology
- 1.4. Definitions and Assumptions
- 2. Executive Summary
- 2.1. Introduction
- 3. Market Dynamics
- 3.1. Introduction
- 3.2. Market Drivers
- 3.2.1. Rapidly Increasing Cybersecurity Incidents and Regulations Requiring Their Reporting; Growing M2M/IoT Connections Demanding Strengthened Cybersecurity in Enterprises
- 3.3. Market Restrains
- 3.3.1. Lack of Cybersecurity Professionals; High Reliance on Traditional Authentication Methods and Low Preparedness
- 3.4. Market Trends
- 3.4.1. BFSI Industry Have the Significant Market Share
- 4. Market Factor Analysis
- 4.1. Porters Five Forces
- 4.2. Supply/Value Chain
- 4.3. PESTEL analysis
- 4.4. Market Entropy
- 4.5. Patent/Trademark Analysis
- 5. Global Customer Engagement Solution Industry Analysis, Insights and Forecast, 2019-2031
- 5.1. Market Analysis, Insights and Forecast - by Component
- 5.1.1. Omni Channel
- 5.1.2. Workforce Optimization
- 5.1.3. Other
- 5.2. Market Analysis, Insights and Forecast - by Deployment Type
- 5.2.1. On-premise
- 5.2.2. Cloud
- 5.3. Market Analysis, Insights and Forecast - by Organization Size
- 5.3.1. Small and Medium Enterprises
- 5.3.2. Large Enterprises
- 5.4. Market Analysis, Insights and Forecast - by End-user Industry
- 5.4.1. BFSI
- 5.4.2. Telecom and IT
- 5.4.3. Retail and Consumer Goods
- 5.4.4. Media and Entertainment
- 5.4.5. Other End-user Industries
- 5.5. Market Analysis, Insights and Forecast - by Services
- 5.5.1. Managed services
- 5.5.2. Professional services
- 5.6. Market Analysis, Insights and Forecast - by Region
- 5.6.1. North America
- 5.6.2. Europe
- 5.6.3. Asia
- 5.6.4. Latin America
- 5.6.5. Middle East and Africa
- 5.1. Market Analysis, Insights and Forecast - by Component
- 6. North America Customer Engagement Solution Industry Analysis, Insights and Forecast, 2019-2031
- 6.1. Market Analysis, Insights and Forecast - by Component
- 6.1.1. Omni Channel
- 6.1.2. Workforce Optimization
- 6.1.3. Other
- 6.2. Market Analysis, Insights and Forecast - by Deployment Type
- 6.2.1. On-premise
- 6.2.2. Cloud
- 6.3. Market Analysis, Insights and Forecast - by Organization Size
- 6.3.1. Small and Medium Enterprises
- 6.3.2. Large Enterprises
- 6.4. Market Analysis, Insights and Forecast - by End-user Industry
- 6.4.1. BFSI
- 6.4.2. Telecom and IT
- 6.4.3. Retail and Consumer Goods
- 6.4.4. Media and Entertainment
- 6.4.5. Other End-user Industries
- 6.5. Market Analysis, Insights and Forecast - by Services
- 6.5.1. Managed services
- 6.5.2. Professional services
- 6.1. Market Analysis, Insights and Forecast - by Component
- 7. Europe Customer Engagement Solution Industry Analysis, Insights and Forecast, 2019-2031
- 7.1. Market Analysis, Insights and Forecast - by Component
- 7.1.1. Omni Channel
- 7.1.2. Workforce Optimization
- 7.1.3. Other
- 7.2. Market Analysis, Insights and Forecast - by Deployment Type
- 7.2.1. On-premise
- 7.2.2. Cloud
- 7.3. Market Analysis, Insights and Forecast - by Organization Size
- 7.3.1. Small and Medium Enterprises
- 7.3.2. Large Enterprises
- 7.4. Market Analysis, Insights and Forecast - by End-user Industry
- 7.4.1. BFSI
- 7.4.2. Telecom and IT
- 7.4.3. Retail and Consumer Goods
- 7.4.4. Media and Entertainment
- 7.4.5. Other End-user Industries
- 7.5. Market Analysis, Insights and Forecast - by Services
- 7.5.1. Managed services
- 7.5.2. Professional services
- 7.1. Market Analysis, Insights and Forecast - by Component
- 8. Asia Customer Engagement Solution Industry Analysis, Insights and Forecast, 2019-2031
- 8.1. Market Analysis, Insights and Forecast - by Component
- 8.1.1. Omni Channel
- 8.1.2. Workforce Optimization
- 8.1.3. Other
- 8.2. Market Analysis, Insights and Forecast - by Deployment Type
- 8.2.1. On-premise
- 8.2.2. Cloud
- 8.3. Market Analysis, Insights and Forecast - by Organization Size
- 8.3.1. Small and Medium Enterprises
- 8.3.2. Large Enterprises
- 8.4. Market Analysis, Insights and Forecast - by End-user Industry
- 8.4.1. BFSI
- 8.4.2. Telecom and IT
- 8.4.3. Retail and Consumer Goods
- 8.4.4. Media and Entertainment
- 8.4.5. Other End-user Industries
- 8.5. Market Analysis, Insights and Forecast - by Services
- 8.5.1. Managed services
- 8.5.2. Professional services
- 8.1. Market Analysis, Insights and Forecast - by Component
- 9. Latin America Customer Engagement Solution Industry Analysis, Insights and Forecast, 2019-2031
- 9.1. Market Analysis, Insights and Forecast - by Component
- 9.1.1. Omni Channel
- 9.1.2. Workforce Optimization
- 9.1.3. Other
- 9.2. Market Analysis, Insights and Forecast - by Deployment Type
- 9.2.1. On-premise
- 9.2.2. Cloud
- 9.3. Market Analysis, Insights and Forecast - by Organization Size
- 9.3.1. Small and Medium Enterprises
- 9.3.2. Large Enterprises
- 9.4. Market Analysis, Insights and Forecast - by End-user Industry
- 9.4.1. BFSI
- 9.4.2. Telecom and IT
- 9.4.3. Retail and Consumer Goods
- 9.4.4. Media and Entertainment
- 9.4.5. Other End-user Industries
- 9.5. Market Analysis, Insights and Forecast - by Services
- 9.5.1. Managed services
- 9.5.2. Professional services
- 9.1. Market Analysis, Insights and Forecast - by Component
- 10. Middle East and Africa Customer Engagement Solution Industry Analysis, Insights and Forecast, 2019-2031
- 10.1. Market Analysis, Insights and Forecast - by Component
- 10.1.1. Omni Channel
- 10.1.2. Workforce Optimization
- 10.1.3. Other
- 10.2. Market Analysis, Insights and Forecast - by Deployment Type
- 10.2.1. On-premise
- 10.2.2. Cloud
- 10.3. Market Analysis, Insights and Forecast - by Organization Size
- 10.3.1. Small and Medium Enterprises
- 10.3.2. Large Enterprises
- 10.4. Market Analysis, Insights and Forecast - by End-user Industry
- 10.4.1. BFSI
- 10.4.2. Telecom and IT
- 10.4.3. Retail and Consumer Goods
- 10.4.4. Media and Entertainment
- 10.4.5. Other End-user Industries
- 10.5. Market Analysis, Insights and Forecast - by Services
- 10.5.1. Managed services
- 10.5.2. Professional services
- 10.1. Market Analysis, Insights and Forecast - by Component
- 11. North America Customer Engagement Solution Industry Analysis, Insights and Forecast, 2019-2031
- 11.1. Market Analysis, Insights and Forecast - By Country/Sub-region
- 11.1.1 United States
- 11.1.2 Canada
- 11.1.3 Mexico
- 12. Europe Customer Engagement Solution Industry Analysis, Insights and Forecast, 2019-2031
- 12.1. Market Analysis, Insights and Forecast - By Country/Sub-region
- 12.1.1 Germany
- 12.1.2 United Kingdom
- 12.1.3 France
- 12.1.4 Spain
- 12.1.5 Italy
- 12.1.6 Spain
- 12.1.7 Belgium
- 12.1.8 Netherland
- 12.1.9 Nordics
- 12.1.10 Rest of Europe
- 13. Asia Pacific Customer Engagement Solution Industry Analysis, Insights and Forecast, 2019-2031
- 13.1. Market Analysis, Insights and Forecast - By Country/Sub-region
- 13.1.1 China
- 13.1.2 Japan
- 13.1.3 India
- 13.1.4 South Korea
- 13.1.5 Southeast Asia
- 13.1.6 Australia
- 13.1.7 Indonesia
- 13.1.8 Phillipes
- 13.1.9 Singapore
- 13.1.10 Thailandc
- 13.1.11 Rest of Asia Pacific
- 14. South America Customer Engagement Solution Industry Analysis, Insights and Forecast, 2019-2031
- 14.1. Market Analysis, Insights and Forecast - By Country/Sub-region
- 14.1.1 Brazil
- 14.1.2 Argentina
- 14.1.3 Peru
- 14.1.4 Chile
- 14.1.5 Colombia
- 14.1.6 Ecuador
- 14.1.7 Venezuela
- 14.1.8 Rest of South America
- 15. North America Customer Engagement Solution Industry Analysis, Insights and Forecast, 2019-2031
- 15.1. Market Analysis, Insights and Forecast - By Country/Sub-region
- 15.1.1 United States
- 15.1.2 Canada
- 15.1.3 Mexico
- 16. MEA Customer Engagement Solution Industry Analysis, Insights and Forecast, 2019-2031
- 16.1. Market Analysis, Insights and Forecast - By Country/Sub-region
- 16.1.1 United Arab Emirates
- 16.1.2 Saudi Arabia
- 16.1.3 South Africa
- 16.1.4 Rest of Middle East and Africa
- 17. Competitive Analysis
- 17.1. Global Market Share Analysis 2024
- 17.2. Company Profiles
- 17.2.1 Nuance Communications Inc
- 17.2.1.1. Overview
- 17.2.1.2. Products
- 17.2.1.3. SWOT Analysis
- 17.2.1.4. Recent Developments
- 17.2.1.5. Financials (Based on Availability)
- 17.2.2 Alvaria Inc
- 17.2.2.1. Overview
- 17.2.2.2. Products
- 17.2.2.3. SWOT Analysis
- 17.2.2.4. Recent Developments
- 17.2.2.5. Financials (Based on Availability)
- 17.2.3 OpenText Corporation
- 17.2.3.1. Overview
- 17.2.3.2. Products
- 17.2.3.3. SWOT Analysis
- 17.2.3.4. Recent Developments
- 17.2.3.5. Financials (Based on Availability)
- 17.2.4 IBM Corporation
- 17.2.4.1. Overview
- 17.2.4.2. Products
- 17.2.4.3. SWOT Analysis
- 17.2.4.4. Recent Developments
- 17.2.4.5. Financials (Based on Availability)
- 17.2.5 Nice Systems Ltd
- 17.2.5.1. Overview
- 17.2.5.2. Products
- 17.2.5.3. SWOT Analysis
- 17.2.5.4. Recent Developments
- 17.2.5.5. Financials (Based on Availability)
- 17.2.6 SAP SE
- 17.2.6.1. Overview
- 17.2.6.2. Products
- 17.2.6.3. SWOT Analysis
- 17.2.6.4. Recent Developments
- 17.2.6.5. Financials (Based on Availability)
- 17.2.7 Salesforce com Inc
- 17.2.7.1. Overview
- 17.2.7.2. Products
- 17.2.7.3. SWOT Analysis
- 17.2.7.4. Recent Developments
- 17.2.7.5. Financials (Based on Availability)
- 17.2.8 Avaya Inc
- 17.2.8.1. Overview
- 17.2.8.2. Products
- 17.2.8.3. SWOT Analysis
- 17.2.8.4. Recent Developments
- 17.2.8.5. Financials (Based on Availability)
- 17.2.9 Pegasystems Inc
- 17.2.9.1. Overview
- 17.2.9.2. Products
- 17.2.9.3. SWOT Analysis
- 17.2.9.4. Recent Developments
- 17.2.9.5. Financials (Based on Availability)
- 17.2.10 Verint Systems Inc
- 17.2.10.1. Overview
- 17.2.10.2. Products
- 17.2.10.3. SWOT Analysis
- 17.2.10.4. Recent Developments
- 17.2.10.5. Financials (Based on Availability)
- 17.2.11 Genesys
- 17.2.11.1. Overview
- 17.2.11.2. Products
- 17.2.11.3. SWOT Analysis
- 17.2.11.4. Recent Developments
- 17.2.11.5. Financials (Based on Availability)
- 17.2.12 Oracle Corporation
- 17.2.12.1. Overview
- 17.2.12.2. Products
- 17.2.12.3. SWOT Analysis
- 17.2.12.4. Recent Developments
- 17.2.12.5. Financials (Based on Availability)
- 17.2.13 Calabrio Inc
- 17.2.13.1. Overview
- 17.2.13.2. Products
- 17.2.13.3. SWOT Analysis
- 17.2.13.4. Recent Developments
- 17.2.13.5. Financials (Based on Availability)
- 17.2.1 Nuance Communications Inc
List of Figures
- Figure 1: Global Customer Engagement Solution Industry Revenue Breakdown (Million, %) by Region 2024 & 2032
- Figure 2: Global Customer Engagement Solution Industry Volume Breakdown (K Unit, %) by Region 2024 & 2032
- Figure 3: North America Customer Engagement Solution Industry Revenue (Million), by Country 2024 & 2032
- Figure 4: North America Customer Engagement Solution Industry Volume (K Unit), by Country 2024 & 2032
- Figure 5: North America Customer Engagement Solution Industry Revenue Share (%), by Country 2024 & 2032
- Figure 6: North America Customer Engagement Solution Industry Volume Share (%), by Country 2024 & 2032
- Figure 7: Europe Customer Engagement Solution Industry Revenue (Million), by Country 2024 & 2032
- Figure 8: Europe Customer Engagement Solution Industry Volume (K Unit), by Country 2024 & 2032
- Figure 9: Europe Customer Engagement Solution Industry Revenue Share (%), by Country 2024 & 2032
- Figure 10: Europe Customer Engagement Solution Industry Volume Share (%), by Country 2024 & 2032
- Figure 11: Asia Pacific Customer Engagement Solution Industry Revenue (Million), by Country 2024 & 2032
- Figure 12: Asia Pacific Customer Engagement Solution Industry Volume (K Unit), by Country 2024 & 2032
- Figure 13: Asia Pacific Customer Engagement Solution Industry Revenue Share (%), by Country 2024 & 2032
- Figure 14: Asia Pacific Customer Engagement Solution Industry Volume Share (%), by Country 2024 & 2032
- Figure 15: South America Customer Engagement Solution Industry Revenue (Million), by Country 2024 & 2032
- Figure 16: South America Customer Engagement Solution Industry Volume (K Unit), by Country 2024 & 2032
- Figure 17: South America Customer Engagement Solution Industry Revenue Share (%), by Country 2024 & 2032
- Figure 18: South America Customer Engagement Solution Industry Volume Share (%), by Country 2024 & 2032
- Figure 19: North America Customer Engagement Solution Industry Revenue (Million), by Country 2024 & 2032
- Figure 20: North America Customer Engagement Solution Industry Volume (K Unit), by Country 2024 & 2032
- Figure 21: North America Customer Engagement Solution Industry Revenue Share (%), by Country 2024 & 2032
- Figure 22: North America Customer Engagement Solution Industry Volume Share (%), by Country 2024 & 2032
- Figure 23: MEA Customer Engagement Solution Industry Revenue (Million), by Country 2024 & 2032
- Figure 24: MEA Customer Engagement Solution Industry Volume (K Unit), by Country 2024 & 2032
- Figure 25: MEA Customer Engagement Solution Industry Revenue Share (%), by Country 2024 & 2032
- Figure 26: MEA Customer Engagement Solution Industry Volume Share (%), by Country 2024 & 2032
- Figure 27: North America Customer Engagement Solution Industry Revenue (Million), by Component 2024 & 2032
- Figure 28: North America Customer Engagement Solution Industry Volume (K Unit), by Component 2024 & 2032
- Figure 29: North America Customer Engagement Solution Industry Revenue Share (%), by Component 2024 & 2032
- Figure 30: North America Customer Engagement Solution Industry Volume Share (%), by Component 2024 & 2032
- Figure 31: North America Customer Engagement Solution Industry Revenue (Million), by Deployment Type 2024 & 2032
- Figure 32: North America Customer Engagement Solution Industry Volume (K Unit), by Deployment Type 2024 & 2032
- Figure 33: North America Customer Engagement Solution Industry Revenue Share (%), by Deployment Type 2024 & 2032
- Figure 34: North America Customer Engagement Solution Industry Volume Share (%), by Deployment Type 2024 & 2032
- Figure 35: North America Customer Engagement Solution Industry Revenue (Million), by Organization Size 2024 & 2032
- Figure 36: North America Customer Engagement Solution Industry Volume (K Unit), by Organization Size 2024 & 2032
- Figure 37: North America Customer Engagement Solution Industry Revenue Share (%), by Organization Size 2024 & 2032
- Figure 38: North America Customer Engagement Solution Industry Volume Share (%), by Organization Size 2024 & 2032
- Figure 39: North America Customer Engagement Solution Industry Revenue (Million), by End-user Industry 2024 & 2032
- Figure 40: North America Customer Engagement Solution Industry Volume (K Unit), by End-user Industry 2024 & 2032
- Figure 41: North America Customer Engagement Solution Industry Revenue Share (%), by End-user Industry 2024 & 2032
- Figure 42: North America Customer Engagement Solution Industry Volume Share (%), by End-user Industry 2024 & 2032
- Figure 43: North America Customer Engagement Solution Industry Revenue (Million), by Services 2024 & 2032
- Figure 44: North America Customer Engagement Solution Industry Volume (K Unit), by Services 2024 & 2032
- Figure 45: North America Customer Engagement Solution Industry Revenue Share (%), by Services 2024 & 2032
- Figure 46: North America Customer Engagement Solution Industry Volume Share (%), by Services 2024 & 2032
- Figure 47: North America Customer Engagement Solution Industry Revenue (Million), by Country 2024 & 2032
- Figure 48: North America Customer Engagement Solution Industry Volume (K Unit), by Country 2024 & 2032
- Figure 49: North America Customer Engagement Solution Industry Revenue Share (%), by Country 2024 & 2032
- Figure 50: North America Customer Engagement Solution Industry Volume Share (%), by Country 2024 & 2032
- Figure 51: Europe Customer Engagement Solution Industry Revenue (Million), by Component 2024 & 2032
- Figure 52: Europe Customer Engagement Solution Industry Volume (K Unit), by Component 2024 & 2032
- Figure 53: Europe Customer Engagement Solution Industry Revenue Share (%), by Component 2024 & 2032
- Figure 54: Europe Customer Engagement Solution Industry Volume Share (%), by Component 2024 & 2032
- Figure 55: Europe Customer Engagement Solution Industry Revenue (Million), by Deployment Type 2024 & 2032
- Figure 56: Europe Customer Engagement Solution Industry Volume (K Unit), by Deployment Type 2024 & 2032
- Figure 57: Europe Customer Engagement Solution Industry Revenue Share (%), by Deployment Type 2024 & 2032
- Figure 58: Europe Customer Engagement Solution Industry Volume Share (%), by Deployment Type 2024 & 2032
- Figure 59: Europe Customer Engagement Solution Industry Revenue (Million), by Organization Size 2024 & 2032
- Figure 60: Europe Customer Engagement Solution Industry Volume (K Unit), by Organization Size 2024 & 2032
- Figure 61: Europe Customer Engagement Solution Industry Revenue Share (%), by Organization Size 2024 & 2032
- Figure 62: Europe Customer Engagement Solution Industry Volume Share (%), by Organization Size 2024 & 2032
- Figure 63: Europe Customer Engagement Solution Industry Revenue (Million), by End-user Industry 2024 & 2032
- Figure 64: Europe Customer Engagement Solution Industry Volume (K Unit), by End-user Industry 2024 & 2032
- Figure 65: Europe Customer Engagement Solution Industry Revenue Share (%), by End-user Industry 2024 & 2032
- Figure 66: Europe Customer Engagement Solution Industry Volume Share (%), by End-user Industry 2024 & 2032
- Figure 67: Europe Customer Engagement Solution Industry Revenue (Million), by Services 2024 & 2032
- Figure 68: Europe Customer Engagement Solution Industry Volume (K Unit), by Services 2024 & 2032
- Figure 69: Europe Customer Engagement Solution Industry Revenue Share (%), by Services 2024 & 2032
- Figure 70: Europe Customer Engagement Solution Industry Volume Share (%), by Services 2024 & 2032
- Figure 71: Europe Customer Engagement Solution Industry Revenue (Million), by Country 2024 & 2032
- Figure 72: Europe Customer Engagement Solution Industry Volume (K Unit), by Country 2024 & 2032
- Figure 73: Europe Customer Engagement Solution Industry Revenue Share (%), by Country 2024 & 2032
- Figure 74: Europe Customer Engagement Solution Industry Volume Share (%), by Country 2024 & 2032
- Figure 75: Asia Customer Engagement Solution Industry Revenue (Million), by Component 2024 & 2032
- Figure 76: Asia Customer Engagement Solution Industry Volume (K Unit), by Component 2024 & 2032
- Figure 77: Asia Customer Engagement Solution Industry Revenue Share (%), by Component 2024 & 2032
- Figure 78: Asia Customer Engagement Solution Industry Volume Share (%), by Component 2024 & 2032
- Figure 79: Asia Customer Engagement Solution Industry Revenue (Million), by Deployment Type 2024 & 2032
- Figure 80: Asia Customer Engagement Solution Industry Volume (K Unit), by Deployment Type 2024 & 2032
- Figure 81: Asia Customer Engagement Solution Industry Revenue Share (%), by Deployment Type 2024 & 2032
- Figure 82: Asia Customer Engagement Solution Industry Volume Share (%), by Deployment Type 2024 & 2032
- Figure 83: Asia Customer Engagement Solution Industry Revenue (Million), by Organization Size 2024 & 2032
- Figure 84: Asia Customer Engagement Solution Industry Volume (K Unit), by Organization Size 2024 & 2032
- Figure 85: Asia Customer Engagement Solution Industry Revenue Share (%), by Organization Size 2024 & 2032
- Figure 86: Asia Customer Engagement Solution Industry Volume Share (%), by Organization Size 2024 & 2032
- Figure 87: Asia Customer Engagement Solution Industry Revenue (Million), by End-user Industry 2024 & 2032
- Figure 88: Asia Customer Engagement Solution Industry Volume (K Unit), by End-user Industry 2024 & 2032
- Figure 89: Asia Customer Engagement Solution Industry Revenue Share (%), by End-user Industry 2024 & 2032
- Figure 90: Asia Customer Engagement Solution Industry Volume Share (%), by End-user Industry 2024 & 2032
- Figure 91: Asia Customer Engagement Solution Industry Revenue (Million), by Services 2024 & 2032
- Figure 92: Asia Customer Engagement Solution Industry Volume (K Unit), by Services 2024 & 2032
- Figure 93: Asia Customer Engagement Solution Industry Revenue Share (%), by Services 2024 & 2032
- Figure 94: Asia Customer Engagement Solution Industry Volume Share (%), by Services 2024 & 2032
- Figure 95: Asia Customer Engagement Solution Industry Revenue (Million), by Country 2024 & 2032
- Figure 96: Asia Customer Engagement Solution Industry Volume (K Unit), by Country 2024 & 2032
- Figure 97: Asia Customer Engagement Solution Industry Revenue Share (%), by Country 2024 & 2032
- Figure 98: Asia Customer Engagement Solution Industry Volume Share (%), by Country 2024 & 2032
- Figure 99: Latin America Customer Engagement Solution Industry Revenue (Million), by Component 2024 & 2032
- Figure 100: Latin America Customer Engagement Solution Industry Volume (K Unit), by Component 2024 & 2032
- Figure 101: Latin America Customer Engagement Solution Industry Revenue Share (%), by Component 2024 & 2032
- Figure 102: Latin America Customer Engagement Solution Industry Volume Share (%), by Component 2024 & 2032
- Figure 103: Latin America Customer Engagement Solution Industry Revenue (Million), by Deployment Type 2024 & 2032
- Figure 104: Latin America Customer Engagement Solution Industry Volume (K Unit), by Deployment Type 2024 & 2032
- Figure 105: Latin America Customer Engagement Solution Industry Revenue Share (%), by Deployment Type 2024 & 2032
- Figure 106: Latin America Customer Engagement Solution Industry Volume Share (%), by Deployment Type 2024 & 2032
- Figure 107: Latin America Customer Engagement Solution Industry Revenue (Million), by Organization Size 2024 & 2032
- Figure 108: Latin America Customer Engagement Solution Industry Volume (K Unit), by Organization Size 2024 & 2032
- Figure 109: Latin America Customer Engagement Solution Industry Revenue Share (%), by Organization Size 2024 & 2032
- Figure 110: Latin America Customer Engagement Solution Industry Volume Share (%), by Organization Size 2024 & 2032
- Figure 111: Latin America Customer Engagement Solution Industry Revenue (Million), by End-user Industry 2024 & 2032
- Figure 112: Latin America Customer Engagement Solution Industry Volume (K Unit), by End-user Industry 2024 & 2032
- Figure 113: Latin America Customer Engagement Solution Industry Revenue Share (%), by End-user Industry 2024 & 2032
- Figure 114: Latin America Customer Engagement Solution Industry Volume Share (%), by End-user Industry 2024 & 2032
- Figure 115: Latin America Customer Engagement Solution Industry Revenue (Million), by Services 2024 & 2032
- Figure 116: Latin America Customer Engagement Solution Industry Volume (K Unit), by Services 2024 & 2032
- Figure 117: Latin America Customer Engagement Solution Industry Revenue Share (%), by Services 2024 & 2032
- Figure 118: Latin America Customer Engagement Solution Industry Volume Share (%), by Services 2024 & 2032
- Figure 119: Latin America Customer Engagement Solution Industry Revenue (Million), by Country 2024 & 2032
- Figure 120: Latin America Customer Engagement Solution Industry Volume (K Unit), by Country 2024 & 2032
- Figure 121: Latin America Customer Engagement Solution Industry Revenue Share (%), by Country 2024 & 2032
- Figure 122: Latin America Customer Engagement Solution Industry Volume Share (%), by Country 2024 & 2032
- Figure 123: Middle East and Africa Customer Engagement Solution Industry Revenue (Million), by Component 2024 & 2032
- Figure 124: Middle East and Africa Customer Engagement Solution Industry Volume (K Unit), by Component 2024 & 2032
- Figure 125: Middle East and Africa Customer Engagement Solution Industry Revenue Share (%), by Component 2024 & 2032
- Figure 126: Middle East and Africa Customer Engagement Solution Industry Volume Share (%), by Component 2024 & 2032
- Figure 127: Middle East and Africa Customer Engagement Solution Industry Revenue (Million), by Deployment Type 2024 & 2032
- Figure 128: Middle East and Africa Customer Engagement Solution Industry Volume (K Unit), by Deployment Type 2024 & 2032
- Figure 129: Middle East and Africa Customer Engagement Solution Industry Revenue Share (%), by Deployment Type 2024 & 2032
- Figure 130: Middle East and Africa Customer Engagement Solution Industry Volume Share (%), by Deployment Type 2024 & 2032
- Figure 131: Middle East and Africa Customer Engagement Solution Industry Revenue (Million), by Organization Size 2024 & 2032
- Figure 132: Middle East and Africa Customer Engagement Solution Industry Volume (K Unit), by Organization Size 2024 & 2032
- Figure 133: Middle East and Africa Customer Engagement Solution Industry Revenue Share (%), by Organization Size 2024 & 2032
- Figure 134: Middle East and Africa Customer Engagement Solution Industry Volume Share (%), by Organization Size 2024 & 2032
- Figure 135: Middle East and Africa Customer Engagement Solution Industry Revenue (Million), by End-user Industry 2024 & 2032
- Figure 136: Middle East and Africa Customer Engagement Solution Industry Volume (K Unit), by End-user Industry 2024 & 2032
- Figure 137: Middle East and Africa Customer Engagement Solution Industry Revenue Share (%), by End-user Industry 2024 & 2032
- Figure 138: Middle East and Africa Customer Engagement Solution Industry Volume Share (%), by End-user Industry 2024 & 2032
- Figure 139: Middle East and Africa Customer Engagement Solution Industry Revenue (Million), by Services 2024 & 2032
- Figure 140: Middle East and Africa Customer Engagement Solution Industry Volume (K Unit), by Services 2024 & 2032
- Figure 141: Middle East and Africa Customer Engagement Solution Industry Revenue Share (%), by Services 2024 & 2032
- Figure 142: Middle East and Africa Customer Engagement Solution Industry Volume Share (%), by Services 2024 & 2032
- Figure 143: Middle East and Africa Customer Engagement Solution Industry Revenue (Million), by Country 2024 & 2032
- Figure 144: Middle East and Africa Customer Engagement Solution Industry Volume (K Unit), by Country 2024 & 2032
- Figure 145: Middle East and Africa Customer Engagement Solution Industry Revenue Share (%), by Country 2024 & 2032
- Figure 146: Middle East and Africa Customer Engagement Solution Industry Volume Share (%), by Country 2024 & 2032
List of Tables
- Table 1: Global Customer Engagement Solution Industry Revenue Million Forecast, by Region 2019 & 2032
- Table 2: Global Customer Engagement Solution Industry Volume K Unit Forecast, by Region 2019 & 2032
- Table 3: Global Customer Engagement Solution Industry Revenue Million Forecast, by Component 2019 & 2032
- Table 4: Global Customer Engagement Solution Industry Volume K Unit Forecast, by Component 2019 & 2032
- Table 5: Global Customer Engagement Solution Industry Revenue Million Forecast, by Deployment Type 2019 & 2032
- Table 6: Global Customer Engagement Solution Industry Volume K Unit Forecast, by Deployment Type 2019 & 2032
- Table 7: Global Customer Engagement Solution Industry Revenue Million Forecast, by Organization Size 2019 & 2032
- Table 8: Global Customer Engagement Solution Industry Volume K Unit Forecast, by Organization Size 2019 & 2032
- Table 9: Global Customer Engagement Solution Industry Revenue Million Forecast, by End-user Industry 2019 & 2032
- Table 10: Global Customer Engagement Solution Industry Volume K Unit Forecast, by End-user Industry 2019 & 2032
- Table 11: Global Customer Engagement Solution Industry Revenue Million Forecast, by Services 2019 & 2032
- Table 12: Global Customer Engagement Solution Industry Volume K Unit Forecast, by Services 2019 & 2032
- Table 13: Global Customer Engagement Solution Industry Revenue Million Forecast, by Region 2019 & 2032
- Table 14: Global Customer Engagement Solution Industry Volume K Unit Forecast, by Region 2019 & 2032
- Table 15: Global Customer Engagement Solution Industry Revenue Million Forecast, by Country 2019 & 2032
- Table 16: Global Customer Engagement Solution Industry Volume K Unit Forecast, by Country 2019 & 2032
- Table 17: United States Customer Engagement Solution Industry Revenue (Million) Forecast, by Application 2019 & 2032
- Table 18: United States Customer Engagement Solution Industry Volume (K Unit) Forecast, by Application 2019 & 2032
- Table 19: Canada Customer Engagement Solution Industry Revenue (Million) Forecast, by Application 2019 & 2032
- Table 20: Canada Customer Engagement Solution Industry Volume (K Unit) Forecast, by Application 2019 & 2032
- Table 21: Mexico Customer Engagement Solution Industry Revenue (Million) Forecast, by Application 2019 & 2032
- Table 22: Mexico Customer Engagement Solution Industry Volume (K Unit) Forecast, by Application 2019 & 2032
- Table 23: Global Customer Engagement Solution Industry Revenue Million Forecast, by Country 2019 & 2032
- Table 24: Global Customer Engagement Solution Industry Volume K Unit Forecast, by Country 2019 & 2032
- Table 25: Germany Customer Engagement Solution Industry Revenue (Million) Forecast, by Application 2019 & 2032
- Table 26: Germany Customer Engagement Solution Industry Volume (K Unit) Forecast, by Application 2019 & 2032
- Table 27: United Kingdom Customer Engagement Solution Industry Revenue (Million) Forecast, by Application 2019 & 2032
- Table 28: United Kingdom Customer Engagement Solution Industry Volume (K Unit) Forecast, by Application 2019 & 2032
- Table 29: France Customer Engagement Solution Industry Revenue (Million) Forecast, by Application 2019 & 2032
- Table 30: France Customer Engagement Solution Industry Volume (K Unit) Forecast, by Application 2019 & 2032
- Table 31: Spain Customer Engagement Solution Industry Revenue (Million) Forecast, by Application 2019 & 2032
- Table 32: Spain Customer Engagement Solution Industry Volume (K Unit) Forecast, by Application 2019 & 2032
- Table 33: Italy Customer Engagement Solution Industry Revenue (Million) Forecast, by Application 2019 & 2032
- Table 34: Italy Customer Engagement Solution Industry Volume (K Unit) Forecast, by Application 2019 & 2032
- Table 35: Spain Customer Engagement Solution Industry Revenue (Million) Forecast, by Application 2019 & 2032
- Table 36: Spain Customer Engagement Solution Industry Volume (K Unit) Forecast, by Application 2019 & 2032
- Table 37: Belgium Customer Engagement Solution Industry Revenue (Million) Forecast, by Application 2019 & 2032
- Table 38: Belgium Customer Engagement Solution Industry Volume (K Unit) Forecast, by Application 2019 & 2032
- Table 39: Netherland Customer Engagement Solution Industry Revenue (Million) Forecast, by Application 2019 & 2032
- Table 40: Netherland Customer Engagement Solution Industry Volume (K Unit) Forecast, by Application 2019 & 2032
- Table 41: Nordics Customer Engagement Solution Industry Revenue (Million) Forecast, by Application 2019 & 2032
- Table 42: Nordics Customer Engagement Solution Industry Volume (K Unit) Forecast, by Application 2019 & 2032
- Table 43: Rest of Europe Customer Engagement Solution Industry Revenue (Million) Forecast, by Application 2019 & 2032
- Table 44: Rest of Europe Customer Engagement Solution Industry Volume (K Unit) Forecast, by Application 2019 & 2032
- Table 45: Global Customer Engagement Solution Industry Revenue Million Forecast, by Country 2019 & 2032
- Table 46: Global Customer Engagement Solution Industry Volume K Unit Forecast, by Country 2019 & 2032
- Table 47: China Customer Engagement Solution Industry Revenue (Million) Forecast, by Application 2019 & 2032
- Table 48: China Customer Engagement Solution Industry Volume (K Unit) Forecast, by Application 2019 & 2032
- Table 49: Japan Customer Engagement Solution Industry Revenue (Million) Forecast, by Application 2019 & 2032
- Table 50: Japan Customer Engagement Solution Industry Volume (K Unit) Forecast, by Application 2019 & 2032
- Table 51: India Customer Engagement Solution Industry Revenue (Million) Forecast, by Application 2019 & 2032
- Table 52: India Customer Engagement Solution Industry Volume (K Unit) Forecast, by Application 2019 & 2032
- Table 53: South Korea Customer Engagement Solution Industry Revenue (Million) Forecast, by Application 2019 & 2032
- Table 54: South Korea Customer Engagement Solution Industry Volume (K Unit) Forecast, by Application 2019 & 2032
- Table 55: Southeast Asia Customer Engagement Solution Industry Revenue (Million) Forecast, by Application 2019 & 2032
- Table 56: Southeast Asia Customer Engagement Solution Industry Volume (K Unit) Forecast, by Application 2019 & 2032
- Table 57: Australia Customer Engagement Solution Industry Revenue (Million) Forecast, by Application 2019 & 2032
- Table 58: Australia Customer Engagement Solution Industry Volume (K Unit) Forecast, by Application 2019 & 2032
- Table 59: Indonesia Customer Engagement Solution Industry Revenue (Million) Forecast, by Application 2019 & 2032
- Table 60: Indonesia Customer Engagement Solution Industry Volume (K Unit) Forecast, by Application 2019 & 2032
- Table 61: Phillipes Customer Engagement Solution Industry Revenue (Million) Forecast, by Application 2019 & 2032
- Table 62: Phillipes Customer Engagement Solution Industry Volume (K Unit) Forecast, by Application 2019 & 2032
- Table 63: Singapore Customer Engagement Solution Industry Revenue (Million) Forecast, by Application 2019 & 2032
- Table 64: Singapore Customer Engagement Solution Industry Volume (K Unit) Forecast, by Application 2019 & 2032
- Table 65: Thailandc Customer Engagement Solution Industry Revenue (Million) Forecast, by Application 2019 & 2032
- Table 66: Thailandc Customer Engagement Solution Industry Volume (K Unit) Forecast, by Application 2019 & 2032
- Table 67: Rest of Asia Pacific Customer Engagement Solution Industry Revenue (Million) Forecast, by Application 2019 & 2032
- Table 68: Rest of Asia Pacific Customer Engagement Solution Industry Volume (K Unit) Forecast, by Application 2019 & 2032
- Table 69: Global Customer Engagement Solution Industry Revenue Million Forecast, by Country 2019 & 2032
- Table 70: Global Customer Engagement Solution Industry Volume K Unit Forecast, by Country 2019 & 2032
- Table 71: Brazil Customer Engagement Solution Industry Revenue (Million) Forecast, by Application 2019 & 2032
- Table 72: Brazil Customer Engagement Solution Industry Volume (K Unit) Forecast, by Application 2019 & 2032
- Table 73: Argentina Customer Engagement Solution Industry Revenue (Million) Forecast, by Application 2019 & 2032
- Table 74: Argentina Customer Engagement Solution Industry Volume (K Unit) Forecast, by Application 2019 & 2032
- Table 75: Peru Customer Engagement Solution Industry Revenue (Million) Forecast, by Application 2019 & 2032
- Table 76: Peru Customer Engagement Solution Industry Volume (K Unit) Forecast, by Application 2019 & 2032
- Table 77: Chile Customer Engagement Solution Industry Revenue (Million) Forecast, by Application 2019 & 2032
- Table 78: Chile Customer Engagement Solution Industry Volume (K Unit) Forecast, by Application 2019 & 2032
- Table 79: Colombia Customer Engagement Solution Industry Revenue (Million) Forecast, by Application 2019 & 2032
- Table 80: Colombia Customer Engagement Solution Industry Volume (K Unit) Forecast, by Application 2019 & 2032
- Table 81: Ecuador Customer Engagement Solution Industry Revenue (Million) Forecast, by Application 2019 & 2032
- Table 82: Ecuador Customer Engagement Solution Industry Volume (K Unit) Forecast, by Application 2019 & 2032
- Table 83: Venezuela Customer Engagement Solution Industry Revenue (Million) Forecast, by Application 2019 & 2032
- Table 84: Venezuela Customer Engagement Solution Industry Volume (K Unit) Forecast, by Application 2019 & 2032
- Table 85: Rest of South America Customer Engagement Solution Industry Revenue (Million) Forecast, by Application 2019 & 2032
- Table 86: Rest of South America Customer Engagement Solution Industry Volume (K Unit) Forecast, by Application 2019 & 2032
- Table 87: Global Customer Engagement Solution Industry Revenue Million Forecast, by Country 2019 & 2032
- Table 88: Global Customer Engagement Solution Industry Volume K Unit Forecast, by Country 2019 & 2032
- Table 89: United States Customer Engagement Solution Industry Revenue (Million) Forecast, by Application 2019 & 2032
- Table 90: United States Customer Engagement Solution Industry Volume (K Unit) Forecast, by Application 2019 & 2032
- Table 91: Canada Customer Engagement Solution Industry Revenue (Million) Forecast, by Application 2019 & 2032
- Table 92: Canada Customer Engagement Solution Industry Volume (K Unit) Forecast, by Application 2019 & 2032
- Table 93: Mexico Customer Engagement Solution Industry Revenue (Million) Forecast, by Application 2019 & 2032
- Table 94: Mexico Customer Engagement Solution Industry Volume (K Unit) Forecast, by Application 2019 & 2032
- Table 95: Global Customer Engagement Solution Industry Revenue Million Forecast, by Country 2019 & 2032
- Table 96: Global Customer Engagement Solution Industry Volume K Unit Forecast, by Country 2019 & 2032
- Table 97: United Arab Emirates Customer Engagement Solution Industry Revenue (Million) Forecast, by Application 2019 & 2032
- Table 98: United Arab Emirates Customer Engagement Solution Industry Volume (K Unit) Forecast, by Application 2019 & 2032
- Table 99: Saudi Arabia Customer Engagement Solution Industry Revenue (Million) Forecast, by Application 2019 & 2032
- Table 100: Saudi Arabia Customer Engagement Solution Industry Volume (K Unit) Forecast, by Application 2019 & 2032
- Table 101: South Africa Customer Engagement Solution Industry Revenue (Million) Forecast, by Application 2019 & 2032
- Table 102: South Africa Customer Engagement Solution Industry Volume (K Unit) Forecast, by Application 2019 & 2032
- Table 103: Rest of Middle East and Africa Customer Engagement Solution Industry Revenue (Million) Forecast, by Application 2019 & 2032
- Table 104: Rest of Middle East and Africa Customer Engagement Solution Industry Volume (K Unit) Forecast, by Application 2019 & 2032
- Table 105: Global Customer Engagement Solution Industry Revenue Million Forecast, by Component 2019 & 2032
- Table 106: Global Customer Engagement Solution Industry Volume K Unit Forecast, by Component 2019 & 2032
- Table 107: Global Customer Engagement Solution Industry Revenue Million Forecast, by Deployment Type 2019 & 2032
- Table 108: Global Customer Engagement Solution Industry Volume K Unit Forecast, by Deployment Type 2019 & 2032
- Table 109: Global Customer Engagement Solution Industry Revenue Million Forecast, by Organization Size 2019 & 2032
- Table 110: Global Customer Engagement Solution Industry Volume K Unit Forecast, by Organization Size 2019 & 2032
- Table 111: Global Customer Engagement Solution Industry Revenue Million Forecast, by End-user Industry 2019 & 2032
- Table 112: Global Customer Engagement Solution Industry Volume K Unit Forecast, by End-user Industry 2019 & 2032
- Table 113: Global Customer Engagement Solution Industry Revenue Million Forecast, by Services 2019 & 2032
- Table 114: Global Customer Engagement Solution Industry Volume K Unit Forecast, by Services 2019 & 2032
- Table 115: Global Customer Engagement Solution Industry Revenue Million Forecast, by Country 2019 & 2032
- Table 116: Global Customer Engagement Solution Industry Volume K Unit Forecast, by Country 2019 & 2032
- Table 117: United States Customer Engagement Solution Industry Revenue (Million) Forecast, by Application 2019 & 2032
- Table 118: United States Customer Engagement Solution Industry Volume (K Unit) Forecast, by Application 2019 & 2032
- Table 119: Canada Customer Engagement Solution Industry Revenue (Million) Forecast, by Application 2019 & 2032
- Table 120: Canada Customer Engagement Solution Industry Volume (K Unit) Forecast, by Application 2019 & 2032
- Table 121: Global Customer Engagement Solution Industry Revenue Million Forecast, by Component 2019 & 2032
- Table 122: Global Customer Engagement Solution Industry Volume K Unit Forecast, by Component 2019 & 2032
- Table 123: Global Customer Engagement Solution Industry Revenue Million Forecast, by Deployment Type 2019 & 2032
- Table 124: Global Customer Engagement Solution Industry Volume K Unit Forecast, by Deployment Type 2019 & 2032
- Table 125: Global Customer Engagement Solution Industry Revenue Million Forecast, by Organization Size 2019 & 2032
- Table 126: Global Customer Engagement Solution Industry Volume K Unit Forecast, by Organization Size 2019 & 2032
- Table 127: Global Customer Engagement Solution Industry Revenue Million Forecast, by End-user Industry 2019 & 2032
- Table 128: Global Customer Engagement Solution Industry Volume K Unit Forecast, by End-user Industry 2019 & 2032
- Table 129: Global Customer Engagement Solution Industry Revenue Million Forecast, by Services 2019 & 2032
- Table 130: Global Customer Engagement Solution Industry Volume K Unit Forecast, by Services 2019 & 2032
- Table 131: Global Customer Engagement Solution Industry Revenue Million Forecast, by Country 2019 & 2032
- Table 132: Global Customer Engagement Solution Industry Volume K Unit Forecast, by Country 2019 & 2032
- Table 133: United Kingdom Customer Engagement Solution Industry Revenue (Million) Forecast, by Application 2019 & 2032
- Table 134: United Kingdom Customer Engagement Solution Industry Volume (K Unit) Forecast, by Application 2019 & 2032
- Table 135: Germany Customer Engagement Solution Industry Revenue (Million) Forecast, by Application 2019 & 2032
- Table 136: Germany Customer Engagement Solution Industry Volume (K Unit) Forecast, by Application 2019 & 2032
- Table 137: France Customer Engagement Solution Industry Revenue (Million) Forecast, by Application 2019 & 2032
- Table 138: France Customer Engagement Solution Industry Volume (K Unit) Forecast, by Application 2019 & 2032
- Table 139: Global Customer Engagement Solution Industry Revenue Million Forecast, by Component 2019 & 2032
- Table 140: Global Customer Engagement Solution Industry Volume K Unit Forecast, by Component 2019 & 2032
- Table 141: Global Customer Engagement Solution Industry Revenue Million Forecast, by Deployment Type 2019 & 2032
- Table 142: Global Customer Engagement Solution Industry Volume K Unit Forecast, by Deployment Type 2019 & 2032
- Table 143: Global Customer Engagement Solution Industry Revenue Million Forecast, by Organization Size 2019 & 2032
- Table 144: Global Customer Engagement Solution Industry Volume K Unit Forecast, by Organization Size 2019 & 2032
- Table 145: Global Customer Engagement Solution Industry Revenue Million Forecast, by End-user Industry 2019 & 2032
- Table 146: Global Customer Engagement Solution Industry Volume K Unit Forecast, by End-user Industry 2019 & 2032
- Table 147: Global Customer Engagement Solution Industry Revenue Million Forecast, by Services 2019 & 2032
- Table 148: Global Customer Engagement Solution Industry Volume K Unit Forecast, by Services 2019 & 2032
- Table 149: Global Customer Engagement Solution Industry Revenue Million Forecast, by Country 2019 & 2032
- Table 150: Global Customer Engagement Solution Industry Volume K Unit Forecast, by Country 2019 & 2032
- Table 151: China Customer Engagement Solution Industry Revenue (Million) Forecast, by Application 2019 & 2032
- Table 152: China Customer Engagement Solution Industry Volume (K Unit) Forecast, by Application 2019 & 2032
- Table 153: India Customer Engagement Solution Industry Revenue (Million) Forecast, by Application 2019 & 2032
- Table 154: India Customer Engagement Solution Industry Volume (K Unit) Forecast, by Application 2019 & 2032
- Table 155: Japan Customer Engagement Solution Industry Revenue (Million) Forecast, by Application 2019 & 2032
- Table 156: Japan Customer Engagement Solution Industry Volume (K Unit) Forecast, by Application 2019 & 2032
- Table 157: Global Customer Engagement Solution Industry Revenue Million Forecast, by Component 2019 & 2032
- Table 158: Global Customer Engagement Solution Industry Volume K Unit Forecast, by Component 2019 & 2032
- Table 159: Global Customer Engagement Solution Industry Revenue Million Forecast, by Deployment Type 2019 & 2032
- Table 160: Global Customer Engagement Solution Industry Volume K Unit Forecast, by Deployment Type 2019 & 2032
- Table 161: Global Customer Engagement Solution Industry Revenue Million Forecast, by Organization Size 2019 & 2032
- Table 162: Global Customer Engagement Solution Industry Volume K Unit Forecast, by Organization Size 2019 & 2032
- Table 163: Global Customer Engagement Solution Industry Revenue Million Forecast, by End-user Industry 2019 & 2032
- Table 164: Global Customer Engagement Solution Industry Volume K Unit Forecast, by End-user Industry 2019 & 2032
- Table 165: Global Customer Engagement Solution Industry Revenue Million Forecast, by Services 2019 & 2032
- Table 166: Global Customer Engagement Solution Industry Volume K Unit Forecast, by Services 2019 & 2032
- Table 167: Global Customer Engagement Solution Industry Revenue Million Forecast, by Country 2019 & 2032
- Table 168: Global Customer Engagement Solution Industry Volume K Unit Forecast, by Country 2019 & 2032
- Table 169: Brazil Customer Engagement Solution Industry Revenue (Million) Forecast, by Application 2019 & 2032
- Table 170: Brazil Customer Engagement Solution Industry Volume (K Unit) Forecast, by Application 2019 & 2032
- Table 171: Argentina Customer Engagement Solution Industry Revenue (Million) Forecast, by Application 2019 & 2032
- Table 172: Argentina Customer Engagement Solution Industry Volume (K Unit) Forecast, by Application 2019 & 2032
- Table 173: Rest of South America Customer Engagement Solution Industry Revenue (Million) Forecast, by Application 2019 & 2032
- Table 174: Rest of South America Customer Engagement Solution Industry Volume (K Unit) Forecast, by Application 2019 & 2032
- Table 175: Global Customer Engagement Solution Industry Revenue Million Forecast, by Component 2019 & 2032
- Table 176: Global Customer Engagement Solution Industry Volume K Unit Forecast, by Component 2019 & 2032
- Table 177: Global Customer Engagement Solution Industry Revenue Million Forecast, by Deployment Type 2019 & 2032
- Table 178: Global Customer Engagement Solution Industry Volume K Unit Forecast, by Deployment Type 2019 & 2032
- Table 179: Global Customer Engagement Solution Industry Revenue Million Forecast, by Organization Size 2019 & 2032
- Table 180: Global Customer Engagement Solution Industry Volume K Unit Forecast, by Organization Size 2019 & 2032
- Table 181: Global Customer Engagement Solution Industry Revenue Million Forecast, by End-user Industry 2019 & 2032
- Table 182: Global Customer Engagement Solution Industry Volume K Unit Forecast, by End-user Industry 2019 & 2032
- Table 183: Global Customer Engagement Solution Industry Revenue Million Forecast, by Services 2019 & 2032
- Table 184: Global Customer Engagement Solution Industry Volume K Unit Forecast, by Services 2019 & 2032
- Table 185: Global Customer Engagement Solution Industry Revenue Million Forecast, by Country 2019 & 2032
- Table 186: Global Customer Engagement Solution Industry Volume K Unit Forecast, by Country 2019 & 2032
- Table 187: UAE Customer Engagement Solution Industry Revenue (Million) Forecast, by Application 2019 & 2032
- Table 188: UAE Customer Engagement Solution Industry Volume (K Unit) Forecast, by Application 2019 & 2032
- Table 189: South Africa Customer Engagement Solution Industry Revenue (Million) Forecast, by Application 2019 & 2032
- Table 190: South Africa Customer Engagement Solution Industry Volume (K Unit) Forecast, by Application 2019 & 2032
- Table 191: Saudi Arabia Customer Engagement Solution Industry Revenue (Million) Forecast, by Application 2019 & 2032
- Table 192: Saudi Arabia Customer Engagement Solution Industry Volume (K Unit) Forecast, by Application 2019 & 2032
- Table 193: Rest Of MEA Customer Engagement Solution Industry Revenue (Million) Forecast, by Application 2019 & 2032
- Table 194: Rest Of MEA Customer Engagement Solution Industry Volume (K Unit) Forecast, by Application 2019 & 2032
Frequently Asked Questions
1. What is the projected Compound Annual Growth Rate (CAGR) of the Customer Engagement Solution Industry?
The projected CAGR is approximately 10.97%.
2. Which companies are prominent players in the Customer Engagement Solution Industry?
Key companies in the market include Nuance Communications Inc, Alvaria Inc, OpenText Corporation, IBM Corporation, Nice Systems Ltd, SAP SE, Salesforce com Inc, Avaya Inc, Pegasystems Inc, Verint Systems Inc, Genesys, Oracle Corporation, Calabrio Inc.
3. What are the main segments of the Customer Engagement Solution Industry?
The market segments include Component, Deployment Type, Organization Size, End-user Industry, Services.
4. Can you provide details about the market size?
The market size is estimated to be USD 21.84 Million as of 2022.
5. What are some drivers contributing to market growth?
Rapidly Increasing Cybersecurity Incidents and Regulations Requiring Their Reporting; Growing M2M/IoT Connections Demanding Strengthened Cybersecurity in Enterprises.
6. What are the notable trends driving market growth?
BFSI Industry Have the Significant Market Share.
7. Are there any restraints impacting market growth?
Lack of Cybersecurity Professionals; High Reliance on Traditional Authentication Methods and Low Preparedness.
8. Can you provide examples of recent developments in the market?
February 2023: GoTo, a firm that makes business communication, IT administration, and support simple with its core products GoTo Resolve, GoTo Connect, and Rescue, announced the launch of GoTo Customer Engagement. In a single, shared inbox, this innovative multi-channel solution combines GoTo Connect's premium phone system, customer communication tools, analytics, and the digital channels customers need to reach a wider audience and expand their businesses.
9. What pricing options are available for accessing the report?
Pricing options include single-user, multi-user, and enterprise licenses priced at USD 4750, USD 5250, and USD 8750 respectively.
10. Is the market size provided in terms of value or volume?
The market size is provided in terms of value, measured in Million and volume, measured in K Unit.
11. Are there any specific market keywords associated with the report?
Yes, the market keyword associated with the report is "Customer Engagement Solution Industry," which aids in identifying and referencing the specific market segment covered.
12. How do I determine which pricing option suits my needs best?
The pricing options vary based on user requirements and access needs. Individual users may opt for single-user licenses, while businesses requiring broader access may choose multi-user or enterprise licenses for cost-effective access to the report.
13. Are there any additional resources or data provided in the Customer Engagement Solution Industry report?
While the report offers comprehensive insights, it's advisable to review the specific contents or supplementary materials provided to ascertain if additional resources or data are available.
14. How can I stay updated on further developments or reports in the Customer Engagement Solution Industry?
To stay informed about further developments, trends, and reports in the Customer Engagement Solution Industry, consider subscribing to industry newsletters, following relevant companies and organizations, or regularly checking reputable industry news sources and publications.
Methodology
Step 1 - Identification of Relevant Samples Size from Population Database


Step 2 - Approaches for Defining Global Market Size (Value, Volume* & Price*)

Note*: In applicable scenarios
Step 3 - Data Sources
Primary Research
- Web Analytics
- Survey Reports
- Research Institute
- Latest Research Reports
- Opinion Leaders
Secondary Research
- Annual Reports
- White Paper
- Latest Press Release
- Industry Association
- Paid Database
- Investor Presentations

Step 4 - Data Triangulation
Involves using different sources of information in order to increase the validity of a study
These sources are likely to be stakeholders in a program - participants, other researchers, program staff, other community members, and so on.
Then we put all data in single framework & apply various statistical tools to find out the dynamic on the market.
During the analysis stage, feedback from the stakeholder groups would be compared to determine areas of agreement as well as areas of divergence


