
Key Insights
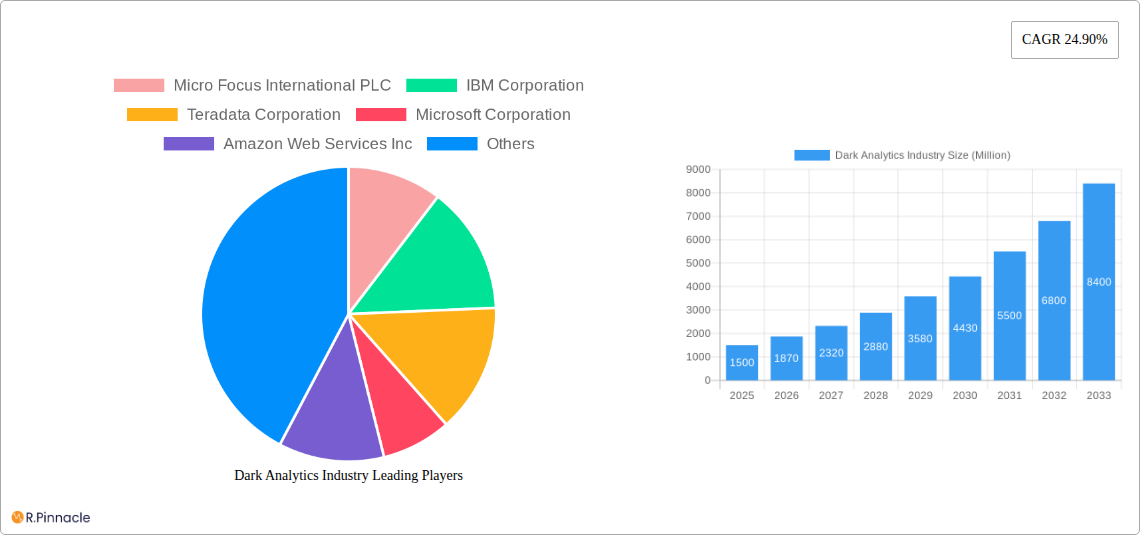
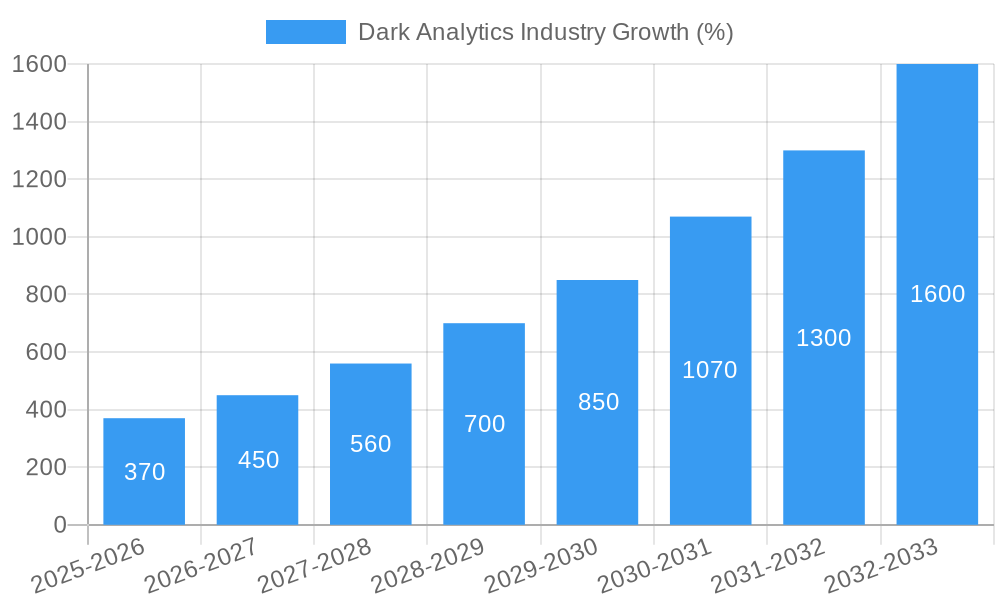
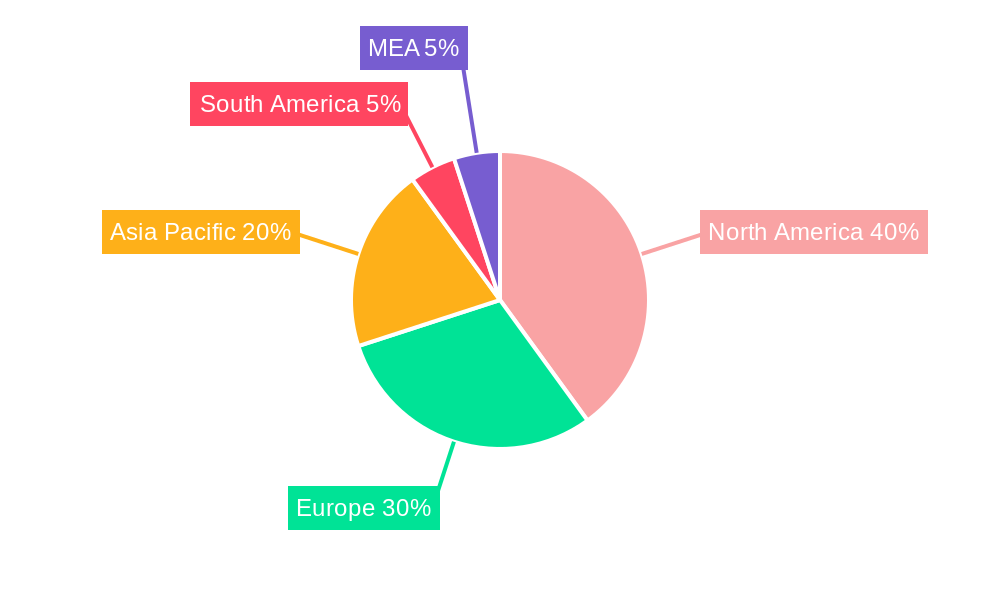
The Dark Analytics market, encompassing the analysis of unstructured and unlabeled data, is experiencing robust growth, projected at a 24.90% CAGR from 2025 to 2033. This expansion is fueled by several key drivers. The increasing volume of unstructured data generated across various sectors—from financial services and healthcare to retail and e-commerce—presents a significant opportunity for extracting valuable insights previously inaccessible through traditional analytics methods. Advanced machine learning algorithms and AI-powered tools are improving the efficiency and accuracy of dark data analysis, leading to better decision-making and improved operational efficiencies. Furthermore, growing regulatory compliance needs and the need for fraud detection are also driving demand. The market is segmented by end-user vertical (BFSI, Healthcare, Government, Telecommunications, Retail & E-commerce, Others) and by type of analytics (Predictive, Prescriptive, Descriptive), with predictive analytics expected to maintain a leading share due to its ability to anticipate future trends and risks. North America currently holds a significant market share, driven by early adoption and technological advancements, but the Asia-Pacific region is poised for rapid growth, fueled by increasing digitalization and data generation.
Despite its immense potential, the Dark Analytics market faces certain restraints. The complexity involved in processing unstructured data requires specialized expertise and robust infrastructure, potentially leading to high implementation costs. Data security and privacy concerns also remain significant hurdles, demanding robust data governance and compliance frameworks. However, continuous technological advancements, coupled with growing awareness of the value of dark data, are expected to mitigate these challenges. The emergence of cloud-based solutions and specialized analytical platforms is simplifying access and deployment, thereby driving market penetration across different industry verticals and geographical locations. The competitive landscape is characterized by a mix of established players like IBM, Microsoft, and SAS, and emerging innovative startups vying for market share. This competition is driving innovation and leading to the development of increasingly sophisticated and user-friendly solutions.
Dark Analytics Industry Market Report: 2019-2033
This comprehensive report provides an in-depth analysis of the Dark Analytics industry, offering invaluable insights for industry professionals, investors, and strategists. With a detailed study period spanning 2019-2033 (Base Year: 2025, Estimated Year: 2025, Forecast Period: 2025-2033, Historical Period: 2019-2024), this report unveils the market's structure, dynamics, dominant segments, and future outlook. Expect detailed analysis across various segments, including end-user verticals (BFSI, Healthcare, Government, Telecommunications, Retail & E-commerce, and Others) and types of analytics (Predictive, Prescriptive, and Descriptive). The report projects a market value exceeding $XX Million by 2033, presenting lucrative opportunities for growth.
Dark Analytics Industry Market Structure & Innovation Trends
The Dark Analytics market exhibits a moderately concentrated structure, with key players such as Micro Focus International PLC, IBM Corporation, Teradata Corporation, Microsoft Corporation, Amazon Web Services Inc, SAS Institute, Hewlett-Packard Enterprise Company, Oracle Corporation, and SAP SE holding significant market share. However, the market also features several smaller, specialized players, leading to a dynamic competitive landscape. Market share analysis reveals that the top 5 players cumulatively hold approximately 60% of the market, indicating moderate concentration. M&A activities have been significant, with deal values exceeding $XX Million in the past five years. These activities are primarily driven by companies aiming to expand their product portfolios and enhance technological capabilities.
- Market Concentration: Moderately concentrated, with top 5 players holding ~60% market share.
- Innovation Drivers: Advancements in AI, machine learning, and big data technologies.
- Regulatory Frameworks: Varying across regions, impacting data privacy and security.
- Product Substitutes: Limited direct substitutes; competition stems from alternative analytical approaches.
- End-User Demographics: Primarily large enterprises and government agencies.
- M&A Activities: Significant activity, with total deal values exceeding $XX Million in the past five years.
Dark Analytics Industry Market Dynamics & Trends
The Dark Analytics market is experiencing robust growth, driven by factors such as the increasing adoption of cloud computing, the growing need for sophisticated data security, and rising concerns about data privacy and regulation. The market is projected to witness a Compound Annual Growth Rate (CAGR) of XX% during the forecast period (2025-2033). Technological advancements, such as the development of more powerful AI and machine learning algorithms, are further accelerating market expansion. Consumer preference for enhanced data security and privacy is a key driver, pushing market penetration to XX% by 2033. Competitive dynamics are characterized by intense rivalry among established players and the emergence of new entrants with innovative solutions.
Dominant Regions & Segments in Dark Analytics Industry
The North American region currently dominates the Dark Analytics market, driven by factors such as robust technological infrastructure, high levels of digital adoption, and substantial investments in R&D. However, the Asia-Pacific region is anticipated to show the highest growth during the forecast period due to increasing digitalization and the growing adoption of cloud-based solutions.
By End-user Vertical: BFSI holds the largest market share, followed by Healthcare and Government. BFSI's dominance is driven by its requirement for robust fraud detection and risk management systems.
Key Drivers (BFSI): Stringent regulatory compliance needs, increasing cyber threats.
Key Drivers (Healthcare): Growing adoption of Electronic Health Records (EHR), need for personalized medicine.
Key Drivers (Government): National security needs, increase in cyber espionage.
By Type of Analytics: Predictive analytics segment currently leads, with prescriptive analytics gaining traction.
Dark Analytics Industry Product Innovations
Recent product innovations have focused on enhanced data security, improved AI and machine learning capabilities, and the integration of cloud-based solutions. Companies are developing sophisticated algorithms to detect and mitigate security threats and developing user-friendly interfaces to improve accessibility and ease of use. The market is witnessing increased integration with existing business intelligence platforms, expanding the applications of Dark Analytics across multiple industries.
Report Scope & Segmentation Analysis
This report comprehensively analyzes the Dark Analytics market across various segments:
By End-user Vertical: BFSI, Healthcare, Government, Telecommunications, Retail & E-commerce, Other End-user Verticals. Each segment is analyzed, including growth projections, market sizes, and competitive dynamics.
By Type of Analytics: Predictive, Prescriptive, Descriptive. The report details the growth trajectory of each analytic type and their respective market shares.
Key Drivers of Dark Analytics Industry Growth
The growth of the Dark Analytics industry is propelled by technological advancements in AI and machine learning, increasing concerns over data security, and stringent regulatory compliance requirements across various industries. The escalating volume of data generated requires advanced analytical techniques to derive actionable insights, fueling market expansion.
Challenges in the Dark Analytics Industry Sector
Challenges include the high cost of implementation, the complexity of deploying Dark Analytics solutions, the shortage of skilled professionals, and the concerns over data privacy and ethical implications. Regulatory hurdles and evolving compliance standards also pose significant barriers to market growth, impacting adoption rates and slowing down market expansion.
Emerging Opportunities in Dark Analytics Industry
Emerging opportunities lie in the integration of Dark Analytics with IoT devices, the development of more advanced threat detection systems, and the exploration of new applications in fields such as supply chain optimization and fraud detection. The growing adoption of cloud-based services presents a significant opportunity for market expansion.
Leading Players in the Dark Analytics Industry Market
- Micro Focus International PLC
- IBM Corporation
- Teradata Corporation
- Microsoft Corporation
- Amazon Web Services Inc
- SAS Institute
- Hewlett-Packard Enterprise Company
- Oracle Corporation
- SAP SE
Key Developments in Dark Analytics Industry
- November 2022: Cloudera launched the Cloudera Partner Network, promoting adoption of its hybrid data platform and contemporary data techniques.
- February 2023: N-iX received Amazon Redshift and Amazon EMR Service Delivery Designation, enhancing its big data analytics capabilities.
Future Outlook for Dark Analytics Industry Market
The Dark Analytics market is poised for continued growth, driven by technological advancements and the increasing demand for robust data security solutions. Strategic partnerships and collaborations among industry players will further accelerate market expansion, creating lucrative opportunities for innovation and growth. The market is expected to surpass $XX Million by 2033.
Dark Analytics Industry Segmentation
-
1. Type of Analytics
- 1.1. Predictive
- 1.2. Prescriptive
- 1.3. Descriptive
-
2. End-user Vertical
- 2.1. BFSI
- 2.2. Healthcare
- 2.3. Government
- 2.4. Telecommunications
- 2.5. Retail & E-commerce
- 2.6. Other End-user Verticals
Dark Analytics Industry Segmentation By Geography
-
1. North America
- 1.1. United States
- 1.2. Canada
-
2. Europe
- 2.1. United Kingdom
- 2.2. Germany
- 2.3. Rest of Europe
-
3. Asia Pacific
- 3.1. China
- 3.2. Japan
- 3.3. Australia
- 3.4. Rest of Asia Pacific
-
4. Rest of the World
- 4.1. Latin America
- 4.2. Middl East
Dark Analytics Industry REPORT HIGHLIGHTS
| Aspects | Details |
|---|---|
| Study Period | 2019-2033 |
| Base Year | 2024 |
| Estimated Year | 2025 |
| Forecast Period | 2025-2033 |
| Historical Period | 2019-2024 |
| Growth Rate | CAGR of 24.90% from 2019-2033 |
| Segmentation |
|
Table of Contents
- 1. Introduction
- 1.1. Research Scope
- 1.2. Market Segmentation
- 1.3. Research Methodology
- 1.4. Definitions and Assumptions
- 2. Executive Summary
- 2.1. Introduction
- 3. Market Dynamics
- 3.1. Introduction
- 3.2. Market Drivers
- 3.2.1. Increasing Adoption Rates of Machine Learning and Artificial Intelligence; Rapid Growth in Generated Data Volume and Variety Owing to Adoption of IoT
- 3.3. Market Restrains
- 3.3.1. Security Concerns
- 3.4. Market Trends
- 3.4.1. Retail and E-commerce to Hold Significant Growth
- 4. Market Factor Analysis
- 4.1. Porters Five Forces
- 4.2. Supply/Value Chain
- 4.3. PESTEL analysis
- 4.4. Market Entropy
- 4.5. Patent/Trademark Analysis
- 5. Global Dark Analytics Industry Analysis, Insights and Forecast, 2019-2031
- 5.1. Market Analysis, Insights and Forecast - by Type of Analytics
- 5.1.1. Predictive
- 5.1.2. Prescriptive
- 5.1.3. Descriptive
- 5.2. Market Analysis, Insights and Forecast - by End-user Vertical
- 5.2.1. BFSI
- 5.2.2. Healthcare
- 5.2.3. Government
- 5.2.4. Telecommunications
- 5.2.5. Retail & E-commerce
- 5.2.6. Other End-user Verticals
- 5.3. Market Analysis, Insights and Forecast - by Region
- 5.3.1. North America
- 5.3.2. Europe
- 5.3.3. Asia Pacific
- 5.3.4. Rest of the World
- 5.1. Market Analysis, Insights and Forecast - by Type of Analytics
- 6. North America Dark Analytics Industry Analysis, Insights and Forecast, 2019-2031
- 6.1. Market Analysis, Insights and Forecast - by Type of Analytics
- 6.1.1. Predictive
- 6.1.2. Prescriptive
- 6.1.3. Descriptive
- 6.2. Market Analysis, Insights and Forecast - by End-user Vertical
- 6.2.1. BFSI
- 6.2.2. Healthcare
- 6.2.3. Government
- 6.2.4. Telecommunications
- 6.2.5. Retail & E-commerce
- 6.2.6. Other End-user Verticals
- 6.1. Market Analysis, Insights and Forecast - by Type of Analytics
- 7. Europe Dark Analytics Industry Analysis, Insights and Forecast, 2019-2031
- 7.1. Market Analysis, Insights and Forecast - by Type of Analytics
- 7.1.1. Predictive
- 7.1.2. Prescriptive
- 7.1.3. Descriptive
- 7.2. Market Analysis, Insights and Forecast - by End-user Vertical
- 7.2.1. BFSI
- 7.2.2. Healthcare
- 7.2.3. Government
- 7.2.4. Telecommunications
- 7.2.5. Retail & E-commerce
- 7.2.6. Other End-user Verticals
- 7.1. Market Analysis, Insights and Forecast - by Type of Analytics
- 8. Asia Pacific Dark Analytics Industry Analysis, Insights and Forecast, 2019-2031
- 8.1. Market Analysis, Insights and Forecast - by Type of Analytics
- 8.1.1. Predictive
- 8.1.2. Prescriptive
- 8.1.3. Descriptive
- 8.2. Market Analysis, Insights and Forecast - by End-user Vertical
- 8.2.1. BFSI
- 8.2.2. Healthcare
- 8.2.3. Government
- 8.2.4. Telecommunications
- 8.2.5. Retail & E-commerce
- 8.2.6. Other End-user Verticals
- 8.1. Market Analysis, Insights and Forecast - by Type of Analytics
- 9. Rest of the World Dark Analytics Industry Analysis, Insights and Forecast, 2019-2031
- 9.1. Market Analysis, Insights and Forecast - by Type of Analytics
- 9.1.1. Predictive
- 9.1.2. Prescriptive
- 9.1.3. Descriptive
- 9.2. Market Analysis, Insights and Forecast - by End-user Vertical
- 9.2.1. BFSI
- 9.2.2. Healthcare
- 9.2.3. Government
- 9.2.4. Telecommunications
- 9.2.5. Retail & E-commerce
- 9.2.6. Other End-user Verticals
- 9.1. Market Analysis, Insights and Forecast - by Type of Analytics
- 10. North America Dark Analytics Industry Analysis, Insights and Forecast, 2019-2031
- 10.1. Market Analysis, Insights and Forecast - By Country/Sub-region
- 10.1.1 United States
- 10.1.2 Canada
- 10.1.3 Mexico
- 11. Europe Dark Analytics Industry Analysis, Insights and Forecast, 2019-2031
- 11.1. Market Analysis, Insights and Forecast - By Country/Sub-region
- 11.1.1 Germany
- 11.1.2 United Kingdom
- 11.1.3 France
- 11.1.4 Spain
- 11.1.5 Italy
- 11.1.6 Spain
- 11.1.7 Belgium
- 11.1.8 Netherland
- 11.1.9 Nordics
- 11.1.10 Rest of Europe
- 12. Asia Pacific Dark Analytics Industry Analysis, Insights and Forecast, 2019-2031
- 12.1. Market Analysis, Insights and Forecast - By Country/Sub-region
- 12.1.1 China
- 12.1.2 Japan
- 12.1.3 India
- 12.1.4 South Korea
- 12.1.5 Southeast Asia
- 12.1.6 Australia
- 12.1.7 Indonesia
- 12.1.8 Phillipes
- 12.1.9 Singapore
- 12.1.10 Thailandc
- 12.1.11 Rest of Asia Pacific
- 13. South America Dark Analytics Industry Analysis, Insights and Forecast, 2019-2031
- 13.1. Market Analysis, Insights and Forecast - By Country/Sub-region
- 13.1.1 Brazil
- 13.1.2 Argentina
- 13.1.3 Peru
- 13.1.4 Chile
- 13.1.5 Colombia
- 13.1.6 Ecuador
- 13.1.7 Venezuela
- 13.1.8 Rest of South America
- 14. North America Dark Analytics Industry Analysis, Insights and Forecast, 2019-2031
- 14.1. Market Analysis, Insights and Forecast - By Country/Sub-region
- 14.1.1 United States
- 14.1.2 Canada
- 14.1.3 Mexico
- 15. MEA Dark Analytics Industry Analysis, Insights and Forecast, 2019-2031
- 15.1. Market Analysis, Insights and Forecast - By Country/Sub-region
- 15.1.1 United Arab Emirates
- 15.1.2 Saudi Arabia
- 15.1.3 South Africa
- 15.1.4 Rest of Middle East and Africa
- 16. Competitive Analysis
- 16.1. Global Market Share Analysis 2024
- 16.2. Company Profiles
- 16.2.1 Micro Focus International PLC
- 16.2.1.1. Overview
- 16.2.1.2. Products
- 16.2.1.3. SWOT Analysis
- 16.2.1.4. Recent Developments
- 16.2.1.5. Financials (Based on Availability)
- 16.2.2 IBM Corporation
- 16.2.2.1. Overview
- 16.2.2.2. Products
- 16.2.2.3. SWOT Analysis
- 16.2.2.4. Recent Developments
- 16.2.2.5. Financials (Based on Availability)
- 16.2.3 Teradata Corporation
- 16.2.3.1. Overview
- 16.2.3.2. Products
- 16.2.3.3. SWOT Analysis
- 16.2.3.4. Recent Developments
- 16.2.3.5. Financials (Based on Availability)
- 16.2.4 Microsoft Corporation
- 16.2.4.1. Overview
- 16.2.4.2. Products
- 16.2.4.3. SWOT Analysis
- 16.2.4.4. Recent Developments
- 16.2.4.5. Financials (Based on Availability)
- 16.2.5 Amazon Web Services Inc
- 16.2.5.1. Overview
- 16.2.5.2. Products
- 16.2.5.3. SWOT Analysis
- 16.2.5.4. Recent Developments
- 16.2.5.5. Financials (Based on Availability)
- 16.2.6 SAS Institute
- 16.2.6.1. Overview
- 16.2.6.2. Products
- 16.2.6.3. SWOT Analysis
- 16.2.6.4. Recent Developments
- 16.2.6.5. Financials (Based on Availability)
- 16.2.7 Hewlett-Packard Enterprise Company
- 16.2.7.1. Overview
- 16.2.7.2. Products
- 16.2.7.3. SWOT Analysis
- 16.2.7.4. Recent Developments
- 16.2.7.5. Financials (Based on Availability)
- 16.2.8 Oracle Corporation*List Not Exhaustive
- 16.2.8.1. Overview
- 16.2.8.2. Products
- 16.2.8.3. SWOT Analysis
- 16.2.8.4. Recent Developments
- 16.2.8.5. Financials (Based on Availability)
- 16.2.9 SAP SE
- 16.2.9.1. Overview
- 16.2.9.2. Products
- 16.2.9.3. SWOT Analysis
- 16.2.9.4. Recent Developments
- 16.2.9.5. Financials (Based on Availability)
- 16.2.1 Micro Focus International PLC
List of Figures
- Figure 1: Global Dark Analytics Industry Revenue Breakdown (Million, %) by Region 2024 & 2032
- Figure 2: North America Dark Analytics Industry Revenue (Million), by Country 2024 & 2032
- Figure 3: North America Dark Analytics Industry Revenue Share (%), by Country 2024 & 2032
- Figure 4: Europe Dark Analytics Industry Revenue (Million), by Country 2024 & 2032
- Figure 5: Europe Dark Analytics Industry Revenue Share (%), by Country 2024 & 2032
- Figure 6: Asia Pacific Dark Analytics Industry Revenue (Million), by Country 2024 & 2032
- Figure 7: Asia Pacific Dark Analytics Industry Revenue Share (%), by Country 2024 & 2032
- Figure 8: South America Dark Analytics Industry Revenue (Million), by Country 2024 & 2032
- Figure 9: South America Dark Analytics Industry Revenue Share (%), by Country 2024 & 2032
- Figure 10: North America Dark Analytics Industry Revenue (Million), by Country 2024 & 2032
- Figure 11: North America Dark Analytics Industry Revenue Share (%), by Country 2024 & 2032
- Figure 12: MEA Dark Analytics Industry Revenue (Million), by Country 2024 & 2032
- Figure 13: MEA Dark Analytics Industry Revenue Share (%), by Country 2024 & 2032
- Figure 14: North America Dark Analytics Industry Revenue (Million), by Type of Analytics 2024 & 2032
- Figure 15: North America Dark Analytics Industry Revenue Share (%), by Type of Analytics 2024 & 2032
- Figure 16: North America Dark Analytics Industry Revenue (Million), by End-user Vertical 2024 & 2032
- Figure 17: North America Dark Analytics Industry Revenue Share (%), by End-user Vertical 2024 & 2032
- Figure 18: North America Dark Analytics Industry Revenue (Million), by Country 2024 & 2032
- Figure 19: North America Dark Analytics Industry Revenue Share (%), by Country 2024 & 2032
- Figure 20: Europe Dark Analytics Industry Revenue (Million), by Type of Analytics 2024 & 2032
- Figure 21: Europe Dark Analytics Industry Revenue Share (%), by Type of Analytics 2024 & 2032
- Figure 22: Europe Dark Analytics Industry Revenue (Million), by End-user Vertical 2024 & 2032
- Figure 23: Europe Dark Analytics Industry Revenue Share (%), by End-user Vertical 2024 & 2032
- Figure 24: Europe Dark Analytics Industry Revenue (Million), by Country 2024 & 2032
- Figure 25: Europe Dark Analytics Industry Revenue Share (%), by Country 2024 & 2032
- Figure 26: Asia Pacific Dark Analytics Industry Revenue (Million), by Type of Analytics 2024 & 2032
- Figure 27: Asia Pacific Dark Analytics Industry Revenue Share (%), by Type of Analytics 2024 & 2032
- Figure 28: Asia Pacific Dark Analytics Industry Revenue (Million), by End-user Vertical 2024 & 2032
- Figure 29: Asia Pacific Dark Analytics Industry Revenue Share (%), by End-user Vertical 2024 & 2032
- Figure 30: Asia Pacific Dark Analytics Industry Revenue (Million), by Country 2024 & 2032
- Figure 31: Asia Pacific Dark Analytics Industry Revenue Share (%), by Country 2024 & 2032
- Figure 32: Rest of the World Dark Analytics Industry Revenue (Million), by Type of Analytics 2024 & 2032
- Figure 33: Rest of the World Dark Analytics Industry Revenue Share (%), by Type of Analytics 2024 & 2032
- Figure 34: Rest of the World Dark Analytics Industry Revenue (Million), by End-user Vertical 2024 & 2032
- Figure 35: Rest of the World Dark Analytics Industry Revenue Share (%), by End-user Vertical 2024 & 2032
- Figure 36: Rest of the World Dark Analytics Industry Revenue (Million), by Country 2024 & 2032
- Figure 37: Rest of the World Dark Analytics Industry Revenue Share (%), by Country 2024 & 2032
List of Tables
- Table 1: Global Dark Analytics Industry Revenue Million Forecast, by Region 2019 & 2032
- Table 2: Global Dark Analytics Industry Revenue Million Forecast, by Type of Analytics 2019 & 2032
- Table 3: Global Dark Analytics Industry Revenue Million Forecast, by End-user Vertical 2019 & 2032
- Table 4: Global Dark Analytics Industry Revenue Million Forecast, by Region 2019 & 2032
- Table 5: Global Dark Analytics Industry Revenue Million Forecast, by Country 2019 & 2032
- Table 6: United States Dark Analytics Industry Revenue (Million) Forecast, by Application 2019 & 2032
- Table 7: Canada Dark Analytics Industry Revenue (Million) Forecast, by Application 2019 & 2032
- Table 8: Mexico Dark Analytics Industry Revenue (Million) Forecast, by Application 2019 & 2032
- Table 9: Global Dark Analytics Industry Revenue Million Forecast, by Country 2019 & 2032
- Table 10: Germany Dark Analytics Industry Revenue (Million) Forecast, by Application 2019 & 2032
- Table 11: United Kingdom Dark Analytics Industry Revenue (Million) Forecast, by Application 2019 & 2032
- Table 12: France Dark Analytics Industry Revenue (Million) Forecast, by Application 2019 & 2032
- Table 13: Spain Dark Analytics Industry Revenue (Million) Forecast, by Application 2019 & 2032
- Table 14: Italy Dark Analytics Industry Revenue (Million) Forecast, by Application 2019 & 2032
- Table 15: Spain Dark Analytics Industry Revenue (Million) Forecast, by Application 2019 & 2032
- Table 16: Belgium Dark Analytics Industry Revenue (Million) Forecast, by Application 2019 & 2032
- Table 17: Netherland Dark Analytics Industry Revenue (Million) Forecast, by Application 2019 & 2032
- Table 18: Nordics Dark Analytics Industry Revenue (Million) Forecast, by Application 2019 & 2032
- Table 19: Rest of Europe Dark Analytics Industry Revenue (Million) Forecast, by Application 2019 & 2032
- Table 20: Global Dark Analytics Industry Revenue Million Forecast, by Country 2019 & 2032
- Table 21: China Dark Analytics Industry Revenue (Million) Forecast, by Application 2019 & 2032
- Table 22: Japan Dark Analytics Industry Revenue (Million) Forecast, by Application 2019 & 2032
- Table 23: India Dark Analytics Industry Revenue (Million) Forecast, by Application 2019 & 2032
- Table 24: South Korea Dark Analytics Industry Revenue (Million) Forecast, by Application 2019 & 2032
- Table 25: Southeast Asia Dark Analytics Industry Revenue (Million) Forecast, by Application 2019 & 2032
- Table 26: Australia Dark Analytics Industry Revenue (Million) Forecast, by Application 2019 & 2032
- Table 27: Indonesia Dark Analytics Industry Revenue (Million) Forecast, by Application 2019 & 2032
- Table 28: Phillipes Dark Analytics Industry Revenue (Million) Forecast, by Application 2019 & 2032
- Table 29: Singapore Dark Analytics Industry Revenue (Million) Forecast, by Application 2019 & 2032
- Table 30: Thailandc Dark Analytics Industry Revenue (Million) Forecast, by Application 2019 & 2032
- Table 31: Rest of Asia Pacific Dark Analytics Industry Revenue (Million) Forecast, by Application 2019 & 2032
- Table 32: Global Dark Analytics Industry Revenue Million Forecast, by Country 2019 & 2032
- Table 33: Brazil Dark Analytics Industry Revenue (Million) Forecast, by Application 2019 & 2032
- Table 34: Argentina Dark Analytics Industry Revenue (Million) Forecast, by Application 2019 & 2032
- Table 35: Peru Dark Analytics Industry Revenue (Million) Forecast, by Application 2019 & 2032
- Table 36: Chile Dark Analytics Industry Revenue (Million) Forecast, by Application 2019 & 2032
- Table 37: Colombia Dark Analytics Industry Revenue (Million) Forecast, by Application 2019 & 2032
- Table 38: Ecuador Dark Analytics Industry Revenue (Million) Forecast, by Application 2019 & 2032
- Table 39: Venezuela Dark Analytics Industry Revenue (Million) Forecast, by Application 2019 & 2032
- Table 40: Rest of South America Dark Analytics Industry Revenue (Million) Forecast, by Application 2019 & 2032
- Table 41: Global Dark Analytics Industry Revenue Million Forecast, by Country 2019 & 2032
- Table 42: United States Dark Analytics Industry Revenue (Million) Forecast, by Application 2019 & 2032
- Table 43: Canada Dark Analytics Industry Revenue (Million) Forecast, by Application 2019 & 2032
- Table 44: Mexico Dark Analytics Industry Revenue (Million) Forecast, by Application 2019 & 2032
- Table 45: Global Dark Analytics Industry Revenue Million Forecast, by Country 2019 & 2032
- Table 46: United Arab Emirates Dark Analytics Industry Revenue (Million) Forecast, by Application 2019 & 2032
- Table 47: Saudi Arabia Dark Analytics Industry Revenue (Million) Forecast, by Application 2019 & 2032
- Table 48: South Africa Dark Analytics Industry Revenue (Million) Forecast, by Application 2019 & 2032
- Table 49: Rest of Middle East and Africa Dark Analytics Industry Revenue (Million) Forecast, by Application 2019 & 2032
- Table 50: Global Dark Analytics Industry Revenue Million Forecast, by Type of Analytics 2019 & 2032
- Table 51: Global Dark Analytics Industry Revenue Million Forecast, by End-user Vertical 2019 & 2032
- Table 52: Global Dark Analytics Industry Revenue Million Forecast, by Country 2019 & 2032
- Table 53: United States Dark Analytics Industry Revenue (Million) Forecast, by Application 2019 & 2032
- Table 54: Canada Dark Analytics Industry Revenue (Million) Forecast, by Application 2019 & 2032
- Table 55: Global Dark Analytics Industry Revenue Million Forecast, by Type of Analytics 2019 & 2032
- Table 56: Global Dark Analytics Industry Revenue Million Forecast, by End-user Vertical 2019 & 2032
- Table 57: Global Dark Analytics Industry Revenue Million Forecast, by Country 2019 & 2032
- Table 58: United Kingdom Dark Analytics Industry Revenue (Million) Forecast, by Application 2019 & 2032
- Table 59: Germany Dark Analytics Industry Revenue (Million) Forecast, by Application 2019 & 2032
- Table 60: Rest of Europe Dark Analytics Industry Revenue (Million) Forecast, by Application 2019 & 2032
- Table 61: Global Dark Analytics Industry Revenue Million Forecast, by Type of Analytics 2019 & 2032
- Table 62: Global Dark Analytics Industry Revenue Million Forecast, by End-user Vertical 2019 & 2032
- Table 63: Global Dark Analytics Industry Revenue Million Forecast, by Country 2019 & 2032
- Table 64: China Dark Analytics Industry Revenue (Million) Forecast, by Application 2019 & 2032
- Table 65: Japan Dark Analytics Industry Revenue (Million) Forecast, by Application 2019 & 2032
- Table 66: Australia Dark Analytics Industry Revenue (Million) Forecast, by Application 2019 & 2032
- Table 67: Rest of Asia Pacific Dark Analytics Industry Revenue (Million) Forecast, by Application 2019 & 2032
- Table 68: Global Dark Analytics Industry Revenue Million Forecast, by Type of Analytics 2019 & 2032
- Table 69: Global Dark Analytics Industry Revenue Million Forecast, by End-user Vertical 2019 & 2032
- Table 70: Global Dark Analytics Industry Revenue Million Forecast, by Country 2019 & 2032
- Table 71: Latin America Dark Analytics Industry Revenue (Million) Forecast, by Application 2019 & 2032
- Table 72: Middl East Dark Analytics Industry Revenue (Million) Forecast, by Application 2019 & 2032
Frequently Asked Questions
1. What is the projected Compound Annual Growth Rate (CAGR) of the Dark Analytics Industry?
The projected CAGR is approximately 24.90%.
2. Which companies are prominent players in the Dark Analytics Industry?
Key companies in the market include Micro Focus International PLC, IBM Corporation, Teradata Corporation, Microsoft Corporation, Amazon Web Services Inc, SAS Institute, Hewlett-Packard Enterprise Company, Oracle Corporation*List Not Exhaustive, SAP SE.
3. What are the main segments of the Dark Analytics Industry?
The market segments include Type of Analytics, End-user Vertical.
4. Can you provide details about the market size?
The market size is estimated to be USD XX Million as of 2022.
5. What are some drivers contributing to market growth?
Increasing Adoption Rates of Machine Learning and Artificial Intelligence; Rapid Growth in Generated Data Volume and Variety Owing to Adoption of IoT.
6. What are the notable trends driving market growth?
Retail and E-commerce to Hold Significant Growth.
7. Are there any restraints impacting market growth?
Security Concerns.
8. Can you provide examples of recent developments in the market?
November 2022: The hybrid data company, Cloudera, has introduced a program called the Cloudera Partner Network that pays and honors partners for their role in the firm's go-to-market performance. Customers participating in this program will become familiar with contemporary data techniques built on the Cloudera hybrid data platform. The participants will use cutting-edge solutions, including the easy-to-use Marketing Automation Platform and Asset Library.
9. What pricing options are available for accessing the report?
Pricing options include single-user, multi-user, and enterprise licenses priced at USD 4750, USD 5250, and USD 8750 respectively.
10. Is the market size provided in terms of value or volume?
The market size is provided in terms of value, measured in Million.
11. Are there any specific market keywords associated with the report?
Yes, the market keyword associated with the report is "Dark Analytics Industry," which aids in identifying and referencing the specific market segment covered.
12. How do I determine which pricing option suits my needs best?
The pricing options vary based on user requirements and access needs. Individual users may opt for single-user licenses, while businesses requiring broader access may choose multi-user or enterprise licenses for cost-effective access to the report.
13. Are there any additional resources or data provided in the Dark Analytics Industry report?
While the report offers comprehensive insights, it's advisable to review the specific contents or supplementary materials provided to ascertain if additional resources or data are available.
14. How can I stay updated on further developments or reports in the Dark Analytics Industry?
To stay informed about further developments, trends, and reports in the Dark Analytics Industry, consider subscribing to industry newsletters, following relevant companies and organizations, or regularly checking reputable industry news sources and publications.
Methodology
Step 1 - Identification of Relevant Samples Size from Population Database


Step 2 - Approaches for Defining Global Market Size (Value, Volume* & Price*)

Note*: In applicable scenarios
Step 3 - Data Sources
Primary Research
- Web Analytics
- Survey Reports
- Research Institute
- Latest Research Reports
- Opinion Leaders
Secondary Research
- Annual Reports
- White Paper
- Latest Press Release
- Industry Association
- Paid Database
- Investor Presentations

Step 4 - Data Triangulation
Involves using different sources of information in order to increase the validity of a study
These sources are likely to be stakeholders in a program - participants, other researchers, program staff, other community members, and so on.
Then we put all data in single framework & apply various statistical tools to find out the dynamic on the market.
During the analysis stage, feedback from the stakeholder groups would be compared to determine areas of agreement as well as areas of divergence


