
Key Insights
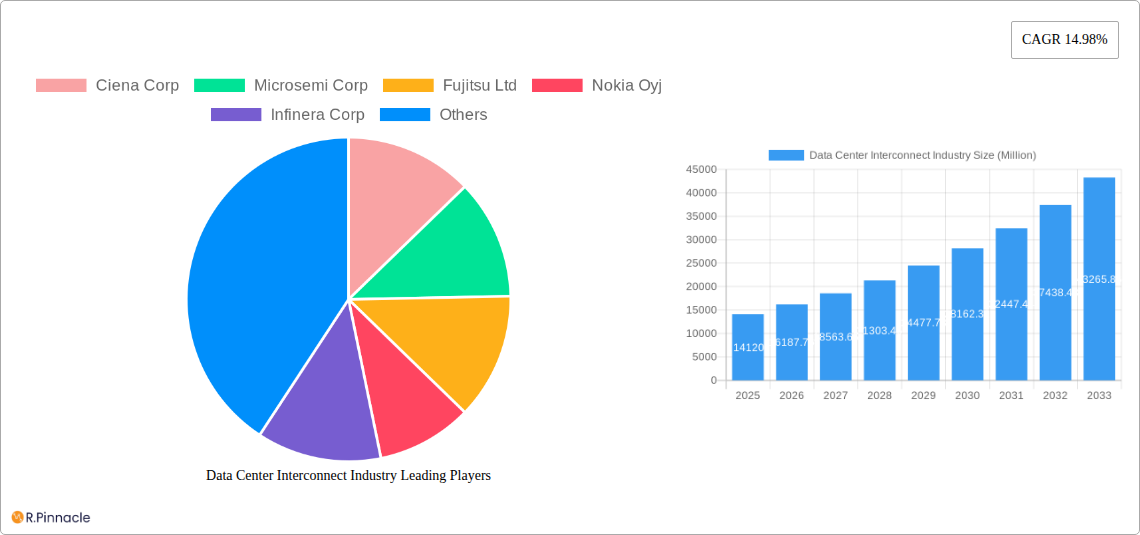
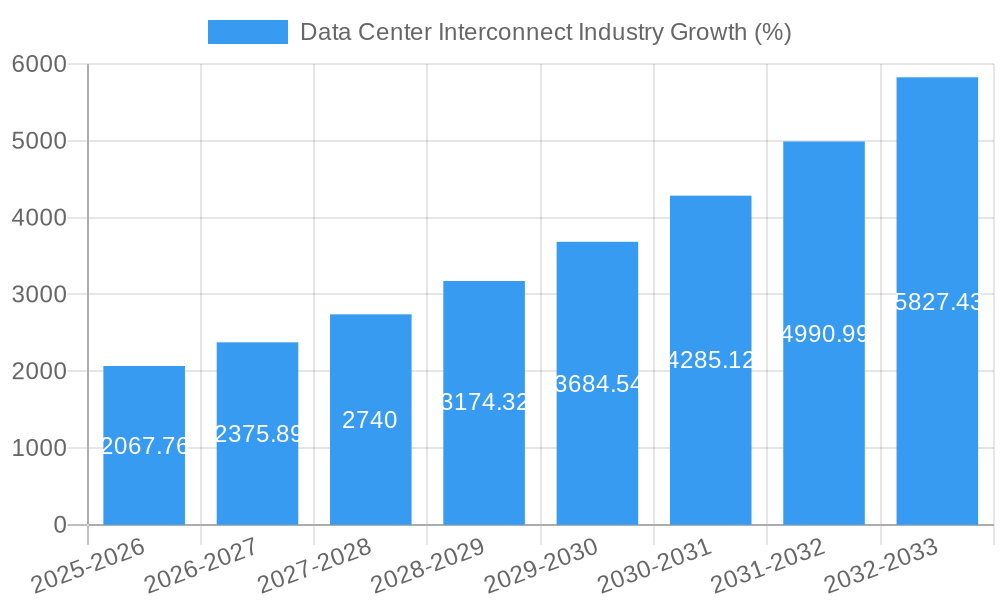
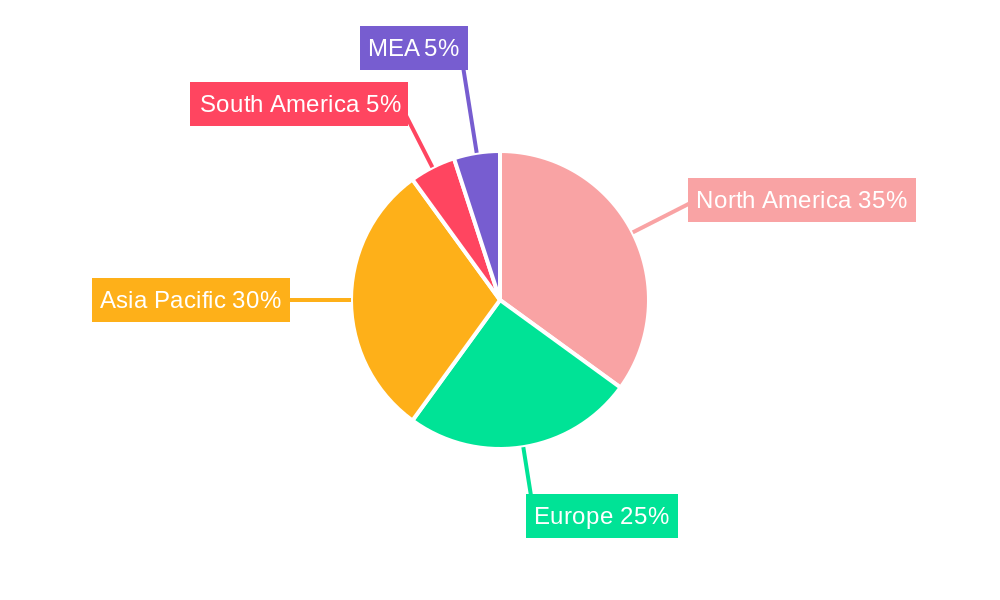
The Data Center Interconnect (DCI) market is experiencing robust growth, driven by the increasing demand for high-bandwidth, low-latency connectivity between data centers. This surge is fueled by the proliferation of cloud computing, the expansion of 5G networks, and the rise of edge computing, all of which necessitate seamless data exchange across geographically dispersed locations. The market, currently valued at $14.12 billion in 2025, is projected to expand at a Compound Annual Growth Rate (CAGR) of 14.98% from 2025 to 2033. Key application segments include disaster recovery and business continuity, shared data and resources, and data mobility, with substantial contributions from communications service providers (CSPs), internet content providers (ICPs/CNPs), and government/research and education sectors. Competitive landscape is dominated by established players like Ciena, Cisco, Juniper, and Huawei, alongside emerging technology providers focused on innovative solutions to meet the increasing demands of bandwidth and reliability. Regional growth is expected to be geographically diverse, with North America and Asia Pacific anticipated to be significant contributors due to high technology adoption rates and extensive data center infrastructure.
The growth trajectory of the DCI market is further reinforced by several industry trends. The adoption of software-defined networking (SDN) and network function virtualization (NFV) is streamlining network management and improving operational efficiency. Furthermore, the increasing adoption of high-bandwidth technologies such as 400G and 800G optics is enabling higher data transmission speeds. However, challenges such as high initial investment costs for infrastructure upgrades and the need for skilled professionals to manage complex network environments may pose some restraints. Nevertheless, the long-term outlook for the DCI market remains exceptionally positive, fueled by the ongoing digital transformation across industries and the relentless demand for faster, more reliable data connectivity. The forecast period (2025-2033) suggests a significant expansion of market value, driven primarily by the underlying technological advancements and growing adoption across diverse sectors.
Data Center Interconnect Industry Market Report: 2019-2033
This comprehensive report provides an in-depth analysis of the Data Center Interconnect industry, offering valuable insights for industry professionals, investors, and strategic decision-makers. The report covers market size, growth projections, key players, technological advancements, and emerging trends from 2019 to 2033, with a focus on the estimated year 2025. The study period spans 2019-2033, with a base year of 2025 and a forecast period of 2025-2033, encompassing the historical period of 2019-2024. The market is segmented by application (Disaster Recovery and Business Continuity, Shared Data and Resources, Data (Storage) Mobility, Other Applications) and end-user industry (Communications Service Providers (CSPs), Internet Content and Carrier-neutral Providers (ICPs/CNPs), Government/Research and Education (Government/R&E), Other End-user Verticals).
Data Center Interconnect Industry Market Structure & Innovation Trends
The Data Center Interconnect market is characterized by a moderately concentrated structure, with a few major players holding significant market share. While exact figures are proprietary to the full report, Ciena Corp, Cisco Systems Inc, Juniper Networks Inc, and Huawei Technologies Co Ltd are among the prominent companies influencing market dynamics. Innovation is driven by the increasing demand for high-bandwidth, low-latency connectivity to support cloud computing, big data analytics, and the Internet of Things (IoT). Regulatory frameworks, particularly around data sovereignty and cybersecurity, significantly impact market growth. Product substitutes, such as traditional leased lines, face increasing competition due to the cost-effectiveness and scalability of data center interconnect solutions. The market is witnessing significant M&A activity, with deal values exceeding xx Million in recent years, further consolidating market leadership. End-user demographics are shifting towards larger enterprises and hyperscale data center operators seeking more advanced and customized solutions.
- Market Concentration: Moderate, with a few dominant players.
- Innovation Drivers: Cloud computing, Big Data, IoT.
- Regulatory Frameworks: Data sovereignty, cybersecurity.
- M&A Activity: Deal values exceeding xx Million.
Data Center Interconnect Industry Market Dynamics & Trends
The Data Center Interconnect market is experiencing robust growth, driven by the exponential increase in data traffic and the adoption of cloud-based services. The Compound Annual Growth Rate (CAGR) during the forecast period (2025-2033) is projected to be xx%. Technological disruptions, such as the rise of Software-Defined Networking (SDN) and Network Function Virtualization (NFV), are transforming the industry landscape. Consumer preferences are shifting towards flexible, scalable, and cost-effective solutions, driving demand for managed services and cloud-based interconnect platforms. Competitive dynamics are intense, with established players and new entrants vying for market share through product innovation, strategic partnerships, and acquisitions. Market penetration in key regions is steadily increasing, with significant adoption across diverse sectors.
Dominant Regions & Segments in Data Center Interconnect Industry
The North American region currently holds a dominant position in the Data Center Interconnect market, driven by a high concentration of hyperscale data centers and a robust IT infrastructure. However, Asia-Pacific is projected to experience the fastest growth, fueled by rapid digital transformation and increasing investments in data center infrastructure.
By Application:
- Disaster Recovery and Business Continuity: High growth potential due to increasing awareness of business continuity risks.
- Shared Data and Resources: Significant market share driven by the need for efficient data sharing among geographically dispersed locations.
- Data (Storage) Mobility: Growing demand due to the increasing volume and velocity of data.
- Other Applications: This segment includes niche applications with moderate growth potential.
By End-user Industry:
- Communications Service Providers (CSPs): Largest market segment, driven by the need for high-capacity interconnections between network nodes.
- Internet Content and Carrier-neutral Providers (ICPs/CNPs): High growth driven by the increasing demand for low-latency connectivity.
- Government/Research and Education (Government/R&E): Moderate growth driven by government initiatives and research needs.
- Other End-user Verticals: This segment includes various industries with moderate growth potential.
Key Drivers:
- North America: Strong IT infrastructure, high concentration of data centers.
- Asia-Pacific: Rapid digital transformation, significant infrastructure investment.
- Europe: Growing adoption of cloud services and data center infrastructure.
Data Center Interconnect Industry Product Innovations
Recent product innovations focus on software-defined interconnection (SDI) platforms, which provide increased flexibility, scalability, and automation. These solutions offer improved performance, reduced costs, and enhanced security compared to traditional methods. The market is also witnessing the development of advanced optical technologies, such as coherent optical transmission systems, to support higher bandwidth requirements. These innovations align with the market's demand for increased agility and efficiency in data center connectivity.
Report Scope & Segmentation Analysis
This report provides a comprehensive analysis of the Data Center Interconnect market, segmented by application and end-user industry. Each segment's growth projections, market size, and competitive dynamics are analyzed in detail. The report forecasts significant growth across all segments, driven by factors such as increasing data traffic, cloud adoption, and digital transformation. Competitive dynamics are shaped by technological advancements, strategic partnerships, and mergers & acquisitions. The report presents detailed market sizing for each segment for the historical period, base year, and forecast period.
Key Drivers of Data Center Interconnect Industry Growth
Several factors drive the growth of the Data Center Interconnect industry. The increasing adoption of cloud computing and big data analytics necessitates high-bandwidth, low-latency connections between data centers. The proliferation of the Internet of Things (IoT) is generating massive amounts of data, further fueling demand for robust interconnection solutions. Government initiatives promoting digital infrastructure development in several regions are also contributing to market expansion. Technological advancements, such as Software-Defined Networking (SDN) and Network Function Virtualization (NFV), enhance efficiency and flexibility.
Challenges in the Data Center Interconnect Industry Sector
The Data Center Interconnect industry faces challenges, including the high cost of deploying and maintaining advanced optical infrastructure. Supply chain disruptions can impact the availability of critical components, hindering timely project completion. Intense competition among established players and new entrants creates pressure on pricing and profit margins. Regulatory compliance requirements and cybersecurity threats pose further operational complexities and costs. These factors collectively influence the market's growth trajectory.
Emerging Opportunities in Data Center Interconnect Industry
Emerging opportunities include the growth of edge computing, requiring distributed interconnection solutions. The adoption of 5G networks will increase the demand for high-capacity and low-latency connectivity. The development of new optical technologies will further enhance network capabilities. The expanding adoption of AI and Machine Learning will drive the need for robust interconnection to support data-intensive applications. These trends present significant growth avenues for the industry.
Leading Players in the Data Center Interconnect Industry Market
- Ciena Corp
- Microsemi Corp
- Fujitsu Ltd
- Nokia Oyj
- Infinera Corp
- Pluribus Networks Inc
- Cisco Systems Inc
- Juniper Networks Inc
- Huawei Technologies Co Ltd
- ADVA Optical Networking SE
Key Developments in Data Center Interconnect Industry
- June 2022: Cologix partnered with Console Connect, deploying its SDI platform, enhancing connectivity for Canadian customers. This strategic move expanded Cologix's interconnection ecosystem, benefiting from Console Connect's global reach and further solidifying its position as a key player in the North American market.
- November 2022: Equinix and VMware extended their partnership, launching VMware Cloud on Equinix Metal. This integrated solution provides a more efficient and cost-effective multi-cloud service, highlighting the increasing importance of hybrid and multi-cloud environments and the role of data center interconnection.
Future Outlook for Data Center Interconnect Industry Market
The Data Center Interconnect market is poised for continued growth, driven by the increasing demand for high-bandwidth, low-latency connectivity. Technological advancements, strategic partnerships, and increased investment in data center infrastructure will continue to shape market dynamics. The expansion of cloud computing, the growth of edge computing, and the proliferation of IoT devices will further fuel demand. The market is expected to witness a healthy growth trajectory, with opportunities for innovation and expansion in both developed and emerging markets.
Data Center Interconnect Industry Segmentation
-
1. Application
- 1.1. Disaster Recovery and Business Continuity
- 1.2. Shared Data and Resources
- 1.3. Data (Storage) Mobility
- 1.4. Other Applications
-
2. End-user Industry
- 2.1. Communications Service Providers (CSPs)
- 2.2. Internet
- 2.3. Government/Research and Education (Government/R&E)
- 2.4. Other End-user Verticals
Data Center Interconnect Industry Segmentation By Geography
- 1. North America
- 2. Europe
- 3. Asia Pacific
- 4. Rest of the World
Data Center Interconnect Industry REPORT HIGHLIGHTS
| Aspects | Details |
|---|---|
| Study Period | 2019-2033 |
| Base Year | 2024 |
| Estimated Year | 2025 |
| Forecast Period | 2025-2033 |
| Historical Period | 2019-2024 |
| Growth Rate | CAGR of 14.98% from 2019-2033 |
| Segmentation |
|
Table of Contents
- 1. Introduction
- 1.1. Research Scope
- 1.2. Market Segmentation
- 1.3. Research Methodology
- 1.4. Definitions and Assumptions
- 2. Executive Summary
- 2.1. Introduction
- 3. Market Dynamics
- 3.1. Introduction
- 3.2. Market Drivers
- 3.2.1 Increasing Number of Data Centers (Edge and Hyperscale); Increasing Need for Ultra- broadband
- 3.2.2 Simplified
- 3.2.3 and Intelligent DCI Networks due to Applications
- 3.2.4 like AI and HPC
- 3.3. Market Restrains
- 3.3.1. Complex Manufacturing Process
- 3.4. Market Trends
- 3.4.1. Increasing Number of Data Centers to Drive the Market Growth
- 4. Market Factor Analysis
- 4.1. Porters Five Forces
- 4.2. Supply/Value Chain
- 4.3. PESTEL analysis
- 4.4. Market Entropy
- 4.5. Patent/Trademark Analysis
- 5. Global Data Center Interconnect Industry Analysis, Insights and Forecast, 2019-2031
- 5.1. Market Analysis, Insights and Forecast - by Application
- 5.1.1. Disaster Recovery and Business Continuity
- 5.1.2. Shared Data and Resources
- 5.1.3. Data (Storage) Mobility
- 5.1.4. Other Applications
- 5.2. Market Analysis, Insights and Forecast - by End-user Industry
- 5.2.1. Communications Service Providers (CSPs)
- 5.2.2. Internet
- 5.2.3. Government/Research and Education (Government/R&E)
- 5.2.4. Other End-user Verticals
- 5.3. Market Analysis, Insights and Forecast - by Region
- 5.3.1. North America
- 5.3.2. Europe
- 5.3.3. Asia Pacific
- 5.3.4. Rest of the World
- 5.1. Market Analysis, Insights and Forecast - by Application
- 6. North America Data Center Interconnect Industry Analysis, Insights and Forecast, 2019-2031
- 6.1. Market Analysis, Insights and Forecast - by Application
- 6.1.1. Disaster Recovery and Business Continuity
- 6.1.2. Shared Data and Resources
- 6.1.3. Data (Storage) Mobility
- 6.1.4. Other Applications
- 6.2. Market Analysis, Insights and Forecast - by End-user Industry
- 6.2.1. Communications Service Providers (CSPs)
- 6.2.2. Internet
- 6.2.3. Government/Research and Education (Government/R&E)
- 6.2.4. Other End-user Verticals
- 6.1. Market Analysis, Insights and Forecast - by Application
- 7. Europe Data Center Interconnect Industry Analysis, Insights and Forecast, 2019-2031
- 7.1. Market Analysis, Insights and Forecast - by Application
- 7.1.1. Disaster Recovery and Business Continuity
- 7.1.2. Shared Data and Resources
- 7.1.3. Data (Storage) Mobility
- 7.1.4. Other Applications
- 7.2. Market Analysis, Insights and Forecast - by End-user Industry
- 7.2.1. Communications Service Providers (CSPs)
- 7.2.2. Internet
- 7.2.3. Government/Research and Education (Government/R&E)
- 7.2.4. Other End-user Verticals
- 7.1. Market Analysis, Insights and Forecast - by Application
- 8. Asia Pacific Data Center Interconnect Industry Analysis, Insights and Forecast, 2019-2031
- 8.1. Market Analysis, Insights and Forecast - by Application
- 8.1.1. Disaster Recovery and Business Continuity
- 8.1.2. Shared Data and Resources
- 8.1.3. Data (Storage) Mobility
- 8.1.4. Other Applications
- 8.2. Market Analysis, Insights and Forecast - by End-user Industry
- 8.2.1. Communications Service Providers (CSPs)
- 8.2.2. Internet
- 8.2.3. Government/Research and Education (Government/R&E)
- 8.2.4. Other End-user Verticals
- 8.1. Market Analysis, Insights and Forecast - by Application
- 9. Rest of the World Data Center Interconnect Industry Analysis, Insights and Forecast, 2019-2031
- 9.1. Market Analysis, Insights and Forecast - by Application
- 9.1.1. Disaster Recovery and Business Continuity
- 9.1.2. Shared Data and Resources
- 9.1.3. Data (Storage) Mobility
- 9.1.4. Other Applications
- 9.2. Market Analysis, Insights and Forecast - by End-user Industry
- 9.2.1. Communications Service Providers (CSPs)
- 9.2.2. Internet
- 9.2.3. Government/Research and Education (Government/R&E)
- 9.2.4. Other End-user Verticals
- 9.1. Market Analysis, Insights and Forecast - by Application
- 10. North America Data Center Interconnect Industry Analysis, Insights and Forecast, 2019-2031
- 10.1. Market Analysis, Insights and Forecast - By Country/Sub-region
- 10.1.1 United States
- 10.1.2 Canada
- 10.1.3 Mexico
- 11. Europe Data Center Interconnect Industry Analysis, Insights and Forecast, 2019-2031
- 11.1. Market Analysis, Insights and Forecast - By Country/Sub-region
- 11.1.1 Germany
- 11.1.2 United Kingdom
- 11.1.3 France
- 11.1.4 Spain
- 11.1.5 Italy
- 11.1.6 Spain
- 11.1.7 Belgium
- 11.1.8 Netherland
- 11.1.9 Nordics
- 11.1.10 Rest of Europe
- 12. Asia Pacific Data Center Interconnect Industry Analysis, Insights and Forecast, 2019-2031
- 12.1. Market Analysis, Insights and Forecast - By Country/Sub-region
- 12.1.1 China
- 12.1.2 Japan
- 12.1.3 India
- 12.1.4 South Korea
- 12.1.5 Southeast Asia
- 12.1.6 Australia
- 12.1.7 Indonesia
- 12.1.8 Phillipes
- 12.1.9 Singapore
- 12.1.10 Thailandc
- 12.1.11 Rest of Asia Pacific
- 13. South America Data Center Interconnect Industry Analysis, Insights and Forecast, 2019-2031
- 13.1. Market Analysis, Insights and Forecast - By Country/Sub-region
- 13.1.1 Brazil
- 13.1.2 Argentina
- 13.1.3 Peru
- 13.1.4 Chile
- 13.1.5 Colombia
- 13.1.6 Ecuador
- 13.1.7 Venezuela
- 13.1.8 Rest of South America
- 14. North America Data Center Interconnect Industry Analysis, Insights and Forecast, 2019-2031
- 14.1. Market Analysis, Insights and Forecast - By Country/Sub-region
- 14.1.1 United States
- 14.1.2 Canada
- 14.1.3 Mexico
- 15. MEA Data Center Interconnect Industry Analysis, Insights and Forecast, 2019-2031
- 15.1. Market Analysis, Insights and Forecast - By Country/Sub-region
- 15.1.1 United Arab Emirates
- 15.1.2 Saudi Arabia
- 15.1.3 South Africa
- 15.1.4 Rest of Middle East and Africa
- 16. Competitive Analysis
- 16.1. Global Market Share Analysis 2024
- 16.2. Company Profiles
- 16.2.1 Ciena Corp
- 16.2.1.1. Overview
- 16.2.1.2. Products
- 16.2.1.3. SWOT Analysis
- 16.2.1.4. Recent Developments
- 16.2.1.5. Financials (Based on Availability)
- 16.2.2 Microsemi Corp
- 16.2.2.1. Overview
- 16.2.2.2. Products
- 16.2.2.3. SWOT Analysis
- 16.2.2.4. Recent Developments
- 16.2.2.5. Financials (Based on Availability)
- 16.2.3 Fujitsu Ltd
- 16.2.3.1. Overview
- 16.2.3.2. Products
- 16.2.3.3. SWOT Analysis
- 16.2.3.4. Recent Developments
- 16.2.3.5. Financials (Based on Availability)
- 16.2.4 Nokia Oyj
- 16.2.4.1. Overview
- 16.2.4.2. Products
- 16.2.4.3. SWOT Analysis
- 16.2.4.4. Recent Developments
- 16.2.4.5. Financials (Based on Availability)
- 16.2.5 Infinera Corp
- 16.2.5.1. Overview
- 16.2.5.2. Products
- 16.2.5.3. SWOT Analysis
- 16.2.5.4. Recent Developments
- 16.2.5.5. Financials (Based on Availability)
- 16.2.6 Pluribus Networks Inc
- 16.2.6.1. Overview
- 16.2.6.2. Products
- 16.2.6.3. SWOT Analysis
- 16.2.6.4. Recent Developments
- 16.2.6.5. Financials (Based on Availability)
- 16.2.7 Cisco Systems Inc
- 16.2.7.1. Overview
- 16.2.7.2. Products
- 16.2.7.3. SWOT Analysis
- 16.2.7.4. Recent Developments
- 16.2.7.5. Financials (Based on Availability)
- 16.2.8 Juniper Networks Inc
- 16.2.8.1. Overview
- 16.2.8.2. Products
- 16.2.8.3. SWOT Analysis
- 16.2.8.4. Recent Developments
- 16.2.8.5. Financials (Based on Availability)
- 16.2.9 Huawei Technologies Co Ltd
- 16.2.9.1. Overview
- 16.2.9.2. Products
- 16.2.9.3. SWOT Analysis
- 16.2.9.4. Recent Developments
- 16.2.9.5. Financials (Based on Availability)
- 16.2.10 ADVA Optical Networking SE
- 16.2.10.1. Overview
- 16.2.10.2. Products
- 16.2.10.3. SWOT Analysis
- 16.2.10.4. Recent Developments
- 16.2.10.5. Financials (Based on Availability)
- 16.2.1 Ciena Corp
List of Figures
- Figure 1: Global Data Center Interconnect Industry Revenue Breakdown (Million, %) by Region 2024 & 2032
- Figure 2: North America Data Center Interconnect Industry Revenue (Million), by Country 2024 & 2032
- Figure 3: North America Data Center Interconnect Industry Revenue Share (%), by Country 2024 & 2032
- Figure 4: Europe Data Center Interconnect Industry Revenue (Million), by Country 2024 & 2032
- Figure 5: Europe Data Center Interconnect Industry Revenue Share (%), by Country 2024 & 2032
- Figure 6: Asia Pacific Data Center Interconnect Industry Revenue (Million), by Country 2024 & 2032
- Figure 7: Asia Pacific Data Center Interconnect Industry Revenue Share (%), by Country 2024 & 2032
- Figure 8: South America Data Center Interconnect Industry Revenue (Million), by Country 2024 & 2032
- Figure 9: South America Data Center Interconnect Industry Revenue Share (%), by Country 2024 & 2032
- Figure 10: North America Data Center Interconnect Industry Revenue (Million), by Country 2024 & 2032
- Figure 11: North America Data Center Interconnect Industry Revenue Share (%), by Country 2024 & 2032
- Figure 12: MEA Data Center Interconnect Industry Revenue (Million), by Country 2024 & 2032
- Figure 13: MEA Data Center Interconnect Industry Revenue Share (%), by Country 2024 & 2032
- Figure 14: North America Data Center Interconnect Industry Revenue (Million), by Application 2024 & 2032
- Figure 15: North America Data Center Interconnect Industry Revenue Share (%), by Application 2024 & 2032
- Figure 16: North America Data Center Interconnect Industry Revenue (Million), by End-user Industry 2024 & 2032
- Figure 17: North America Data Center Interconnect Industry Revenue Share (%), by End-user Industry 2024 & 2032
- Figure 18: North America Data Center Interconnect Industry Revenue (Million), by Country 2024 & 2032
- Figure 19: North America Data Center Interconnect Industry Revenue Share (%), by Country 2024 & 2032
- Figure 20: Europe Data Center Interconnect Industry Revenue (Million), by Application 2024 & 2032
- Figure 21: Europe Data Center Interconnect Industry Revenue Share (%), by Application 2024 & 2032
- Figure 22: Europe Data Center Interconnect Industry Revenue (Million), by End-user Industry 2024 & 2032
- Figure 23: Europe Data Center Interconnect Industry Revenue Share (%), by End-user Industry 2024 & 2032
- Figure 24: Europe Data Center Interconnect Industry Revenue (Million), by Country 2024 & 2032
- Figure 25: Europe Data Center Interconnect Industry Revenue Share (%), by Country 2024 & 2032
- Figure 26: Asia Pacific Data Center Interconnect Industry Revenue (Million), by Application 2024 & 2032
- Figure 27: Asia Pacific Data Center Interconnect Industry Revenue Share (%), by Application 2024 & 2032
- Figure 28: Asia Pacific Data Center Interconnect Industry Revenue (Million), by End-user Industry 2024 & 2032
- Figure 29: Asia Pacific Data Center Interconnect Industry Revenue Share (%), by End-user Industry 2024 & 2032
- Figure 30: Asia Pacific Data Center Interconnect Industry Revenue (Million), by Country 2024 & 2032
- Figure 31: Asia Pacific Data Center Interconnect Industry Revenue Share (%), by Country 2024 & 2032
- Figure 32: Rest of the World Data Center Interconnect Industry Revenue (Million), by Application 2024 & 2032
- Figure 33: Rest of the World Data Center Interconnect Industry Revenue Share (%), by Application 2024 & 2032
- Figure 34: Rest of the World Data Center Interconnect Industry Revenue (Million), by End-user Industry 2024 & 2032
- Figure 35: Rest of the World Data Center Interconnect Industry Revenue Share (%), by End-user Industry 2024 & 2032
- Figure 36: Rest of the World Data Center Interconnect Industry Revenue (Million), by Country 2024 & 2032
- Figure 37: Rest of the World Data Center Interconnect Industry Revenue Share (%), by Country 2024 & 2032
List of Tables
- Table 1: Global Data Center Interconnect Industry Revenue Million Forecast, by Region 2019 & 2032
- Table 2: Global Data Center Interconnect Industry Revenue Million Forecast, by Application 2019 & 2032
- Table 3: Global Data Center Interconnect Industry Revenue Million Forecast, by End-user Industry 2019 & 2032
- Table 4: Global Data Center Interconnect Industry Revenue Million Forecast, by Region 2019 & 2032
- Table 5: Global Data Center Interconnect Industry Revenue Million Forecast, by Country 2019 & 2032
- Table 6: United States Data Center Interconnect Industry Revenue (Million) Forecast, by Application 2019 & 2032
- Table 7: Canada Data Center Interconnect Industry Revenue (Million) Forecast, by Application 2019 & 2032
- Table 8: Mexico Data Center Interconnect Industry Revenue (Million) Forecast, by Application 2019 & 2032
- Table 9: Global Data Center Interconnect Industry Revenue Million Forecast, by Country 2019 & 2032
- Table 10: Germany Data Center Interconnect Industry Revenue (Million) Forecast, by Application 2019 & 2032
- Table 11: United Kingdom Data Center Interconnect Industry Revenue (Million) Forecast, by Application 2019 & 2032
- Table 12: France Data Center Interconnect Industry Revenue (Million) Forecast, by Application 2019 & 2032
- Table 13: Spain Data Center Interconnect Industry Revenue (Million) Forecast, by Application 2019 & 2032
- Table 14: Italy Data Center Interconnect Industry Revenue (Million) Forecast, by Application 2019 & 2032
- Table 15: Spain Data Center Interconnect Industry Revenue (Million) Forecast, by Application 2019 & 2032
- Table 16: Belgium Data Center Interconnect Industry Revenue (Million) Forecast, by Application 2019 & 2032
- Table 17: Netherland Data Center Interconnect Industry Revenue (Million) Forecast, by Application 2019 & 2032
- Table 18: Nordics Data Center Interconnect Industry Revenue (Million) Forecast, by Application 2019 & 2032
- Table 19: Rest of Europe Data Center Interconnect Industry Revenue (Million) Forecast, by Application 2019 & 2032
- Table 20: Global Data Center Interconnect Industry Revenue Million Forecast, by Country 2019 & 2032
- Table 21: China Data Center Interconnect Industry Revenue (Million) Forecast, by Application 2019 & 2032
- Table 22: Japan Data Center Interconnect Industry Revenue (Million) Forecast, by Application 2019 & 2032
- Table 23: India Data Center Interconnect Industry Revenue (Million) Forecast, by Application 2019 & 2032
- Table 24: South Korea Data Center Interconnect Industry Revenue (Million) Forecast, by Application 2019 & 2032
- Table 25: Southeast Asia Data Center Interconnect Industry Revenue (Million) Forecast, by Application 2019 & 2032
- Table 26: Australia Data Center Interconnect Industry Revenue (Million) Forecast, by Application 2019 & 2032
- Table 27: Indonesia Data Center Interconnect Industry Revenue (Million) Forecast, by Application 2019 & 2032
- Table 28: Phillipes Data Center Interconnect Industry Revenue (Million) Forecast, by Application 2019 & 2032
- Table 29: Singapore Data Center Interconnect Industry Revenue (Million) Forecast, by Application 2019 & 2032
- Table 30: Thailandc Data Center Interconnect Industry Revenue (Million) Forecast, by Application 2019 & 2032
- Table 31: Rest of Asia Pacific Data Center Interconnect Industry Revenue (Million) Forecast, by Application 2019 & 2032
- Table 32: Global Data Center Interconnect Industry Revenue Million Forecast, by Country 2019 & 2032
- Table 33: Brazil Data Center Interconnect Industry Revenue (Million) Forecast, by Application 2019 & 2032
- Table 34: Argentina Data Center Interconnect Industry Revenue (Million) Forecast, by Application 2019 & 2032
- Table 35: Peru Data Center Interconnect Industry Revenue (Million) Forecast, by Application 2019 & 2032
- Table 36: Chile Data Center Interconnect Industry Revenue (Million) Forecast, by Application 2019 & 2032
- Table 37: Colombia Data Center Interconnect Industry Revenue (Million) Forecast, by Application 2019 & 2032
- Table 38: Ecuador Data Center Interconnect Industry Revenue (Million) Forecast, by Application 2019 & 2032
- Table 39: Venezuela Data Center Interconnect Industry Revenue (Million) Forecast, by Application 2019 & 2032
- Table 40: Rest of South America Data Center Interconnect Industry Revenue (Million) Forecast, by Application 2019 & 2032
- Table 41: Global Data Center Interconnect Industry Revenue Million Forecast, by Country 2019 & 2032
- Table 42: United States Data Center Interconnect Industry Revenue (Million) Forecast, by Application 2019 & 2032
- Table 43: Canada Data Center Interconnect Industry Revenue (Million) Forecast, by Application 2019 & 2032
- Table 44: Mexico Data Center Interconnect Industry Revenue (Million) Forecast, by Application 2019 & 2032
- Table 45: Global Data Center Interconnect Industry Revenue Million Forecast, by Country 2019 & 2032
- Table 46: United Arab Emirates Data Center Interconnect Industry Revenue (Million) Forecast, by Application 2019 & 2032
- Table 47: Saudi Arabia Data Center Interconnect Industry Revenue (Million) Forecast, by Application 2019 & 2032
- Table 48: South Africa Data Center Interconnect Industry Revenue (Million) Forecast, by Application 2019 & 2032
- Table 49: Rest of Middle East and Africa Data Center Interconnect Industry Revenue (Million) Forecast, by Application 2019 & 2032
- Table 50: Global Data Center Interconnect Industry Revenue Million Forecast, by Application 2019 & 2032
- Table 51: Global Data Center Interconnect Industry Revenue Million Forecast, by End-user Industry 2019 & 2032
- Table 52: Global Data Center Interconnect Industry Revenue Million Forecast, by Country 2019 & 2032
- Table 53: Global Data Center Interconnect Industry Revenue Million Forecast, by Application 2019 & 2032
- Table 54: Global Data Center Interconnect Industry Revenue Million Forecast, by End-user Industry 2019 & 2032
- Table 55: Global Data Center Interconnect Industry Revenue Million Forecast, by Country 2019 & 2032
- Table 56: Global Data Center Interconnect Industry Revenue Million Forecast, by Application 2019 & 2032
- Table 57: Global Data Center Interconnect Industry Revenue Million Forecast, by End-user Industry 2019 & 2032
- Table 58: Global Data Center Interconnect Industry Revenue Million Forecast, by Country 2019 & 2032
- Table 59: Global Data Center Interconnect Industry Revenue Million Forecast, by Application 2019 & 2032
- Table 60: Global Data Center Interconnect Industry Revenue Million Forecast, by End-user Industry 2019 & 2032
- Table 61: Global Data Center Interconnect Industry Revenue Million Forecast, by Country 2019 & 2032
Frequently Asked Questions
1. What is the projected Compound Annual Growth Rate (CAGR) of the Data Center Interconnect Industry?
The projected CAGR is approximately 14.98%.
2. Which companies are prominent players in the Data Center Interconnect Industry?
Key companies in the market include Ciena Corp, Microsemi Corp, Fujitsu Ltd, Nokia Oyj, Infinera Corp, Pluribus Networks Inc, Cisco Systems Inc, Juniper Networks Inc, Huawei Technologies Co Ltd, ADVA Optical Networking SE.
3. What are the main segments of the Data Center Interconnect Industry?
The market segments include Application, End-user Industry.
4. Can you provide details about the market size?
The market size is estimated to be USD 14.12 Million as of 2022.
5. What are some drivers contributing to market growth?
Increasing Number of Data Centers (Edge and Hyperscale); Increasing Need for Ultra- broadband. Simplified. and Intelligent DCI Networks due to Applications. like AI and HPC.
6. What are the notable trends driving market growth?
Increasing Number of Data Centers to Drive the Market Growth.
7. Are there any restraints impacting market growth?
Complex Manufacturing Process.
8. Can you provide examples of recent developments in the market?
June 2022: Cologix, one of North America's leading network-neutral interconnection and hyperscale edge data center providers, announced that it had extended its strategic partnership with Console Connect by PCCW Global by deploying the Console Connect Software-Defined Interconnection platform at its TOR1 data center in Toronto. Cologix, in conjunction with Console Connect, now provides Canadian customers with extra fast and reliable digital edge linkages to connect with their customers, partners, and workers globally. Furthermore, Cologix offers clients choice and flexibility through an interconnection ecosystem of 600+ networks, 300+ cloud providers, and 30+ onramps across the United States and Canada. Cologix is looking forward to future business opportunities with Console Connect.
9. What pricing options are available for accessing the report?
Pricing options include single-user, multi-user, and enterprise licenses priced at USD 4750, USD 5250, and USD 8750 respectively.
10. Is the market size provided in terms of value or volume?
The market size is provided in terms of value, measured in Million.
11. Are there any specific market keywords associated with the report?
Yes, the market keyword associated with the report is "Data Center Interconnect Industry," which aids in identifying and referencing the specific market segment covered.
12. How do I determine which pricing option suits my needs best?
The pricing options vary based on user requirements and access needs. Individual users may opt for single-user licenses, while businesses requiring broader access may choose multi-user or enterprise licenses for cost-effective access to the report.
13. Are there any additional resources or data provided in the Data Center Interconnect Industry report?
While the report offers comprehensive insights, it's advisable to review the specific contents or supplementary materials provided to ascertain if additional resources or data are available.
14. How can I stay updated on further developments or reports in the Data Center Interconnect Industry?
To stay informed about further developments, trends, and reports in the Data Center Interconnect Industry, consider subscribing to industry newsletters, following relevant companies and organizations, or regularly checking reputable industry news sources and publications.
Methodology
Step 1 - Identification of Relevant Samples Size from Population Database


Step 2 - Approaches for Defining Global Market Size (Value, Volume* & Price*)

Note*: In applicable scenarios
Step 3 - Data Sources
Primary Research
- Web Analytics
- Survey Reports
- Research Institute
- Latest Research Reports
- Opinion Leaders
Secondary Research
- Annual Reports
- White Paper
- Latest Press Release
- Industry Association
- Paid Database
- Investor Presentations

Step 4 - Data Triangulation
Involves using different sources of information in order to increase the validity of a study
These sources are likely to be stakeholders in a program - participants, other researchers, program staff, other community members, and so on.
Then we put all data in single framework & apply various statistical tools to find out the dynamic on the market.
During the analysis stage, feedback from the stakeholder groups would be compared to determine areas of agreement as well as areas of divergence


