
Key Insights
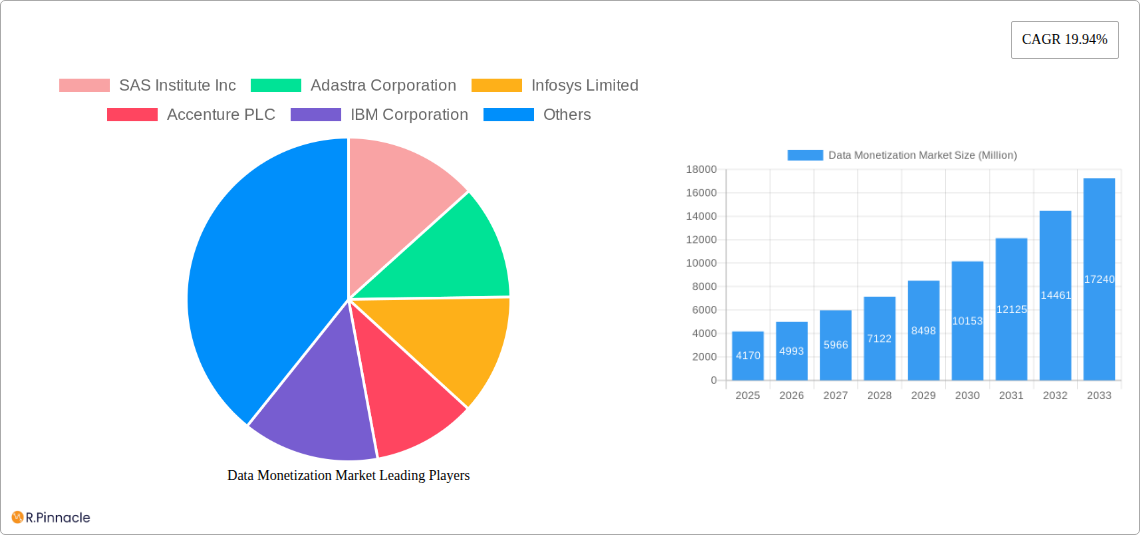
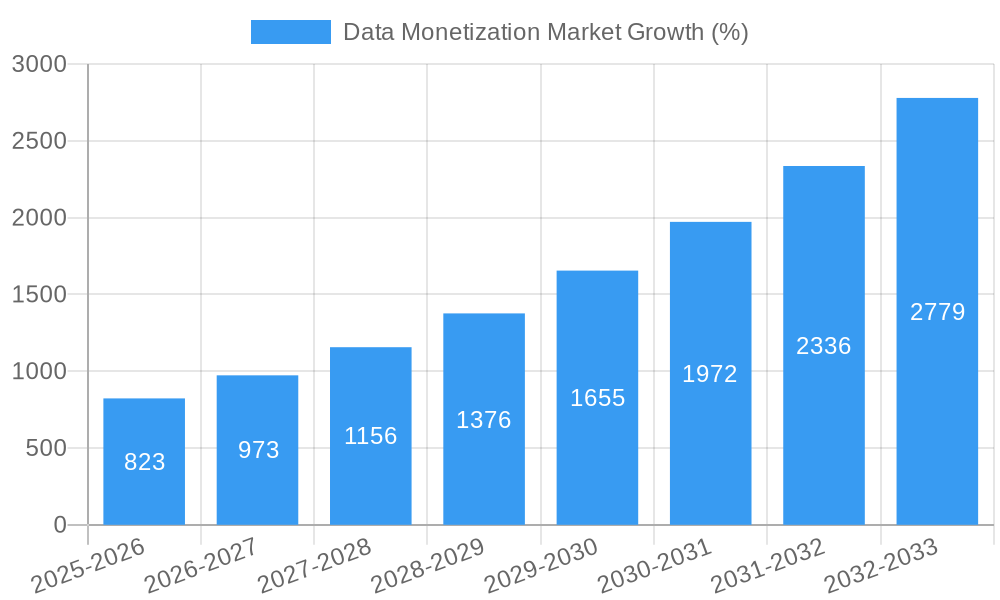
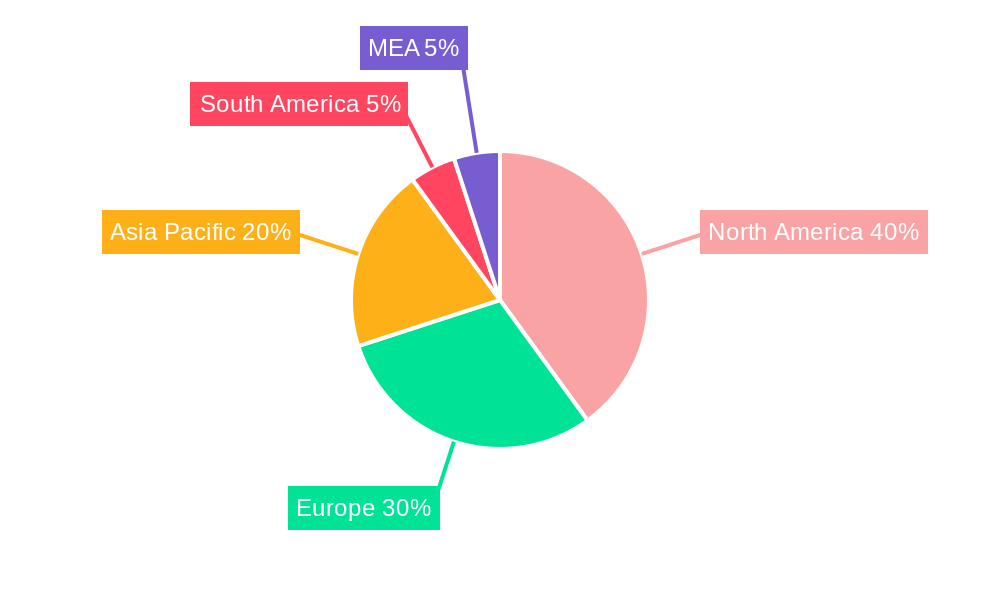
The global data monetization market is experiencing robust growth, projected to reach \$4.17 billion in 2025 and maintain a Compound Annual Growth Rate (CAGR) of 19.94% from 2025 to 2033. This expansion is driven by several key factors. The increasing volume and variety of data generated across diverse industries, coupled with advancements in data analytics and artificial intelligence (AI), are enabling organizations to extract valuable insights and generate revenue streams from their data assets. Furthermore, the growing adoption of cloud computing and the development of robust data security and privacy regulations are fostering a more conducive environment for data monetization initiatives. Key industry segments driving this growth include BFSI (Banking, Financial Services, and Insurance), Telecom and IT, and Manufacturing, which are leveraging data monetization to improve operational efficiency, enhance customer experiences, and develop new revenue models. The market is characterized by a competitive landscape with a mix of established players like SAS Institute Inc. and IBM Corporation, along with emerging technology providers. Geographical growth is expected to be particularly strong in North America and Asia Pacific, reflecting the high concentration of data-intensive businesses and advanced technological infrastructure in these regions.
The sustained growth trajectory of the data monetization market is anticipated to continue through 2033, fueled by further technological advancements, increasing digitalization across industries, and the expanding adoption of data-driven business strategies. However, challenges remain, including concerns surrounding data privacy and security, the complexity of data management and integration, and the need for skilled professionals to effectively analyze and monetize data. Addressing these challenges will be crucial to unlocking the full potential of the data monetization market and ensuring its continued, sustainable growth. The emergence of innovative data monetization models, such as data marketplaces and data-as-a-service platforms, is expected to further contribute to the market's evolution.
This comprehensive report provides an in-depth analysis of the Data Monetization Market, offering actionable insights for industry professionals, investors, and strategists. With a study period spanning 2019-2033, a base year of 2025, and a forecast period of 2025-2033, this report leverages robust data and expert analysis to illuminate the market's current state and future trajectory. The report's value is enhanced by a focus on key players, including SAS Institute Inc, Adastra Corporation, Infosys Limited, and more, as well as a detailed segmentation analysis by organization size and end-user industry.
Data Monetization Market Structure & Innovation Trends
This section analyzes the competitive landscape, including market concentration, innovation drivers, and regulatory influences within the data monetization market. We explore the impact of mergers and acquisitions (M&A) activity, examining deal values and their influence on market share. The analysis considers substitute products, end-user demographics, and the evolving regulatory frameworks shaping the industry. The current market is moderately concentrated, with a few major players holding significant market share, estimated at xx%. However, the market is witnessing increased fragmentation due to the entry of smaller, niche players. Recent M&A activity shows a total deal value of approximately xx Million USD in the last 2 years, indicating consolidation and growth.
- Market Concentration: Moderately concentrated, with top players holding xx% market share.
- Innovation Drivers: Advancements in AI, Big Data analytics, and cloud technologies.
- Regulatory Frameworks: GDPR, CCPA, and other data privacy regulations significantly impact market dynamics.
- Product Substitutes: Limited direct substitutes, but alternative data-driven business models present indirect competition.
- End-User Demographics: Large Enterprises currently dominate, but SMEs are showing increased adoption.
- M&A Activity: XX Million USD in deal value over the past two years, indicating consolidation trends.
Data Monetization Market Dynamics & Trends
This section delves into the market's growth trajectory, examining key drivers, technological disruptions, evolving consumer preferences, and competitive pressures. We project a Compound Annual Growth Rate (CAGR) of xx% during the forecast period (2025-2033), driven by increasing data volumes, growing demand for personalized services, and the adoption of advanced analytics. Market penetration is expected to reach xx% by 2033. The rise of AI and machine learning is transforming data monetization strategies, while evolving privacy regulations continue to present both challenges and opportunities. The competitive landscape is characterized by intense rivalry, with companies focusing on innovation, strategic partnerships, and acquisitions to gain a competitive edge.
Dominant Regions & Segments in Data Monetization Market
This section identifies the leading regions, countries, and market segments within the data monetization market. By organization size, Large Enterprises currently dominate due to their greater data volumes and resources, contributing to approximately xx% of market value. The BFSI (Banking, Financial Services, and Insurance) sector is the leading end-user industry, driven by stringent regulatory compliance requirements and a high volume of transactional data, representing an estimated xx% of market share. North America is projected to maintain its dominance throughout the forecast period, fueled by robust technological advancements and a strong regulatory landscape.
By Organization Size:
- Large Enterprises: Dominating market share due to resources and data volume.
- Small and Medium-sized Enterprises (SMEs): Growing adoption, but facing challenges in data infrastructure.
By End-user Industry:
- BFSI: Leading segment due to data volume and regulatory requirements.
- Telecom and IT: Significant growth driven by network data and customer analytics.
- Manufacturing: Increasing adoption for process optimization and predictive maintenance.
- Healthcare: Growth driven by the need for personalized medicine and data security.
- Retail: Growing market driven by personalized marketing and customer loyalty programs.
- Other End-user Industries: Diverse applications with gradual market penetration.
Key Drivers (Regional):
- North America: Strong technological infrastructure and regulatory environment.
- Europe: Growing regulatory compliance needs (GDPR) are driving data monetization adoption.
- Asia-Pacific: Rapid technological advancements and increasing data volumes.
Data Monetization Market Product Innovations
Recent advancements in data anonymization techniques, advanced analytics platforms, and AI-powered data valuation tools are driving market innovation. These innovations enable businesses to extract greater value from their data while adhering to privacy regulations. The market is witnessing the emergence of specialized platforms for data exchange and monetization, fostering collaboration and transparency. This fosters market fit by reducing friction in the data-trading ecosystem and streamlining the monetization process for various industries.
Report Scope & Segmentation Analysis
This report provides a comprehensive analysis of the Data Monetization Market, segmented by organization size (Small and Medium-sized Enterprises and Large Enterprises) and end-user industry (BFSI, Telecom and IT, Manufacturing, Healthcare, Retail, and Other End-user Industries). Growth projections, market sizes, and competitive dynamics are analyzed for each segment. The detailed segmentation allows for targeted strategies in relation to varying industry needs and technological maturity.
Key Drivers of Data Monetization Market Growth
The market is fueled by factors including the exponential growth of data, the increasing demand for data-driven insights, advancements in AI and machine learning technologies, and the growing adoption of cloud computing. Stringent data privacy regulations, while posing challenges, also drive the demand for secure and compliant data monetization solutions. The rising need for personalized customer experiences across various sectors further boosts the market.
Challenges in the Data Monetization Market Sector
Key challenges include the complexities of data privacy regulations, concerns regarding data security and breaches, and the difficulty in establishing fair data valuation models. The lack of standardization in data formats and the interoperability issues among different platforms also hinder market growth. These challenges translate into increased operational costs and potential risks to data-driven business models.
Emerging Opportunities in Data Monetization Market
Emerging opportunities lie in the development of innovative data monetization platforms, the integration of AI and blockchain technologies for secure data exchange, and the expansion into new industries with high data volumes. The increasing demand for data-driven decision-making across various sectors will further fuel market growth. The focus on responsible and ethical data usage also presents significant opportunities.
Leading Players in the Data Monetization Market Market
- SAS Institute Inc (SAS Institute Inc)
- Adastra Corporation
- Infosys Limited (Infosys Limited)
- Accenture PLC (Accenture PLC)
- IBM Corporation (IBM Corporation)
- NetScout Systems Inc (NetScout Systems Inc)
- Dawex Systems SAS
- Ness Technologies Inc
- Google LLC (Alphabet Inc ) (Google LLC)
- Thales Group (Thales Group)
- Cisco Systems Inc (Cisco Systems Inc)
- Openwave Mobility Inc (ENEA)
- SAP SE (SAP SE)
- Emu Analytics Ltd
Key Developments in Data Monetization Market Industry
- April 2024: Carv raised USD 10 Million in Series A funding, highlighting the growing investment in user-centric data monetization platforms. This signifies a shift towards empowering individuals with data ownership and control.
- February 2024: Tecnotree's partnership with BytePlus showcases the potential of AI and API monetization strategies within the B2B2X digital ecosystem. This collaboration points towards innovative monetization models in the telecom sector.
Future Outlook for Data Monetization Market Market
The Data Monetization Market is poised for significant growth, driven by technological advancements, increasing data volumes, and evolving business models. Strategic partnerships, acquisitions, and investments in innovative technologies will shape the market landscape. The focus on responsible data governance and ethical data practices will become increasingly important in shaping the future of this dynamic market.
Data Monetization Market Segmentation
-
1. Organization Size
- 1.1. Small and Medium-sized Enterprises
- 1.2. Large Enterprises
-
2. End-user Industry
- 2.1. BFSI
- 2.2. Telecom and IT
- 2.3. Manufacturing
- 2.4. Healthcare
- 2.5. Retail
- 2.6. Other End-user Industries
Data Monetization Market Segmentation By Geography
- 1. North America
- 2. Europe
- 3. Asia
- 4. Australia and New Zealand
- 5. Latin America
- 6. Middle East and Africa
Data Monetization Market REPORT HIGHLIGHTS
| Aspects | Details |
|---|---|
| Study Period | 2019-2033 |
| Base Year | 2024 |
| Estimated Year | 2025 |
| Forecast Period | 2025-2033 |
| Historical Period | 2019-2024 |
| Growth Rate | CAGR of 19.94% from 2019-2033 |
| Segmentation |
|
Table of Contents
- 1. Introduction
- 1.1. Research Scope
- 1.2. Market Segmentation
- 1.3. Research Methodology
- 1.4. Definitions and Assumptions
- 2. Executive Summary
- 2.1. Introduction
- 3. Market Dynamics
- 3.1. Introduction
- 3.2. Market Drivers
- 3.2.1. Rapid Adoption of Advanced Analytics and Visualization; Increasing Volume and Variety of Business Data
- 3.3. Market Restrains
- 3.3.1. Interoperability With Existing Systems; Varying Structure of Regulatory Policies
- 3.4. Market Trends
- 3.4.1. Large Enterprises to Hold Major Market Share
- 4. Market Factor Analysis
- 4.1. Porters Five Forces
- 4.2. Supply/Value Chain
- 4.3. PESTEL analysis
- 4.4. Market Entropy
- 4.5. Patent/Trademark Analysis
- 5. Global Data Monetization Market Analysis, Insights and Forecast, 2019-2031
- 5.1. Market Analysis, Insights and Forecast - by Organization Size
- 5.1.1. Small and Medium-sized Enterprises
- 5.1.2. Large Enterprises
- 5.2. Market Analysis, Insights and Forecast - by End-user Industry
- 5.2.1. BFSI
- 5.2.2. Telecom and IT
- 5.2.3. Manufacturing
- 5.2.4. Healthcare
- 5.2.5. Retail
- 5.2.6. Other End-user Industries
- 5.3. Market Analysis, Insights and Forecast - by Region
- 5.3.1. North America
- 5.3.2. Europe
- 5.3.3. Asia
- 5.3.4. Australia and New Zealand
- 5.3.5. Latin America
- 5.3.6. Middle East and Africa
- 5.1. Market Analysis, Insights and Forecast - by Organization Size
- 6. North America Data Monetization Market Analysis, Insights and Forecast, 2019-2031
- 6.1. Market Analysis, Insights and Forecast - by Organization Size
- 6.1.1. Small and Medium-sized Enterprises
- 6.1.2. Large Enterprises
- 6.2. Market Analysis, Insights and Forecast - by End-user Industry
- 6.2.1. BFSI
- 6.2.2. Telecom and IT
- 6.2.3. Manufacturing
- 6.2.4. Healthcare
- 6.2.5. Retail
- 6.2.6. Other End-user Industries
- 6.1. Market Analysis, Insights and Forecast - by Organization Size
- 7. Europe Data Monetization Market Analysis, Insights and Forecast, 2019-2031
- 7.1. Market Analysis, Insights and Forecast - by Organization Size
- 7.1.1. Small and Medium-sized Enterprises
- 7.1.2. Large Enterprises
- 7.2. Market Analysis, Insights and Forecast - by End-user Industry
- 7.2.1. BFSI
- 7.2.2. Telecom and IT
- 7.2.3. Manufacturing
- 7.2.4. Healthcare
- 7.2.5. Retail
- 7.2.6. Other End-user Industries
- 7.1. Market Analysis, Insights and Forecast - by Organization Size
- 8. Asia Data Monetization Market Analysis, Insights and Forecast, 2019-2031
- 8.1. Market Analysis, Insights and Forecast - by Organization Size
- 8.1.1. Small and Medium-sized Enterprises
- 8.1.2. Large Enterprises
- 8.2. Market Analysis, Insights and Forecast - by End-user Industry
- 8.2.1. BFSI
- 8.2.2. Telecom and IT
- 8.2.3. Manufacturing
- 8.2.4. Healthcare
- 8.2.5. Retail
- 8.2.6. Other End-user Industries
- 8.1. Market Analysis, Insights and Forecast - by Organization Size
- 9. Australia and New Zealand Data Monetization Market Analysis, Insights and Forecast, 2019-2031
- 9.1. Market Analysis, Insights and Forecast - by Organization Size
- 9.1.1. Small and Medium-sized Enterprises
- 9.1.2. Large Enterprises
- 9.2. Market Analysis, Insights and Forecast - by End-user Industry
- 9.2.1. BFSI
- 9.2.2. Telecom and IT
- 9.2.3. Manufacturing
- 9.2.4. Healthcare
- 9.2.5. Retail
- 9.2.6. Other End-user Industries
- 9.1. Market Analysis, Insights and Forecast - by Organization Size
- 10. Latin America Data Monetization Market Analysis, Insights and Forecast, 2019-2031
- 10.1. Market Analysis, Insights and Forecast - by Organization Size
- 10.1.1. Small and Medium-sized Enterprises
- 10.1.2. Large Enterprises
- 10.2. Market Analysis, Insights and Forecast - by End-user Industry
- 10.2.1. BFSI
- 10.2.2. Telecom and IT
- 10.2.3. Manufacturing
- 10.2.4. Healthcare
- 10.2.5. Retail
- 10.2.6. Other End-user Industries
- 10.1. Market Analysis, Insights and Forecast - by Organization Size
- 11. Middle East and Africa Data Monetization Market Analysis, Insights and Forecast, 2019-2031
- 11.1. Market Analysis, Insights and Forecast - by Organization Size
- 11.1.1. Small and Medium-sized Enterprises
- 11.1.2. Large Enterprises
- 11.2. Market Analysis, Insights and Forecast - by End-user Industry
- 11.2.1. BFSI
- 11.2.2. Telecom and IT
- 11.2.3. Manufacturing
- 11.2.4. Healthcare
- 11.2.5. Retail
- 11.2.6. Other End-user Industries
- 11.1. Market Analysis, Insights and Forecast - by Organization Size
- 12. North America Data Monetization Market Analysis, Insights and Forecast, 2019-2031
- 12.1. Market Analysis, Insights and Forecast - By Country/Sub-region
- 12.1.1 United States
- 12.1.2 Canada
- 12.1.3 Mexico
- 13. Europe Data Monetization Market Analysis, Insights and Forecast, 2019-2031
- 13.1. Market Analysis, Insights and Forecast - By Country/Sub-region
- 13.1.1 Germany
- 13.1.2 United Kingdom
- 13.1.3 France
- 13.1.4 Spain
- 13.1.5 Italy
- 13.1.6 Spain
- 13.1.7 Belgium
- 13.1.8 Netherland
- 13.1.9 Nordics
- 13.1.10 Rest of Europe
- 14. Asia Pacific Data Monetization Market Analysis, Insights and Forecast, 2019-2031
- 14.1. Market Analysis, Insights and Forecast - By Country/Sub-region
- 14.1.1 China
- 14.1.2 Japan
- 14.1.3 India
- 14.1.4 South Korea
- 14.1.5 Southeast Asia
- 14.1.6 Australia
- 14.1.7 Indonesia
- 14.1.8 Phillipes
- 14.1.9 Singapore
- 14.1.10 Thailandc
- 14.1.11 Rest of Asia Pacific
- 15. South America Data Monetization Market Analysis, Insights and Forecast, 2019-2031
- 15.1. Market Analysis, Insights and Forecast - By Country/Sub-region
- 15.1.1 Brazil
- 15.1.2 Argentina
- 15.1.3 Peru
- 15.1.4 Chile
- 15.1.5 Colombia
- 15.1.6 Ecuador
- 15.1.7 Venezuela
- 15.1.8 Rest of South America
- 16. North America Data Monetization Market Analysis, Insights and Forecast, 2019-2031
- 16.1. Market Analysis, Insights and Forecast - By Country/Sub-region
- 16.1.1 United States
- 16.1.2 Canada
- 16.1.3 Mexico
- 17. MEA Data Monetization Market Analysis, Insights and Forecast, 2019-2031
- 17.1. Market Analysis, Insights and Forecast - By Country/Sub-region
- 17.1.1 United Arab Emirates
- 17.1.2 Saudi Arabia
- 17.1.3 South Africa
- 17.1.4 Rest of Middle East and Africa
- 18. Competitive Analysis
- 18.1. Global Market Share Analysis 2024
- 18.2. Company Profiles
- 18.2.1 SAS Institute Inc
- 18.2.1.1. Overview
- 18.2.1.2. Products
- 18.2.1.3. SWOT Analysis
- 18.2.1.4. Recent Developments
- 18.2.1.5. Financials (Based on Availability)
- 18.2.2 Adastra Corporation
- 18.2.2.1. Overview
- 18.2.2.2. Products
- 18.2.2.3. SWOT Analysis
- 18.2.2.4. Recent Developments
- 18.2.2.5. Financials (Based on Availability)
- 18.2.3 Infosys Limited
- 18.2.3.1. Overview
- 18.2.3.2. Products
- 18.2.3.3. SWOT Analysis
- 18.2.3.4. Recent Developments
- 18.2.3.5. Financials (Based on Availability)
- 18.2.4 Accenture PLC
- 18.2.4.1. Overview
- 18.2.4.2. Products
- 18.2.4.3. SWOT Analysis
- 18.2.4.4. Recent Developments
- 18.2.4.5. Financials (Based on Availability)
- 18.2.5 IBM Corporation
- 18.2.5.1. Overview
- 18.2.5.2. Products
- 18.2.5.3. SWOT Analysis
- 18.2.5.4. Recent Developments
- 18.2.5.5. Financials (Based on Availability)
- 18.2.6 NetScout Systems Inc
- 18.2.6.1. Overview
- 18.2.6.2. Products
- 18.2.6.3. SWOT Analysis
- 18.2.6.4. Recent Developments
- 18.2.6.5. Financials (Based on Availability)
- 18.2.7 Dawex Systems SAS
- 18.2.7.1. Overview
- 18.2.7.2. Products
- 18.2.7.3. SWOT Analysis
- 18.2.7.4. Recent Developments
- 18.2.7.5. Financials (Based on Availability)
- 18.2.8 Ness Technologies Inc
- 18.2.8.1. Overview
- 18.2.8.2. Products
- 18.2.8.3. SWOT Analysis
- 18.2.8.4. Recent Developments
- 18.2.8.5. Financials (Based on Availability)
- 18.2.9 Google LLC (Alphabet Inc )
- 18.2.9.1. Overview
- 18.2.9.2. Products
- 18.2.9.3. SWOT Analysis
- 18.2.9.4. Recent Developments
- 18.2.9.5. Financials (Based on Availability)
- 18.2.10 Thales Group
- 18.2.10.1. Overview
- 18.2.10.2. Products
- 18.2.10.3. SWOT Analysis
- 18.2.10.4. Recent Developments
- 18.2.10.5. Financials (Based on Availability)
- 18.2.11 Cisco Systems Inc
- 18.2.11.1. Overview
- 18.2.11.2. Products
- 18.2.11.3. SWOT Analysis
- 18.2.11.4. Recent Developments
- 18.2.11.5. Financials (Based on Availability)
- 18.2.12 Openwave Mobility Inc (ENEA)
- 18.2.12.1. Overview
- 18.2.12.2. Products
- 18.2.12.3. SWOT Analysis
- 18.2.12.4. Recent Developments
- 18.2.12.5. Financials (Based on Availability)
- 18.2.13 SAP SE
- 18.2.13.1. Overview
- 18.2.13.2. Products
- 18.2.13.3. SWOT Analysis
- 18.2.13.4. Recent Developments
- 18.2.13.5. Financials (Based on Availability)
- 18.2.14 Emu Analytics Ltd
- 18.2.14.1. Overview
- 18.2.14.2. Products
- 18.2.14.3. SWOT Analysis
- 18.2.14.4. Recent Developments
- 18.2.14.5. Financials (Based on Availability)
- 18.2.1 SAS Institute Inc
List of Figures
- Figure 1: Global Data Monetization Market Revenue Breakdown (Million, %) by Region 2024 & 2032
- Figure 2: Global Data Monetization Market Volume Breakdown (K Unit, %) by Region 2024 & 2032
- Figure 3: North America Data Monetization Market Revenue (Million), by Country 2024 & 2032
- Figure 4: North America Data Monetization Market Volume (K Unit), by Country 2024 & 2032
- Figure 5: North America Data Monetization Market Revenue Share (%), by Country 2024 & 2032
- Figure 6: North America Data Monetization Market Volume Share (%), by Country 2024 & 2032
- Figure 7: Europe Data Monetization Market Revenue (Million), by Country 2024 & 2032
- Figure 8: Europe Data Monetization Market Volume (K Unit), by Country 2024 & 2032
- Figure 9: Europe Data Monetization Market Revenue Share (%), by Country 2024 & 2032
- Figure 10: Europe Data Monetization Market Volume Share (%), by Country 2024 & 2032
- Figure 11: Asia Pacific Data Monetization Market Revenue (Million), by Country 2024 & 2032
- Figure 12: Asia Pacific Data Monetization Market Volume (K Unit), by Country 2024 & 2032
- Figure 13: Asia Pacific Data Monetization Market Revenue Share (%), by Country 2024 & 2032
- Figure 14: Asia Pacific Data Monetization Market Volume Share (%), by Country 2024 & 2032
- Figure 15: South America Data Monetization Market Revenue (Million), by Country 2024 & 2032
- Figure 16: South America Data Monetization Market Volume (K Unit), by Country 2024 & 2032
- Figure 17: South America Data Monetization Market Revenue Share (%), by Country 2024 & 2032
- Figure 18: South America Data Monetization Market Volume Share (%), by Country 2024 & 2032
- Figure 19: North America Data Monetization Market Revenue (Million), by Country 2024 & 2032
- Figure 20: North America Data Monetization Market Volume (K Unit), by Country 2024 & 2032
- Figure 21: North America Data Monetization Market Revenue Share (%), by Country 2024 & 2032
- Figure 22: North America Data Monetization Market Volume Share (%), by Country 2024 & 2032
- Figure 23: MEA Data Monetization Market Revenue (Million), by Country 2024 & 2032
- Figure 24: MEA Data Monetization Market Volume (K Unit), by Country 2024 & 2032
- Figure 25: MEA Data Monetization Market Revenue Share (%), by Country 2024 & 2032
- Figure 26: MEA Data Monetization Market Volume Share (%), by Country 2024 & 2032
- Figure 27: North America Data Monetization Market Revenue (Million), by Organization Size 2024 & 2032
- Figure 28: North America Data Monetization Market Volume (K Unit), by Organization Size 2024 & 2032
- Figure 29: North America Data Monetization Market Revenue Share (%), by Organization Size 2024 & 2032
- Figure 30: North America Data Monetization Market Volume Share (%), by Organization Size 2024 & 2032
- Figure 31: North America Data Monetization Market Revenue (Million), by End-user Industry 2024 & 2032
- Figure 32: North America Data Monetization Market Volume (K Unit), by End-user Industry 2024 & 2032
- Figure 33: North America Data Monetization Market Revenue Share (%), by End-user Industry 2024 & 2032
- Figure 34: North America Data Monetization Market Volume Share (%), by End-user Industry 2024 & 2032
- Figure 35: North America Data Monetization Market Revenue (Million), by Country 2024 & 2032
- Figure 36: North America Data Monetization Market Volume (K Unit), by Country 2024 & 2032
- Figure 37: North America Data Monetization Market Revenue Share (%), by Country 2024 & 2032
- Figure 38: North America Data Monetization Market Volume Share (%), by Country 2024 & 2032
- Figure 39: Europe Data Monetization Market Revenue (Million), by Organization Size 2024 & 2032
- Figure 40: Europe Data Monetization Market Volume (K Unit), by Organization Size 2024 & 2032
- Figure 41: Europe Data Monetization Market Revenue Share (%), by Organization Size 2024 & 2032
- Figure 42: Europe Data Monetization Market Volume Share (%), by Organization Size 2024 & 2032
- Figure 43: Europe Data Monetization Market Revenue (Million), by End-user Industry 2024 & 2032
- Figure 44: Europe Data Monetization Market Volume (K Unit), by End-user Industry 2024 & 2032
- Figure 45: Europe Data Monetization Market Revenue Share (%), by End-user Industry 2024 & 2032
- Figure 46: Europe Data Monetization Market Volume Share (%), by End-user Industry 2024 & 2032
- Figure 47: Europe Data Monetization Market Revenue (Million), by Country 2024 & 2032
- Figure 48: Europe Data Monetization Market Volume (K Unit), by Country 2024 & 2032
- Figure 49: Europe Data Monetization Market Revenue Share (%), by Country 2024 & 2032
- Figure 50: Europe Data Monetization Market Volume Share (%), by Country 2024 & 2032
- Figure 51: Asia Data Monetization Market Revenue (Million), by Organization Size 2024 & 2032
- Figure 52: Asia Data Monetization Market Volume (K Unit), by Organization Size 2024 & 2032
- Figure 53: Asia Data Monetization Market Revenue Share (%), by Organization Size 2024 & 2032
- Figure 54: Asia Data Monetization Market Volume Share (%), by Organization Size 2024 & 2032
- Figure 55: Asia Data Monetization Market Revenue (Million), by End-user Industry 2024 & 2032
- Figure 56: Asia Data Monetization Market Volume (K Unit), by End-user Industry 2024 & 2032
- Figure 57: Asia Data Monetization Market Revenue Share (%), by End-user Industry 2024 & 2032
- Figure 58: Asia Data Monetization Market Volume Share (%), by End-user Industry 2024 & 2032
- Figure 59: Asia Data Monetization Market Revenue (Million), by Country 2024 & 2032
- Figure 60: Asia Data Monetization Market Volume (K Unit), by Country 2024 & 2032
- Figure 61: Asia Data Monetization Market Revenue Share (%), by Country 2024 & 2032
- Figure 62: Asia Data Monetization Market Volume Share (%), by Country 2024 & 2032
- Figure 63: Australia and New Zealand Data Monetization Market Revenue (Million), by Organization Size 2024 & 2032
- Figure 64: Australia and New Zealand Data Monetization Market Volume (K Unit), by Organization Size 2024 & 2032
- Figure 65: Australia and New Zealand Data Monetization Market Revenue Share (%), by Organization Size 2024 & 2032
- Figure 66: Australia and New Zealand Data Monetization Market Volume Share (%), by Organization Size 2024 & 2032
- Figure 67: Australia and New Zealand Data Monetization Market Revenue (Million), by End-user Industry 2024 & 2032
- Figure 68: Australia and New Zealand Data Monetization Market Volume (K Unit), by End-user Industry 2024 & 2032
- Figure 69: Australia and New Zealand Data Monetization Market Revenue Share (%), by End-user Industry 2024 & 2032
- Figure 70: Australia and New Zealand Data Monetization Market Volume Share (%), by End-user Industry 2024 & 2032
- Figure 71: Australia and New Zealand Data Monetization Market Revenue (Million), by Country 2024 & 2032
- Figure 72: Australia and New Zealand Data Monetization Market Volume (K Unit), by Country 2024 & 2032
- Figure 73: Australia and New Zealand Data Monetization Market Revenue Share (%), by Country 2024 & 2032
- Figure 74: Australia and New Zealand Data Monetization Market Volume Share (%), by Country 2024 & 2032
- Figure 75: Latin America Data Monetization Market Revenue (Million), by Organization Size 2024 & 2032
- Figure 76: Latin America Data Monetization Market Volume (K Unit), by Organization Size 2024 & 2032
- Figure 77: Latin America Data Monetization Market Revenue Share (%), by Organization Size 2024 & 2032
- Figure 78: Latin America Data Monetization Market Volume Share (%), by Organization Size 2024 & 2032
- Figure 79: Latin America Data Monetization Market Revenue (Million), by End-user Industry 2024 & 2032
- Figure 80: Latin America Data Monetization Market Volume (K Unit), by End-user Industry 2024 & 2032
- Figure 81: Latin America Data Monetization Market Revenue Share (%), by End-user Industry 2024 & 2032
- Figure 82: Latin America Data Monetization Market Volume Share (%), by End-user Industry 2024 & 2032
- Figure 83: Latin America Data Monetization Market Revenue (Million), by Country 2024 & 2032
- Figure 84: Latin America Data Monetization Market Volume (K Unit), by Country 2024 & 2032
- Figure 85: Latin America Data Monetization Market Revenue Share (%), by Country 2024 & 2032
- Figure 86: Latin America Data Monetization Market Volume Share (%), by Country 2024 & 2032
- Figure 87: Middle East and Africa Data Monetization Market Revenue (Million), by Organization Size 2024 & 2032
- Figure 88: Middle East and Africa Data Monetization Market Volume (K Unit), by Organization Size 2024 & 2032
- Figure 89: Middle East and Africa Data Monetization Market Revenue Share (%), by Organization Size 2024 & 2032
- Figure 90: Middle East and Africa Data Monetization Market Volume Share (%), by Organization Size 2024 & 2032
- Figure 91: Middle East and Africa Data Monetization Market Revenue (Million), by End-user Industry 2024 & 2032
- Figure 92: Middle East and Africa Data Monetization Market Volume (K Unit), by End-user Industry 2024 & 2032
- Figure 93: Middle East and Africa Data Monetization Market Revenue Share (%), by End-user Industry 2024 & 2032
- Figure 94: Middle East and Africa Data Monetization Market Volume Share (%), by End-user Industry 2024 & 2032
- Figure 95: Middle East and Africa Data Monetization Market Revenue (Million), by Country 2024 & 2032
- Figure 96: Middle East and Africa Data Monetization Market Volume (K Unit), by Country 2024 & 2032
- Figure 97: Middle East and Africa Data Monetization Market Revenue Share (%), by Country 2024 & 2032
- Figure 98: Middle East and Africa Data Monetization Market Volume Share (%), by Country 2024 & 2032
List of Tables
- Table 1: Global Data Monetization Market Revenue Million Forecast, by Region 2019 & 2032
- Table 2: Global Data Monetization Market Volume K Unit Forecast, by Region 2019 & 2032
- Table 3: Global Data Monetization Market Revenue Million Forecast, by Organization Size 2019 & 2032
- Table 4: Global Data Monetization Market Volume K Unit Forecast, by Organization Size 2019 & 2032
- Table 5: Global Data Monetization Market Revenue Million Forecast, by End-user Industry 2019 & 2032
- Table 6: Global Data Monetization Market Volume K Unit Forecast, by End-user Industry 2019 & 2032
- Table 7: Global Data Monetization Market Revenue Million Forecast, by Region 2019 & 2032
- Table 8: Global Data Monetization Market Volume K Unit Forecast, by Region 2019 & 2032
- Table 9: Global Data Monetization Market Revenue Million Forecast, by Country 2019 & 2032
- Table 10: Global Data Monetization Market Volume K Unit Forecast, by Country 2019 & 2032
- Table 11: United States Data Monetization Market Revenue (Million) Forecast, by Application 2019 & 2032
- Table 12: United States Data Monetization Market Volume (K Unit) Forecast, by Application 2019 & 2032
- Table 13: Canada Data Monetization Market Revenue (Million) Forecast, by Application 2019 & 2032
- Table 14: Canada Data Monetization Market Volume (K Unit) Forecast, by Application 2019 & 2032
- Table 15: Mexico Data Monetization Market Revenue (Million) Forecast, by Application 2019 & 2032
- Table 16: Mexico Data Monetization Market Volume (K Unit) Forecast, by Application 2019 & 2032
- Table 17: Global Data Monetization Market Revenue Million Forecast, by Country 2019 & 2032
- Table 18: Global Data Monetization Market Volume K Unit Forecast, by Country 2019 & 2032
- Table 19: Germany Data Monetization Market Revenue (Million) Forecast, by Application 2019 & 2032
- Table 20: Germany Data Monetization Market Volume (K Unit) Forecast, by Application 2019 & 2032
- Table 21: United Kingdom Data Monetization Market Revenue (Million) Forecast, by Application 2019 & 2032
- Table 22: United Kingdom Data Monetization Market Volume (K Unit) Forecast, by Application 2019 & 2032
- Table 23: France Data Monetization Market Revenue (Million) Forecast, by Application 2019 & 2032
- Table 24: France Data Monetization Market Volume (K Unit) Forecast, by Application 2019 & 2032
- Table 25: Spain Data Monetization Market Revenue (Million) Forecast, by Application 2019 & 2032
- Table 26: Spain Data Monetization Market Volume (K Unit) Forecast, by Application 2019 & 2032
- Table 27: Italy Data Monetization Market Revenue (Million) Forecast, by Application 2019 & 2032
- Table 28: Italy Data Monetization Market Volume (K Unit) Forecast, by Application 2019 & 2032
- Table 29: Spain Data Monetization Market Revenue (Million) Forecast, by Application 2019 & 2032
- Table 30: Spain Data Monetization Market Volume (K Unit) Forecast, by Application 2019 & 2032
- Table 31: Belgium Data Monetization Market Revenue (Million) Forecast, by Application 2019 & 2032
- Table 32: Belgium Data Monetization Market Volume (K Unit) Forecast, by Application 2019 & 2032
- Table 33: Netherland Data Monetization Market Revenue (Million) Forecast, by Application 2019 & 2032
- Table 34: Netherland Data Monetization Market Volume (K Unit) Forecast, by Application 2019 & 2032
- Table 35: Nordics Data Monetization Market Revenue (Million) Forecast, by Application 2019 & 2032
- Table 36: Nordics Data Monetization Market Volume (K Unit) Forecast, by Application 2019 & 2032
- Table 37: Rest of Europe Data Monetization Market Revenue (Million) Forecast, by Application 2019 & 2032
- Table 38: Rest of Europe Data Monetization Market Volume (K Unit) Forecast, by Application 2019 & 2032
- Table 39: Global Data Monetization Market Revenue Million Forecast, by Country 2019 & 2032
- Table 40: Global Data Monetization Market Volume K Unit Forecast, by Country 2019 & 2032
- Table 41: China Data Monetization Market Revenue (Million) Forecast, by Application 2019 & 2032
- Table 42: China Data Monetization Market Volume (K Unit) Forecast, by Application 2019 & 2032
- Table 43: Japan Data Monetization Market Revenue (Million) Forecast, by Application 2019 & 2032
- Table 44: Japan Data Monetization Market Volume (K Unit) Forecast, by Application 2019 & 2032
- Table 45: India Data Monetization Market Revenue (Million) Forecast, by Application 2019 & 2032
- Table 46: India Data Monetization Market Volume (K Unit) Forecast, by Application 2019 & 2032
- Table 47: South Korea Data Monetization Market Revenue (Million) Forecast, by Application 2019 & 2032
- Table 48: South Korea Data Monetization Market Volume (K Unit) Forecast, by Application 2019 & 2032
- Table 49: Southeast Asia Data Monetization Market Revenue (Million) Forecast, by Application 2019 & 2032
- Table 50: Southeast Asia Data Monetization Market Volume (K Unit) Forecast, by Application 2019 & 2032
- Table 51: Australia Data Monetization Market Revenue (Million) Forecast, by Application 2019 & 2032
- Table 52: Australia Data Monetization Market Volume (K Unit) Forecast, by Application 2019 & 2032
- Table 53: Indonesia Data Monetization Market Revenue (Million) Forecast, by Application 2019 & 2032
- Table 54: Indonesia Data Monetization Market Volume (K Unit) Forecast, by Application 2019 & 2032
- Table 55: Phillipes Data Monetization Market Revenue (Million) Forecast, by Application 2019 & 2032
- Table 56: Phillipes Data Monetization Market Volume (K Unit) Forecast, by Application 2019 & 2032
- Table 57: Singapore Data Monetization Market Revenue (Million) Forecast, by Application 2019 & 2032
- Table 58: Singapore Data Monetization Market Volume (K Unit) Forecast, by Application 2019 & 2032
- Table 59: Thailandc Data Monetization Market Revenue (Million) Forecast, by Application 2019 & 2032
- Table 60: Thailandc Data Monetization Market Volume (K Unit) Forecast, by Application 2019 & 2032
- Table 61: Rest of Asia Pacific Data Monetization Market Revenue (Million) Forecast, by Application 2019 & 2032
- Table 62: Rest of Asia Pacific Data Monetization Market Volume (K Unit) Forecast, by Application 2019 & 2032
- Table 63: Global Data Monetization Market Revenue Million Forecast, by Country 2019 & 2032
- Table 64: Global Data Monetization Market Volume K Unit Forecast, by Country 2019 & 2032
- Table 65: Brazil Data Monetization Market Revenue (Million) Forecast, by Application 2019 & 2032
- Table 66: Brazil Data Monetization Market Volume (K Unit) Forecast, by Application 2019 & 2032
- Table 67: Argentina Data Monetization Market Revenue (Million) Forecast, by Application 2019 & 2032
- Table 68: Argentina Data Monetization Market Volume (K Unit) Forecast, by Application 2019 & 2032
- Table 69: Peru Data Monetization Market Revenue (Million) Forecast, by Application 2019 & 2032
- Table 70: Peru Data Monetization Market Volume (K Unit) Forecast, by Application 2019 & 2032
- Table 71: Chile Data Monetization Market Revenue (Million) Forecast, by Application 2019 & 2032
- Table 72: Chile Data Monetization Market Volume (K Unit) Forecast, by Application 2019 & 2032
- Table 73: Colombia Data Monetization Market Revenue (Million) Forecast, by Application 2019 & 2032
- Table 74: Colombia Data Monetization Market Volume (K Unit) Forecast, by Application 2019 & 2032
- Table 75: Ecuador Data Monetization Market Revenue (Million) Forecast, by Application 2019 & 2032
- Table 76: Ecuador Data Monetization Market Volume (K Unit) Forecast, by Application 2019 & 2032
- Table 77: Venezuela Data Monetization Market Revenue (Million) Forecast, by Application 2019 & 2032
- Table 78: Venezuela Data Monetization Market Volume (K Unit) Forecast, by Application 2019 & 2032
- Table 79: Rest of South America Data Monetization Market Revenue (Million) Forecast, by Application 2019 & 2032
- Table 80: Rest of South America Data Monetization Market Volume (K Unit) Forecast, by Application 2019 & 2032
- Table 81: Global Data Monetization Market Revenue Million Forecast, by Country 2019 & 2032
- Table 82: Global Data Monetization Market Volume K Unit Forecast, by Country 2019 & 2032
- Table 83: United States Data Monetization Market Revenue (Million) Forecast, by Application 2019 & 2032
- Table 84: United States Data Monetization Market Volume (K Unit) Forecast, by Application 2019 & 2032
- Table 85: Canada Data Monetization Market Revenue (Million) Forecast, by Application 2019 & 2032
- Table 86: Canada Data Monetization Market Volume (K Unit) Forecast, by Application 2019 & 2032
- Table 87: Mexico Data Monetization Market Revenue (Million) Forecast, by Application 2019 & 2032
- Table 88: Mexico Data Monetization Market Volume (K Unit) Forecast, by Application 2019 & 2032
- Table 89: Global Data Monetization Market Revenue Million Forecast, by Country 2019 & 2032
- Table 90: Global Data Monetization Market Volume K Unit Forecast, by Country 2019 & 2032
- Table 91: United Arab Emirates Data Monetization Market Revenue (Million) Forecast, by Application 2019 & 2032
- Table 92: United Arab Emirates Data Monetization Market Volume (K Unit) Forecast, by Application 2019 & 2032
- Table 93: Saudi Arabia Data Monetization Market Revenue (Million) Forecast, by Application 2019 & 2032
- Table 94: Saudi Arabia Data Monetization Market Volume (K Unit) Forecast, by Application 2019 & 2032
- Table 95: South Africa Data Monetization Market Revenue (Million) Forecast, by Application 2019 & 2032
- Table 96: South Africa Data Monetization Market Volume (K Unit) Forecast, by Application 2019 & 2032
- Table 97: Rest of Middle East and Africa Data Monetization Market Revenue (Million) Forecast, by Application 2019 & 2032
- Table 98: Rest of Middle East and Africa Data Monetization Market Volume (K Unit) Forecast, by Application 2019 & 2032
- Table 99: Global Data Monetization Market Revenue Million Forecast, by Organization Size 2019 & 2032
- Table 100: Global Data Monetization Market Volume K Unit Forecast, by Organization Size 2019 & 2032
- Table 101: Global Data Monetization Market Revenue Million Forecast, by End-user Industry 2019 & 2032
- Table 102: Global Data Monetization Market Volume K Unit Forecast, by End-user Industry 2019 & 2032
- Table 103: Global Data Monetization Market Revenue Million Forecast, by Country 2019 & 2032
- Table 104: Global Data Monetization Market Volume K Unit Forecast, by Country 2019 & 2032
- Table 105: Global Data Monetization Market Revenue Million Forecast, by Organization Size 2019 & 2032
- Table 106: Global Data Monetization Market Volume K Unit Forecast, by Organization Size 2019 & 2032
- Table 107: Global Data Monetization Market Revenue Million Forecast, by End-user Industry 2019 & 2032
- Table 108: Global Data Monetization Market Volume K Unit Forecast, by End-user Industry 2019 & 2032
- Table 109: Global Data Monetization Market Revenue Million Forecast, by Country 2019 & 2032
- Table 110: Global Data Monetization Market Volume K Unit Forecast, by Country 2019 & 2032
- Table 111: Global Data Monetization Market Revenue Million Forecast, by Organization Size 2019 & 2032
- Table 112: Global Data Monetization Market Volume K Unit Forecast, by Organization Size 2019 & 2032
- Table 113: Global Data Monetization Market Revenue Million Forecast, by End-user Industry 2019 & 2032
- Table 114: Global Data Monetization Market Volume K Unit Forecast, by End-user Industry 2019 & 2032
- Table 115: Global Data Monetization Market Revenue Million Forecast, by Country 2019 & 2032
- Table 116: Global Data Monetization Market Volume K Unit Forecast, by Country 2019 & 2032
- Table 117: Global Data Monetization Market Revenue Million Forecast, by Organization Size 2019 & 2032
- Table 118: Global Data Monetization Market Volume K Unit Forecast, by Organization Size 2019 & 2032
- Table 119: Global Data Monetization Market Revenue Million Forecast, by End-user Industry 2019 & 2032
- Table 120: Global Data Monetization Market Volume K Unit Forecast, by End-user Industry 2019 & 2032
- Table 121: Global Data Monetization Market Revenue Million Forecast, by Country 2019 & 2032
- Table 122: Global Data Monetization Market Volume K Unit Forecast, by Country 2019 & 2032
- Table 123: Global Data Monetization Market Revenue Million Forecast, by Organization Size 2019 & 2032
- Table 124: Global Data Monetization Market Volume K Unit Forecast, by Organization Size 2019 & 2032
- Table 125: Global Data Monetization Market Revenue Million Forecast, by End-user Industry 2019 & 2032
- Table 126: Global Data Monetization Market Volume K Unit Forecast, by End-user Industry 2019 & 2032
- Table 127: Global Data Monetization Market Revenue Million Forecast, by Country 2019 & 2032
- Table 128: Global Data Monetization Market Volume K Unit Forecast, by Country 2019 & 2032
- Table 129: Global Data Monetization Market Revenue Million Forecast, by Organization Size 2019 & 2032
- Table 130: Global Data Monetization Market Volume K Unit Forecast, by Organization Size 2019 & 2032
- Table 131: Global Data Monetization Market Revenue Million Forecast, by End-user Industry 2019 & 2032
- Table 132: Global Data Monetization Market Volume K Unit Forecast, by End-user Industry 2019 & 2032
- Table 133: Global Data Monetization Market Revenue Million Forecast, by Country 2019 & 2032
- Table 134: Global Data Monetization Market Volume K Unit Forecast, by Country 2019 & 2032
Frequently Asked Questions
1. What is the projected Compound Annual Growth Rate (CAGR) of the Data Monetization Market?
The projected CAGR is approximately 19.94%.
2. Which companies are prominent players in the Data Monetization Market?
Key companies in the market include SAS Institute Inc, Adastra Corporation, Infosys Limited, Accenture PLC, IBM Corporation, NetScout Systems Inc, Dawex Systems SAS, Ness Technologies Inc, Google LLC (Alphabet Inc ), Thales Group, Cisco Systems Inc, Openwave Mobility Inc (ENEA), SAP SE, Emu Analytics Ltd.
3. What are the main segments of the Data Monetization Market?
The market segments include Organization Size, End-user Industry.
4. Can you provide details about the market size?
The market size is estimated to be USD 4.17 Million as of 2022.
5. What are some drivers contributing to market growth?
Rapid Adoption of Advanced Analytics and Visualization; Increasing Volume and Variety of Business Data.
6. What are the notable trends driving market growth?
Large Enterprises to Hold Major Market Share.
7. Are there any restraints impacting market growth?
Interoperability With Existing Systems; Varying Structure of Regulatory Policies.
8. Can you provide examples of recent developments in the market?
April 2024: Carv, a data layer platform that lets web3 gaming apps, AI companies, and gamers control and monetize their data, raised a USD 10 million series A round led by Tribe Capital and IOSG Ventures. The company differentiates itself by empowering users with data ownership and monetization rights, which are expected to support the market growth during the forecast period.
9. What pricing options are available for accessing the report?
Pricing options include single-user, multi-user, and enterprise licenses priced at USD 4750, USD 5250, and USD 8750 respectively.
10. Is the market size provided in terms of value or volume?
The market size is provided in terms of value, measured in Million and volume, measured in K Unit.
11. Are there any specific market keywords associated with the report?
Yes, the market keyword associated with the report is "Data Monetization Market," which aids in identifying and referencing the specific market segment covered.
12. How do I determine which pricing option suits my needs best?
The pricing options vary based on user requirements and access needs. Individual users may opt for single-user licenses, while businesses requiring broader access may choose multi-user or enterprise licenses for cost-effective access to the report.
13. Are there any additional resources or data provided in the Data Monetization Market report?
While the report offers comprehensive insights, it's advisable to review the specific contents or supplementary materials provided to ascertain if additional resources or data are available.
14. How can I stay updated on further developments or reports in the Data Monetization Market?
To stay informed about further developments, trends, and reports in the Data Monetization Market, consider subscribing to industry newsletters, following relevant companies and organizations, or regularly checking reputable industry news sources and publications.
Methodology
Step 1 - Identification of Relevant Samples Size from Population Database


Step 2 - Approaches for Defining Global Market Size (Value, Volume* & Price*)

Note*: In applicable scenarios
Step 3 - Data Sources
Primary Research
- Web Analytics
- Survey Reports
- Research Institute
- Latest Research Reports
- Opinion Leaders
Secondary Research
- Annual Reports
- White Paper
- Latest Press Release
- Industry Association
- Paid Database
- Investor Presentations

Step 4 - Data Triangulation
Involves using different sources of information in order to increase the validity of a study
These sources are likely to be stakeholders in a program - participants, other researchers, program staff, other community members, and so on.
Then we put all data in single framework & apply various statistical tools to find out the dynamic on the market.
During the analysis stage, feedback from the stakeholder groups would be compared to determine areas of agreement as well as areas of divergence


