
Key Insights
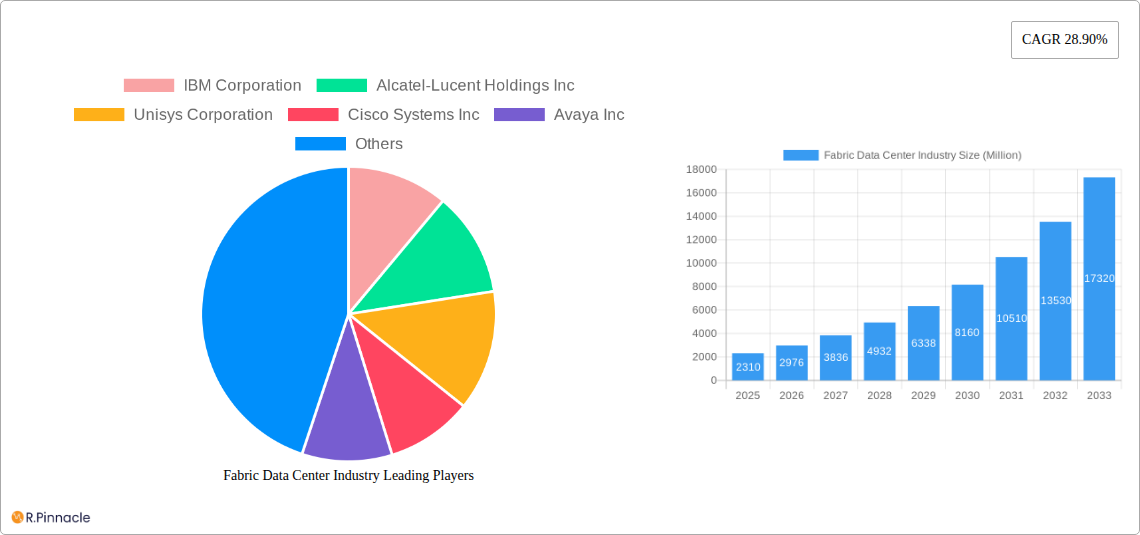
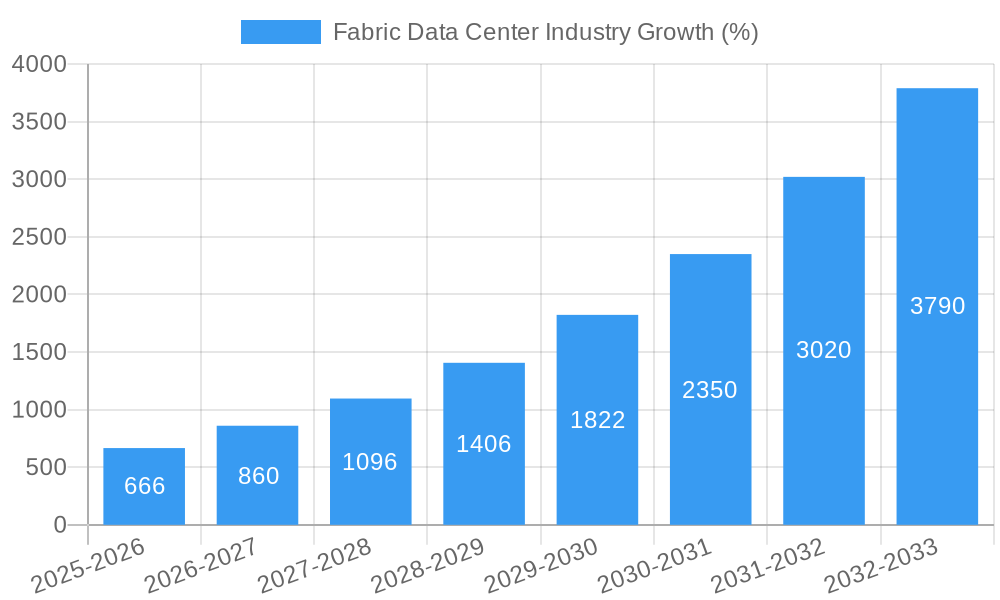
The Fabric Data Center market is experiencing robust growth, projected to reach \$2.31 billion in 2025 and exhibiting a Compound Annual Growth Rate (CAGR) of 28.90% from 2025 to 2033. This expansion is driven by the increasing adoption of cloud computing, the surge in data center virtualization, and the growing need for improved network agility and scalability. Businesses across various sectors, including IT & Communications, Banking & Financial Services, and Healthcare, are increasingly relying on fabric data centers to enhance operational efficiency, optimize resource utilization, and support demanding applications. The shift towards software-defined networking (SDN) and network function virtualization (NFV) is further fueling market growth, allowing for greater flexibility and automation in network management.
Several key trends are shaping the market's trajectory. The integration of artificial intelligence (AI) and machine learning (ML) in fabric data center management is enhancing network monitoring and troubleshooting capabilities. Furthermore, the rising adoption of 5G and edge computing is driving demand for high-bandwidth, low-latency network infrastructure solutions. While the market faces challenges like high initial investment costs and the complexity of implementing and managing sophisticated network fabrics, the long-term benefits in terms of improved performance, scalability, and cost efficiency outweigh these restraints, ensuring continued market expansion. Key players like Cisco, IBM, and Huawei are actively innovating and expanding their product portfolios to capitalize on these opportunities, contributing to a competitive and dynamic market landscape. The North American market currently holds a significant share due to early adoption of advanced technologies, but the Asia-Pacific region is expected to witness substantial growth in the coming years fueled by increasing digitalization efforts in developing economies.
Fabric Data Center Industry Report: 2019-2033
This comprehensive report provides a detailed analysis of the Fabric Data Center industry, offering invaluable insights for industry professionals, investors, and strategic planners. With a study period spanning 2019-2033, a base year of 2025, and a forecast period of 2025-2033, this report leverages extensive data and expert analysis to paint a clear picture of the market's current state and future trajectory. The global Fabric Data Center market is projected to reach xx Million by 2033, exhibiting a robust CAGR of xx% during the forecast period.
Fabric Data Center Industry Market Structure & Innovation Trends
This section analyzes the competitive landscape of the Fabric Data Center market, examining market concentration, key innovation drivers, regulatory influences, and significant M&A activities. The market is characterized by a moderate level of concentration, with several key players holding significant market share. However, the emergence of innovative technologies and new entrants is fostering a dynamic competitive environment.
- Market Share (Estimated 2025): The top 5 players (IBM, Cisco, Huawei, Dell, Hewlett-Packard Enterprise) collectively hold approximately xx% of the market share. Precise figures require proprietary data.
- M&A Activity: The past five years have witnessed several significant mergers and acquisitions, with deal values totaling approximately xx Million. These activities have reshaped the competitive landscape, leading to increased consolidation.
- Innovation Drivers: Key drivers include the increasing demand for high-bandwidth, low-latency networking solutions, the growth of cloud computing, and advancements in software-defined networking (SDN) technologies.
- Regulatory Frameworks: Government regulations concerning data security and privacy are influencing the adoption of Fabric Data Centers. Compliance requirements are driving demand for robust security solutions within the Fabric Data Center market.
- Product Substitutes: Traditional data center architectures pose a competitive threat, although the superior scalability and efficiency of Fabric Data Centers are gradually winning over market share.
- End-User Demographics: The key end-users are Cloud Service Providers, Telecom Service Providers, and large enterprises across diverse sectors such as IT & Communication, Banking & Financial Services, and Healthcare.
Fabric Data Center Industry Market Dynamics & Trends
This section delves into the key market dynamics influencing the growth of the Fabric Data Center industry. The market is experiencing rapid growth driven by several factors, including the increasing adoption of cloud computing, the proliferation of big data, and the expanding demand for high-performance computing. Technological advancements such as SDN, network function virtualization (NFV), and artificial intelligence (AI) are further accelerating market expansion. Competitive dynamics are intensely shaped by technological innovations, strategic partnerships, and aggressive pricing strategies among key market players.
The market is witnessing a shift towards software-defined data centers, enabling greater flexibility and automation. Consumer preferences are increasingly focused on solutions that offer superior performance, scalability, and cost-effectiveness. The CAGR of the market is expected to remain strong, driven by ongoing technological advancements and the expanding adoption of Fabric Data Centers across diverse industries. Market penetration is rising steadily, particularly in regions with strong digital infrastructure and a high concentration of data-intensive businesses.
Dominant Regions & Segments in Fabric Data Center Industry
This section identifies the leading regions, countries, and market segments within the Fabric Data Center industry.
By Solution: Switches currently dominate the market, followed by Routers. Storage Area Networking is growing rapidly, spurred by the rise of big data applications. Other solutions are experiencing moderate growth.
By Application: The IT & Communication sector is the largest application segment, followed by the Banking & Financial Services sector. Healthcare and Retail are also significant application areas, indicating the wide applicability of Fabric Data Centers across diverse sectors.
By End-User: Cloud Service Providers and Telecom Service Providers represent the dominant end-user segments, accounting for a significant portion of market demand. The growth of these segments is strongly correlated with the overall growth of the Fabric Data Center market.
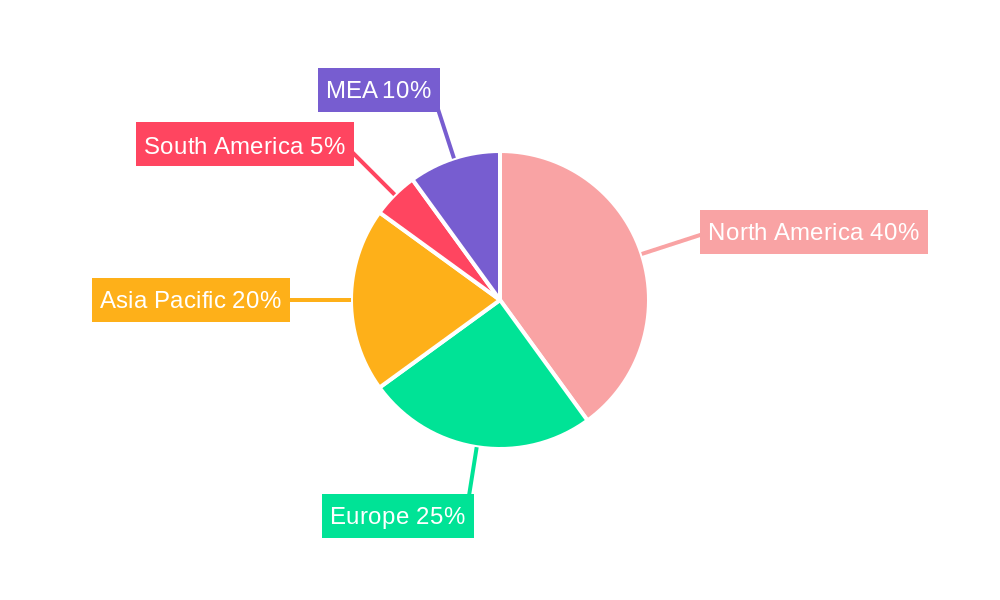
Dominant Regions: North America and Europe currently hold significant market share, driven by the high adoption rates of cloud computing and advanced technologies. However, regions like Asia-Pacific are emerging as key growth areas due to rapid digitalization and infrastructure investments.
Key drivers for specific regions vary: North America benefits from a strong technological foundation and established digital infrastructure. Europe benefits from robust government regulations and investment in digital infrastructure. Asia-Pacific demonstrates rapid growth driven by increasing IT spending and the expanding adoption of cloud computing and data centers.
Fabric Data Center Industry Product Innovations
Recent product innovations center on increased automation, improved scalability, and enhanced security features. Software-defined networking (SDN) and network function virtualization (NFV) are key technological trends driving innovation. New products emphasize seamless integration with cloud platforms, enhancing the efficiency and flexibility of data center operations. This aligns perfectly with growing market demand for agile and cost-effective solutions.
Report Scope & Segmentation Analysis
This report segments the Fabric Data Center market by solution (Router, Switches, Storage Area Networking, Other Solutions), application (IT & Communication, Banking & Financial Services, Healthcare, Retail, Other Applications), and end-user (Cloud Service Providers, Telecom Service Providers). Each segment is analyzed to identify growth projections, market sizes, and competitive dynamics. The market is expected to witness significant growth across all segments, albeit at varying rates.
Key Drivers of Fabric Data Center Industry Growth
Several factors fuel the growth of the Fabric Data Center industry. These include:
- The rising adoption of cloud computing and data center virtualization.
- The expanding demand for high-performance computing and big data analytics.
- The increasing need for scalable and reliable networking infrastructure.
- Advancements in SDN, NFV, and AI technologies.
- Favorable government policies and incentives promoting digital infrastructure development.
Challenges in the Fabric Data Center Industry Sector
The Fabric Data Center industry faces several challenges:
- High initial investment costs for implementing Fabric Data Centers.
- Complexity of integrating Fabric Data Centers with existing legacy systems.
- Skill gap in managing and maintaining Fabric Data Center infrastructure.
- Security concerns related to data breaches and cyberattacks.
- Intense competition among vendors offering similar solutions.
Emerging Opportunities in Fabric Data Center Industry
Emerging opportunities abound for Fabric Data Center providers:
- Expansion into new and developing markets with increasing demand for digital infrastructure.
- Development of innovative solutions integrating AI and machine learning capabilities.
- Providing managed services to simplify Fabric Data Center operation and maintenance.
- Focusing on niche applications such as edge computing and IoT.
- Strategic partnerships and collaborations to enhance market reach and customer offerings.
Leading Players in the Fabric Data Center Industry Market
- IBM Corporation
- Alcatel-Lucent Holdings Inc
- Unisys Corporation
- Cisco Systems Inc
- Avaya Inc
- Extreme Networks Inc
- Dell Inc
- Huawei Technologies Co Ltd
- Hewlett-Packard Enterprise Company
- Oracle Corporation
- Brocade Communications Systems
Key Developments in Fabric Data Center Industry Industry
July 2023: Huawei announced three innovative data center facility solutions, including the next-generation indirect evaporative cooling solution EHU and the mobile intelligent management solution iManager-M. These developments significantly enhance data center efficiency and reliability.
December 2022: Nokia's 7220 IXR D2/D3 interconnect routers were selected for a major data center deployment, highlighting the growing adoption of Nokia's networking solutions in large-scale data center fabrics.
October 2022: Cloudera's announcement of new hybrid data capabilities improves data migration and management across cloud and on-premises environments, enhancing the flexibility and efficiency of data center operations.
Future Outlook for Fabric Data Center Industry Market
The Fabric Data Center market is poised for sustained growth, driven by increasing demand for high-performance computing, the continued expansion of cloud computing, and the development of advanced networking technologies. Strategic opportunities exist for companies to innovate in areas such as AI-powered data center management, edge computing, and enhanced security solutions. The market's future is bright, with significant potential for expansion and growth across diverse segments and geographic regions.
Fabric Data Center Industry Segmentation
-
1. Solution
- 1.1. Router
- 1.2. Switches
- 1.3. Storage Area Networking
- 1.4. Other Solutions
-
2. Application
- 2.1. IT & Communication
- 2.2. Banking & Financial Services
- 2.3. Healthcare
- 2.4. Retail
- 2.5. Other Applications
-
3. End User
- 3.1. Cloud Service Providers
- 3.2. Telecom Service Providers
Fabric Data Center Industry Segmentation By Geography
- 1. North America
- 2. Europe
- 3. Asia Pacific
- 4. Latin America
- 5. Middle East
Fabric Data Center Industry REPORT HIGHLIGHTS
| Aspects | Details |
|---|---|
| Study Period | 2019-2033 |
| Base Year | 2024 |
| Estimated Year | 2025 |
| Forecast Period | 2025-2033 |
| Historical Period | 2019-2024 |
| Growth Rate | CAGR of 28.90% from 2019-2033 |
| Segmentation |
|
Table of Contents
- 1. Introduction
- 1.1. Research Scope
- 1.2. Market Segmentation
- 1.3. Research Methodology
- 1.4. Definitions and Assumptions
- 2. Executive Summary
- 2.1. Introduction
- 3. Market Dynamics
- 3.1. Introduction
- 3.2. Market Drivers
- 3.2.1. Increasing Demand for Data Storage and Adoption of Cloud Computing; Need for High Speed Data Transfer; Increasing Demand of Fabric Switches
- 3.3. Market Restrains
- 3.3.1. Security issues
- 3.4. Market Trends
- 3.4.1. Increasing Demand of Fabric Switches is Driving the Market
- 4. Market Factor Analysis
- 4.1. Porters Five Forces
- 4.2. Supply/Value Chain
- 4.3. PESTEL analysis
- 4.4. Market Entropy
- 4.5. Patent/Trademark Analysis
- 5. Global Fabric Data Center Industry Analysis, Insights and Forecast, 2019-2031
- 5.1. Market Analysis, Insights and Forecast - by Solution
- 5.1.1. Router
- 5.1.2. Switches
- 5.1.3. Storage Area Networking
- 5.1.4. Other Solutions
- 5.2. Market Analysis, Insights and Forecast - by Application
- 5.2.1. IT & Communication
- 5.2.2. Banking & Financial Services
- 5.2.3. Healthcare
- 5.2.4. Retail
- 5.2.5. Other Applications
- 5.3. Market Analysis, Insights and Forecast - by End User
- 5.3.1. Cloud Service Providers
- 5.3.2. Telecom Service Providers
- 5.4. Market Analysis, Insights and Forecast - by Region
- 5.4.1. North America
- 5.4.2. Europe
- 5.4.3. Asia Pacific
- 5.4.4. Latin America
- 5.4.5. Middle East
- 5.1. Market Analysis, Insights and Forecast - by Solution
- 6. North America Fabric Data Center Industry Analysis, Insights and Forecast, 2019-2031
- 6.1. Market Analysis, Insights and Forecast - by Solution
- 6.1.1. Router
- 6.1.2. Switches
- 6.1.3. Storage Area Networking
- 6.1.4. Other Solutions
- 6.2. Market Analysis, Insights and Forecast - by Application
- 6.2.1. IT & Communication
- 6.2.2. Banking & Financial Services
- 6.2.3. Healthcare
- 6.2.4. Retail
- 6.2.5. Other Applications
- 6.3. Market Analysis, Insights and Forecast - by End User
- 6.3.1. Cloud Service Providers
- 6.3.2. Telecom Service Providers
- 6.1. Market Analysis, Insights and Forecast - by Solution
- 7. Europe Fabric Data Center Industry Analysis, Insights and Forecast, 2019-2031
- 7.1. Market Analysis, Insights and Forecast - by Solution
- 7.1.1. Router
- 7.1.2. Switches
- 7.1.3. Storage Area Networking
- 7.1.4. Other Solutions
- 7.2. Market Analysis, Insights and Forecast - by Application
- 7.2.1. IT & Communication
- 7.2.2. Banking & Financial Services
- 7.2.3. Healthcare
- 7.2.4. Retail
- 7.2.5. Other Applications
- 7.3. Market Analysis, Insights and Forecast - by End User
- 7.3.1. Cloud Service Providers
- 7.3.2. Telecom Service Providers
- 7.1. Market Analysis, Insights and Forecast - by Solution
- 8. Asia Pacific Fabric Data Center Industry Analysis, Insights and Forecast, 2019-2031
- 8.1. Market Analysis, Insights and Forecast - by Solution
- 8.1.1. Router
- 8.1.2. Switches
- 8.1.3. Storage Area Networking
- 8.1.4. Other Solutions
- 8.2. Market Analysis, Insights and Forecast - by Application
- 8.2.1. IT & Communication
- 8.2.2. Banking & Financial Services
- 8.2.3. Healthcare
- 8.2.4. Retail
- 8.2.5. Other Applications
- 8.3. Market Analysis, Insights and Forecast - by End User
- 8.3.1. Cloud Service Providers
- 8.3.2. Telecom Service Providers
- 8.1. Market Analysis, Insights and Forecast - by Solution
- 9. Latin America Fabric Data Center Industry Analysis, Insights and Forecast, 2019-2031
- 9.1. Market Analysis, Insights and Forecast - by Solution
- 9.1.1. Router
- 9.1.2. Switches
- 9.1.3. Storage Area Networking
- 9.1.4. Other Solutions
- 9.2. Market Analysis, Insights and Forecast - by Application
- 9.2.1. IT & Communication
- 9.2.2. Banking & Financial Services
- 9.2.3. Healthcare
- 9.2.4. Retail
- 9.2.5. Other Applications
- 9.3. Market Analysis, Insights and Forecast - by End User
- 9.3.1. Cloud Service Providers
- 9.3.2. Telecom Service Providers
- 9.1. Market Analysis, Insights and Forecast - by Solution
- 10. Middle East Fabric Data Center Industry Analysis, Insights and Forecast, 2019-2031
- 10.1. Market Analysis, Insights and Forecast - by Solution
- 10.1.1. Router
- 10.1.2. Switches
- 10.1.3. Storage Area Networking
- 10.1.4. Other Solutions
- 10.2. Market Analysis, Insights and Forecast - by Application
- 10.2.1. IT & Communication
- 10.2.2. Banking & Financial Services
- 10.2.3. Healthcare
- 10.2.4. Retail
- 10.2.5. Other Applications
- 10.3. Market Analysis, Insights and Forecast - by End User
- 10.3.1. Cloud Service Providers
- 10.3.2. Telecom Service Providers
- 10.1. Market Analysis, Insights and Forecast - by Solution
- 11. North America Fabric Data Center Industry Analysis, Insights and Forecast, 2019-2031
- 11.1. Market Analysis, Insights and Forecast - By Country/Sub-region
- 11.1.1 United States
- 11.1.2 Canada
- 11.1.3 Mexico
- 12. Europe Fabric Data Center Industry Analysis, Insights and Forecast, 2019-2031
- 12.1. Market Analysis, Insights and Forecast - By Country/Sub-region
- 12.1.1 Germany
- 12.1.2 United Kingdom
- 12.1.3 France
- 12.1.4 Spain
- 12.1.5 Italy
- 12.1.6 Spain
- 12.1.7 Belgium
- 12.1.8 Netherland
- 12.1.9 Nordics
- 12.1.10 Rest of Europe
- 13. Asia Pacific Fabric Data Center Industry Analysis, Insights and Forecast, 2019-2031
- 13.1. Market Analysis, Insights and Forecast - By Country/Sub-region
- 13.1.1 China
- 13.1.2 Japan
- 13.1.3 India
- 13.1.4 South Korea
- 13.1.5 Southeast Asia
- 13.1.6 Australia
- 13.1.7 Indonesia
- 13.1.8 Phillipes
- 13.1.9 Singapore
- 13.1.10 Thailandc
- 13.1.11 Rest of Asia Pacific
- 14. South America Fabric Data Center Industry Analysis, Insights and Forecast, 2019-2031
- 14.1. Market Analysis, Insights and Forecast - By Country/Sub-region
- 14.1.1 Brazil
- 14.1.2 Argentina
- 14.1.3 Peru
- 14.1.4 Chile
- 14.1.5 Colombia
- 14.1.6 Ecuador
- 14.1.7 Venezuela
- 14.1.8 Rest of South America
- 15. North America Fabric Data Center Industry Analysis, Insights and Forecast, 2019-2031
- 15.1. Market Analysis, Insights and Forecast - By Country/Sub-region
- 15.1.1 United States
- 15.1.2 Canada
- 15.1.3 Mexico
- 16. MEA Fabric Data Center Industry Analysis, Insights and Forecast, 2019-2031
- 16.1. Market Analysis, Insights and Forecast - By Country/Sub-region
- 16.1.1 United Arab Emirates
- 16.1.2 Saudi Arabia
- 16.1.3 South Africa
- 16.1.4 Rest of Middle East and Africa
- 17. Competitive Analysis
- 17.1. Global Market Share Analysis 2024
- 17.2. Company Profiles
- 17.2.1 IBM Corporation
- 17.2.1.1. Overview
- 17.2.1.2. Products
- 17.2.1.3. SWOT Analysis
- 17.2.1.4. Recent Developments
- 17.2.1.5. Financials (Based on Availability)
- 17.2.2 Alcatel-Lucent Holdings Inc
- 17.2.2.1. Overview
- 17.2.2.2. Products
- 17.2.2.3. SWOT Analysis
- 17.2.2.4. Recent Developments
- 17.2.2.5. Financials (Based on Availability)
- 17.2.3 Unisys Corporation
- 17.2.3.1. Overview
- 17.2.3.2. Products
- 17.2.3.3. SWOT Analysis
- 17.2.3.4. Recent Developments
- 17.2.3.5. Financials (Based on Availability)
- 17.2.4 Cisco Systems Inc
- 17.2.4.1. Overview
- 17.2.4.2. Products
- 17.2.4.3. SWOT Analysis
- 17.2.4.4. Recent Developments
- 17.2.4.5. Financials (Based on Availability)
- 17.2.5 Avaya Inc
- 17.2.5.1. Overview
- 17.2.5.2. Products
- 17.2.5.3. SWOT Analysis
- 17.2.5.4. Recent Developments
- 17.2.5.5. Financials (Based on Availability)
- 17.2.6 Extreme Networks Inc
- 17.2.6.1. Overview
- 17.2.6.2. Products
- 17.2.6.3. SWOT Analysis
- 17.2.6.4. Recent Developments
- 17.2.6.5. Financials (Based on Availability)
- 17.2.7 Dell Inc
- 17.2.7.1. Overview
- 17.2.7.2. Products
- 17.2.7.3. SWOT Analysis
- 17.2.7.4. Recent Developments
- 17.2.7.5. Financials (Based on Availability)
- 17.2.8 Huawei Technologies Co Ltd
- 17.2.8.1. Overview
- 17.2.8.2. Products
- 17.2.8.3. SWOT Analysis
- 17.2.8.4. Recent Developments
- 17.2.8.5. Financials (Based on Availability)
- 17.2.9 Hewlett-Packard Enterprise Company
- 17.2.9.1. Overview
- 17.2.9.2. Products
- 17.2.9.3. SWOT Analysis
- 17.2.9.4. Recent Developments
- 17.2.9.5. Financials (Based on Availability)
- 17.2.10 Oracle Corporation
- 17.2.10.1. Overview
- 17.2.10.2. Products
- 17.2.10.3. SWOT Analysis
- 17.2.10.4. Recent Developments
- 17.2.10.5. Financials (Based on Availability)
- 17.2.11 Brocade Communications Systems
- 17.2.11.1. Overview
- 17.2.11.2. Products
- 17.2.11.3. SWOT Analysis
- 17.2.11.4. Recent Developments
- 17.2.11.5. Financials (Based on Availability)
- 17.2.1 IBM Corporation
List of Figures
- Figure 1: Global Fabric Data Center Industry Revenue Breakdown (Million, %) by Region 2024 & 2032
- Figure 2: North America Fabric Data Center Industry Revenue (Million), by Country 2024 & 2032
- Figure 3: North America Fabric Data Center Industry Revenue Share (%), by Country 2024 & 2032
- Figure 4: Europe Fabric Data Center Industry Revenue (Million), by Country 2024 & 2032
- Figure 5: Europe Fabric Data Center Industry Revenue Share (%), by Country 2024 & 2032
- Figure 6: Asia Pacific Fabric Data Center Industry Revenue (Million), by Country 2024 & 2032
- Figure 7: Asia Pacific Fabric Data Center Industry Revenue Share (%), by Country 2024 & 2032
- Figure 8: South America Fabric Data Center Industry Revenue (Million), by Country 2024 & 2032
- Figure 9: South America Fabric Data Center Industry Revenue Share (%), by Country 2024 & 2032
- Figure 10: North America Fabric Data Center Industry Revenue (Million), by Country 2024 & 2032
- Figure 11: North America Fabric Data Center Industry Revenue Share (%), by Country 2024 & 2032
- Figure 12: MEA Fabric Data Center Industry Revenue (Million), by Country 2024 & 2032
- Figure 13: MEA Fabric Data Center Industry Revenue Share (%), by Country 2024 & 2032
- Figure 14: North America Fabric Data Center Industry Revenue (Million), by Solution 2024 & 2032
- Figure 15: North America Fabric Data Center Industry Revenue Share (%), by Solution 2024 & 2032
- Figure 16: North America Fabric Data Center Industry Revenue (Million), by Application 2024 & 2032
- Figure 17: North America Fabric Data Center Industry Revenue Share (%), by Application 2024 & 2032
- Figure 18: North America Fabric Data Center Industry Revenue (Million), by End User 2024 & 2032
- Figure 19: North America Fabric Data Center Industry Revenue Share (%), by End User 2024 & 2032
- Figure 20: North America Fabric Data Center Industry Revenue (Million), by Country 2024 & 2032
- Figure 21: North America Fabric Data Center Industry Revenue Share (%), by Country 2024 & 2032
- Figure 22: Europe Fabric Data Center Industry Revenue (Million), by Solution 2024 & 2032
- Figure 23: Europe Fabric Data Center Industry Revenue Share (%), by Solution 2024 & 2032
- Figure 24: Europe Fabric Data Center Industry Revenue (Million), by Application 2024 & 2032
- Figure 25: Europe Fabric Data Center Industry Revenue Share (%), by Application 2024 & 2032
- Figure 26: Europe Fabric Data Center Industry Revenue (Million), by End User 2024 & 2032
- Figure 27: Europe Fabric Data Center Industry Revenue Share (%), by End User 2024 & 2032
- Figure 28: Europe Fabric Data Center Industry Revenue (Million), by Country 2024 & 2032
- Figure 29: Europe Fabric Data Center Industry Revenue Share (%), by Country 2024 & 2032
- Figure 30: Asia Pacific Fabric Data Center Industry Revenue (Million), by Solution 2024 & 2032
- Figure 31: Asia Pacific Fabric Data Center Industry Revenue Share (%), by Solution 2024 & 2032
- Figure 32: Asia Pacific Fabric Data Center Industry Revenue (Million), by Application 2024 & 2032
- Figure 33: Asia Pacific Fabric Data Center Industry Revenue Share (%), by Application 2024 & 2032
- Figure 34: Asia Pacific Fabric Data Center Industry Revenue (Million), by End User 2024 & 2032
- Figure 35: Asia Pacific Fabric Data Center Industry Revenue Share (%), by End User 2024 & 2032
- Figure 36: Asia Pacific Fabric Data Center Industry Revenue (Million), by Country 2024 & 2032
- Figure 37: Asia Pacific Fabric Data Center Industry Revenue Share (%), by Country 2024 & 2032
- Figure 38: Latin America Fabric Data Center Industry Revenue (Million), by Solution 2024 & 2032
- Figure 39: Latin America Fabric Data Center Industry Revenue Share (%), by Solution 2024 & 2032
- Figure 40: Latin America Fabric Data Center Industry Revenue (Million), by Application 2024 & 2032
- Figure 41: Latin America Fabric Data Center Industry Revenue Share (%), by Application 2024 & 2032
- Figure 42: Latin America Fabric Data Center Industry Revenue (Million), by End User 2024 & 2032
- Figure 43: Latin America Fabric Data Center Industry Revenue Share (%), by End User 2024 & 2032
- Figure 44: Latin America Fabric Data Center Industry Revenue (Million), by Country 2024 & 2032
- Figure 45: Latin America Fabric Data Center Industry Revenue Share (%), by Country 2024 & 2032
- Figure 46: Middle East Fabric Data Center Industry Revenue (Million), by Solution 2024 & 2032
- Figure 47: Middle East Fabric Data Center Industry Revenue Share (%), by Solution 2024 & 2032
- Figure 48: Middle East Fabric Data Center Industry Revenue (Million), by Application 2024 & 2032
- Figure 49: Middle East Fabric Data Center Industry Revenue Share (%), by Application 2024 & 2032
- Figure 50: Middle East Fabric Data Center Industry Revenue (Million), by End User 2024 & 2032
- Figure 51: Middle East Fabric Data Center Industry Revenue Share (%), by End User 2024 & 2032
- Figure 52: Middle East Fabric Data Center Industry Revenue (Million), by Country 2024 & 2032
- Figure 53: Middle East Fabric Data Center Industry Revenue Share (%), by Country 2024 & 2032
List of Tables
- Table 1: Global Fabric Data Center Industry Revenue Million Forecast, by Region 2019 & 2032
- Table 2: Global Fabric Data Center Industry Revenue Million Forecast, by Solution 2019 & 2032
- Table 3: Global Fabric Data Center Industry Revenue Million Forecast, by Application 2019 & 2032
- Table 4: Global Fabric Data Center Industry Revenue Million Forecast, by End User 2019 & 2032
- Table 5: Global Fabric Data Center Industry Revenue Million Forecast, by Region 2019 & 2032
- Table 6: Global Fabric Data Center Industry Revenue Million Forecast, by Country 2019 & 2032
- Table 7: United States Fabric Data Center Industry Revenue (Million) Forecast, by Application 2019 & 2032
- Table 8: Canada Fabric Data Center Industry Revenue (Million) Forecast, by Application 2019 & 2032
- Table 9: Mexico Fabric Data Center Industry Revenue (Million) Forecast, by Application 2019 & 2032
- Table 10: Global Fabric Data Center Industry Revenue Million Forecast, by Country 2019 & 2032
- Table 11: Germany Fabric Data Center Industry Revenue (Million) Forecast, by Application 2019 & 2032
- Table 12: United Kingdom Fabric Data Center Industry Revenue (Million) Forecast, by Application 2019 & 2032
- Table 13: France Fabric Data Center Industry Revenue (Million) Forecast, by Application 2019 & 2032
- Table 14: Spain Fabric Data Center Industry Revenue (Million) Forecast, by Application 2019 & 2032
- Table 15: Italy Fabric Data Center Industry Revenue (Million) Forecast, by Application 2019 & 2032
- Table 16: Spain Fabric Data Center Industry Revenue (Million) Forecast, by Application 2019 & 2032
- Table 17: Belgium Fabric Data Center Industry Revenue (Million) Forecast, by Application 2019 & 2032
- Table 18: Netherland Fabric Data Center Industry Revenue (Million) Forecast, by Application 2019 & 2032
- Table 19: Nordics Fabric Data Center Industry Revenue (Million) Forecast, by Application 2019 & 2032
- Table 20: Rest of Europe Fabric Data Center Industry Revenue (Million) Forecast, by Application 2019 & 2032
- Table 21: Global Fabric Data Center Industry Revenue Million Forecast, by Country 2019 & 2032
- Table 22: China Fabric Data Center Industry Revenue (Million) Forecast, by Application 2019 & 2032
- Table 23: Japan Fabric Data Center Industry Revenue (Million) Forecast, by Application 2019 & 2032
- Table 24: India Fabric Data Center Industry Revenue (Million) Forecast, by Application 2019 & 2032
- Table 25: South Korea Fabric Data Center Industry Revenue (Million) Forecast, by Application 2019 & 2032
- Table 26: Southeast Asia Fabric Data Center Industry Revenue (Million) Forecast, by Application 2019 & 2032
- Table 27: Australia Fabric Data Center Industry Revenue (Million) Forecast, by Application 2019 & 2032
- Table 28: Indonesia Fabric Data Center Industry Revenue (Million) Forecast, by Application 2019 & 2032
- Table 29: Phillipes Fabric Data Center Industry Revenue (Million) Forecast, by Application 2019 & 2032
- Table 30: Singapore Fabric Data Center Industry Revenue (Million) Forecast, by Application 2019 & 2032
- Table 31: Thailandc Fabric Data Center Industry Revenue (Million) Forecast, by Application 2019 & 2032
- Table 32: Rest of Asia Pacific Fabric Data Center Industry Revenue (Million) Forecast, by Application 2019 & 2032
- Table 33: Global Fabric Data Center Industry Revenue Million Forecast, by Country 2019 & 2032
- Table 34: Brazil Fabric Data Center Industry Revenue (Million) Forecast, by Application 2019 & 2032
- Table 35: Argentina Fabric Data Center Industry Revenue (Million) Forecast, by Application 2019 & 2032
- Table 36: Peru Fabric Data Center Industry Revenue (Million) Forecast, by Application 2019 & 2032
- Table 37: Chile Fabric Data Center Industry Revenue (Million) Forecast, by Application 2019 & 2032
- Table 38: Colombia Fabric Data Center Industry Revenue (Million) Forecast, by Application 2019 & 2032
- Table 39: Ecuador Fabric Data Center Industry Revenue (Million) Forecast, by Application 2019 & 2032
- Table 40: Venezuela Fabric Data Center Industry Revenue (Million) Forecast, by Application 2019 & 2032
- Table 41: Rest of South America Fabric Data Center Industry Revenue (Million) Forecast, by Application 2019 & 2032
- Table 42: Global Fabric Data Center Industry Revenue Million Forecast, by Country 2019 & 2032
- Table 43: United States Fabric Data Center Industry Revenue (Million) Forecast, by Application 2019 & 2032
- Table 44: Canada Fabric Data Center Industry Revenue (Million) Forecast, by Application 2019 & 2032
- Table 45: Mexico Fabric Data Center Industry Revenue (Million) Forecast, by Application 2019 & 2032
- Table 46: Global Fabric Data Center Industry Revenue Million Forecast, by Country 2019 & 2032
- Table 47: United Arab Emirates Fabric Data Center Industry Revenue (Million) Forecast, by Application 2019 & 2032
- Table 48: Saudi Arabia Fabric Data Center Industry Revenue (Million) Forecast, by Application 2019 & 2032
- Table 49: South Africa Fabric Data Center Industry Revenue (Million) Forecast, by Application 2019 & 2032
- Table 50: Rest of Middle East and Africa Fabric Data Center Industry Revenue (Million) Forecast, by Application 2019 & 2032
- Table 51: Global Fabric Data Center Industry Revenue Million Forecast, by Solution 2019 & 2032
- Table 52: Global Fabric Data Center Industry Revenue Million Forecast, by Application 2019 & 2032
- Table 53: Global Fabric Data Center Industry Revenue Million Forecast, by End User 2019 & 2032
- Table 54: Global Fabric Data Center Industry Revenue Million Forecast, by Country 2019 & 2032
- Table 55: Global Fabric Data Center Industry Revenue Million Forecast, by Solution 2019 & 2032
- Table 56: Global Fabric Data Center Industry Revenue Million Forecast, by Application 2019 & 2032
- Table 57: Global Fabric Data Center Industry Revenue Million Forecast, by End User 2019 & 2032
- Table 58: Global Fabric Data Center Industry Revenue Million Forecast, by Country 2019 & 2032
- Table 59: Global Fabric Data Center Industry Revenue Million Forecast, by Solution 2019 & 2032
- Table 60: Global Fabric Data Center Industry Revenue Million Forecast, by Application 2019 & 2032
- Table 61: Global Fabric Data Center Industry Revenue Million Forecast, by End User 2019 & 2032
- Table 62: Global Fabric Data Center Industry Revenue Million Forecast, by Country 2019 & 2032
- Table 63: Global Fabric Data Center Industry Revenue Million Forecast, by Solution 2019 & 2032
- Table 64: Global Fabric Data Center Industry Revenue Million Forecast, by Application 2019 & 2032
- Table 65: Global Fabric Data Center Industry Revenue Million Forecast, by End User 2019 & 2032
- Table 66: Global Fabric Data Center Industry Revenue Million Forecast, by Country 2019 & 2032
- Table 67: Global Fabric Data Center Industry Revenue Million Forecast, by Solution 2019 & 2032
- Table 68: Global Fabric Data Center Industry Revenue Million Forecast, by Application 2019 & 2032
- Table 69: Global Fabric Data Center Industry Revenue Million Forecast, by End User 2019 & 2032
- Table 70: Global Fabric Data Center Industry Revenue Million Forecast, by Country 2019 & 2032
Frequently Asked Questions
1. What is the projected Compound Annual Growth Rate (CAGR) of the Fabric Data Center Industry?
The projected CAGR is approximately 28.90%.
2. Which companies are prominent players in the Fabric Data Center Industry?
Key companies in the market include IBM Corporation, Alcatel-Lucent Holdings Inc, Unisys Corporation, Cisco Systems Inc, Avaya Inc, Extreme Networks Inc, Dell Inc, Huawei Technologies Co Ltd, Hewlett-Packard Enterprise Company, Oracle Corporation, Brocade Communications Systems.
3. What are the main segments of the Fabric Data Center Industry?
The market segments include Solution, Application, End User.
4. Can you provide details about the market size?
The market size is estimated to be USD 2.31 Million as of 2022.
5. What are some drivers contributing to market growth?
Increasing Demand for Data Storage and Adoption of Cloud Computing; Need for High Speed Data Transfer; Increasing Demand of Fabric Switches.
6. What are the notable trends driving market growth?
Increasing Demand of Fabric Switches is Driving the Market.
7. Are there any restraints impacting market growth?
Security issues.
8. Can you provide examples of recent developments in the market?
July 2023: Huawei's announced three innovative data center facility solutions as unveiled the next-generation indirect evaporative cooling solution EHU and the mobile intelligent management solution iManager-M. These scenario-based data center solutions promise optimal reliability throughout the lifecycle and aim to drive the high-quality development of the data center industry.
9. What pricing options are available for accessing the report?
Pricing options include single-user, multi-user, and enterprise licenses priced at USD 4750, USD 5250, and USD 8750 respectively.
10. Is the market size provided in terms of value or volume?
The market size is provided in terms of value, measured in Million.
11. Are there any specific market keywords associated with the report?
Yes, the market keyword associated with the report is "Fabric Data Center Industry," which aids in identifying and referencing the specific market segment covered.
12. How do I determine which pricing option suits my needs best?
The pricing options vary based on user requirements and access needs. Individual users may opt for single-user licenses, while businesses requiring broader access may choose multi-user or enterprise licenses for cost-effective access to the report.
13. Are there any additional resources or data provided in the Fabric Data Center Industry report?
While the report offers comprehensive insights, it's advisable to review the specific contents or supplementary materials provided to ascertain if additional resources or data are available.
14. How can I stay updated on further developments or reports in the Fabric Data Center Industry?
To stay informed about further developments, trends, and reports in the Fabric Data Center Industry, consider subscribing to industry newsletters, following relevant companies and organizations, or regularly checking reputable industry news sources and publications.
Methodology
Step 1 - Identification of Relevant Samples Size from Population Database


Step 2 - Approaches for Defining Global Market Size (Value, Volume* & Price*)

Note*: In applicable scenarios
Step 3 - Data Sources
Primary Research
- Web Analytics
- Survey Reports
- Research Institute
- Latest Research Reports
- Opinion Leaders
Secondary Research
- Annual Reports
- White Paper
- Latest Press Release
- Industry Association
- Paid Database
- Investor Presentations

Step 4 - Data Triangulation
Involves using different sources of information in order to increase the validity of a study
These sources are likely to be stakeholders in a program - participants, other researchers, program staff, other community members, and so on.
Then we put all data in single framework & apply various statistical tools to find out the dynamic on the market.
During the analysis stage, feedback from the stakeholder groups would be compared to determine areas of agreement as well as areas of divergence


