
Key Insights
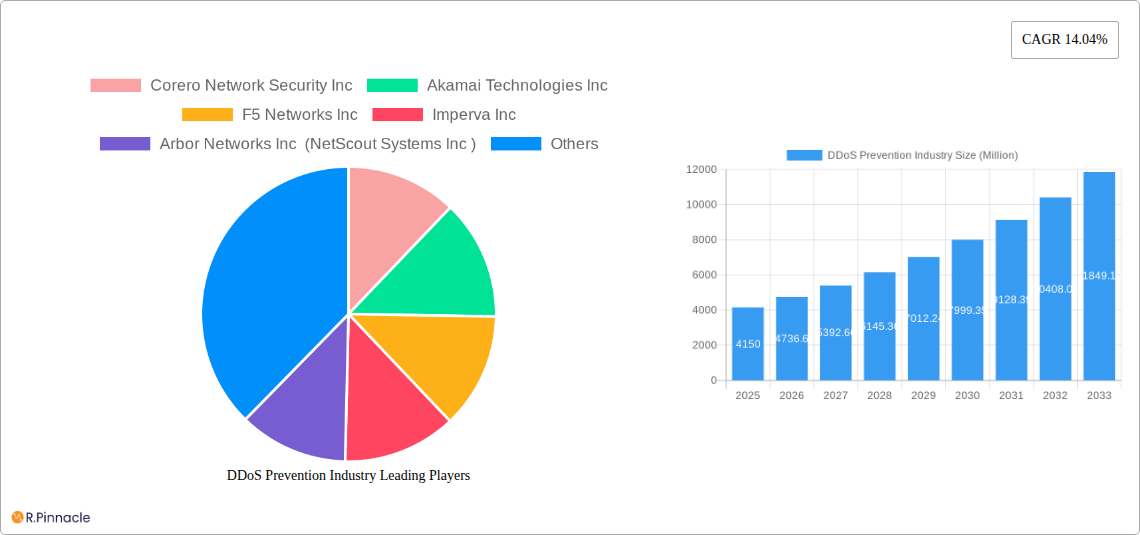
The DDoS prevention market, valued at $4.15 billion in 2025, is experiencing robust growth, projected to expand at a compound annual growth rate (CAGR) of 14.04% from 2025 to 2033. This significant expansion is driven by the increasing frequency and sophistication of distributed denial-of-service (DDoS) attacks targeting businesses across various sectors. The rising adoption of cloud computing, alongside the expanding digital landscape and reliance on interconnected systems, makes organizations increasingly vulnerable. Furthermore, the proliferation of IoT devices creates a larger attack surface, fueling market demand for robust DDoS mitigation solutions. Key growth segments include cloud-based deployment models, catering to the agility and scalability needs of modern businesses, and large enterprises with extensive digital infrastructures requiring comprehensive protection. Geographically, North America is expected to maintain a dominant market share due to early adoption of advanced security technologies and a high concentration of technology companies. However, regions like Asia-Pacific are poised for rapid growth, driven by increasing internet penetration and digital transformation initiatives across various industries. The market is segmented by component (solution, service), deployment type (cloud, on-premise, hybrid), enterprise size (small and medium enterprises, large enterprises), and end-user industry (government & defense, IT & telecommunication, healthcare, retail, BFSI, media & entertainment, others). Competitive pressures are high, with established players like Akamai and Cloudflare vying for market share alongside emerging specialized vendors.
The continued evolution of DDoS attack vectors, including the emergence of sophisticated, multi-vector attacks, will necessitate continuous innovation in DDoS prevention technologies. This includes advancements in AI and machine learning for threat detection and response, and the development of more effective mitigation strategies to counter increasingly complex attacks. Regulatory compliance requirements around data security and cyber resilience are also adding impetus to market expansion. While cost can remain a barrier for smaller organizations, the long-term costs associated with downtime and data breaches significantly outweigh the investment in robust DDoS prevention measures, creating a compelling case for adoption across all enterprise sizes. The market's growth trajectory is expected to remain strong, with continued investment in research and development driving the innovation necessary to counter the ever-evolving threat landscape.
DDoS Prevention Industry Report: 2019-2033 Forecast
This comprehensive report provides a detailed analysis of the DDoS Prevention industry, offering invaluable insights for industry professionals, investors, and strategic decision-makers. The report covers the period 2019-2033, with a focus on the forecast period 2025-2033 and a base year of 2025. The analysis encompasses market size, segmentation, key players, technological advancements, and future growth potential, providing a 360-degree view of this rapidly evolving market. The estimated market value in 2025 is projected to be in the range of $XX Billion.
DDoS Prevention Industry Market Structure & Innovation Trends
This section analyzes the competitive landscape of the DDoS Prevention market, encompassing market concentration, innovation drivers, regulatory frameworks, product substitutes, end-user demographics, and mergers & acquisitions (M&A) activities. The market is moderately concentrated, with key players such as Akamai Technologies, Cloudflare, and F5 Networks holding significant market share. However, the presence of numerous smaller players indicates a dynamic competitive environment.
Market Share: Akamai Technologies holds an estimated xx% market share in 2025, followed by Cloudflare at xx% and F5 Networks at xx%. The remaining share is distributed among other players including Corero Network Security, Imperva, Arbor Networks, Neustar, Radware, Verisign, Nexusguard, Dosarrest Internet Security.
Innovation Drivers: The increasing sophistication of DDoS attacks, coupled with the growing reliance on internet-based services across various industries, drives continuous innovation in DDoS prevention technologies. Key drivers include advancements in AI/ML-based threat detection, cloud-based solutions, and automation.
Regulatory Frameworks: Government regulations regarding data security and cybersecurity compliance significantly influence the market. Compliance requirements drive adoption of robust DDoS prevention solutions, especially in sectors like BFSI and Government & Defense.
M&A Activities: The industry has witnessed several M&A activities in recent years, with deal values exceeding $XX Billion in the historical period. These activities aim to expand product portfolios, enhance technological capabilities, and strengthen market positions. Consolidation is expected to continue, shaping the future competitive landscape.
DDoS Prevention Industry Market Dynamics & Trends
This section explores the factors driving market growth, technological disruptions, consumer preferences, and competitive dynamics within the DDoS Prevention industry. The market is experiencing robust growth, driven by the escalating frequency and severity of DDoS attacks targeting businesses and governments globally.
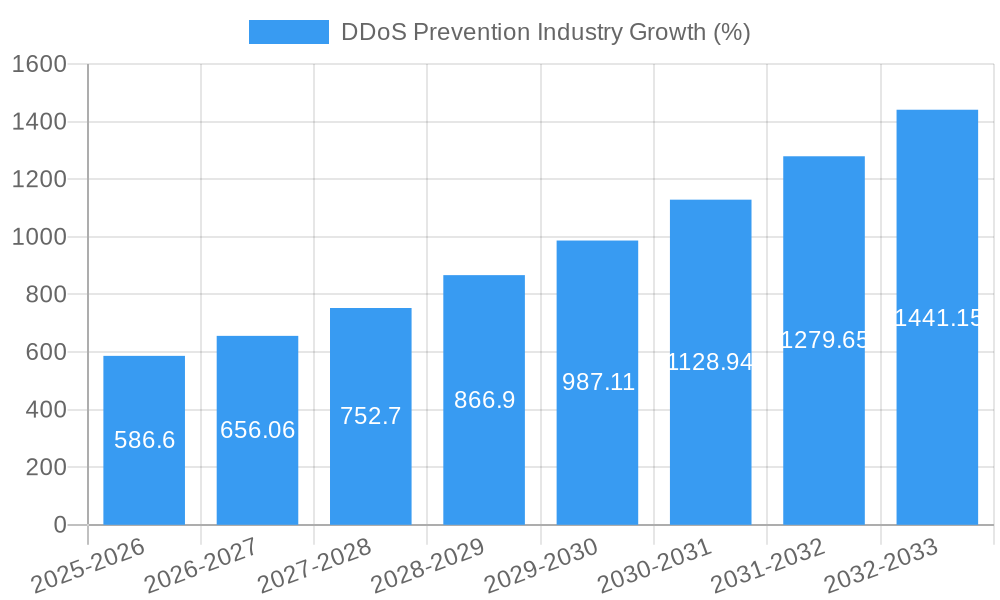
The Compound Annual Growth Rate (CAGR) during the forecast period (2025-2033) is estimated at xx%, indicating substantial market expansion. Market penetration is expected to increase significantly as awareness of cyber threats rises and organizations prioritize robust security solutions. Technological disruptions like AI-powered threat detection and automated mitigation systems are revolutionizing the industry, contributing to market growth. Consumer preference shifts towards cloud-based solutions and hybrid deployments are reshaping the market landscape. Furthermore, increasing integration of DDoS protection within broader security platforms and the growth of edge computing are also significant drivers.
Dominant Regions & Segments in DDoS Prevention Industry
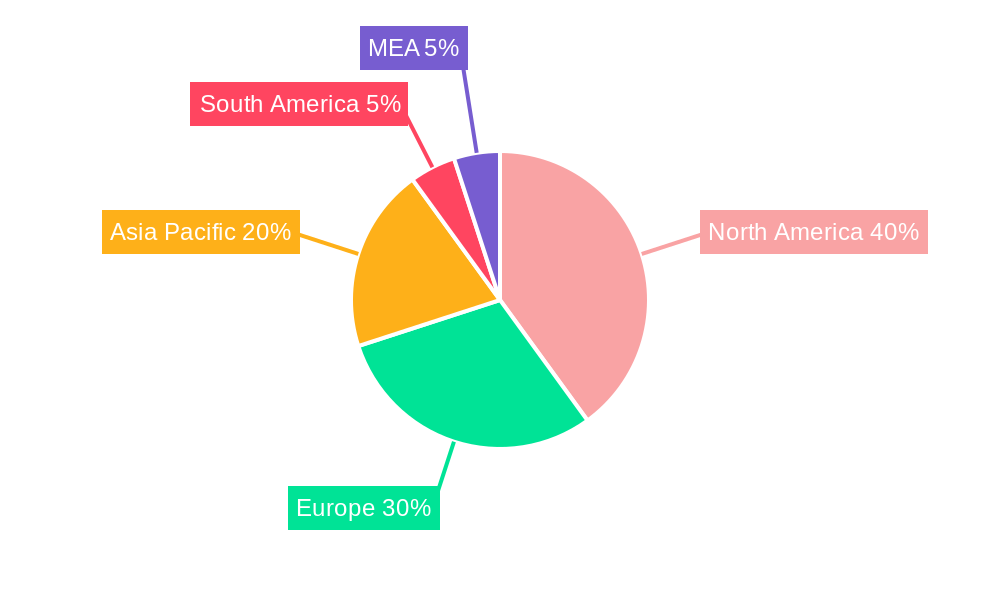
This section identifies the leading regions, countries, and market segments within the DDoS Prevention industry. North America and Europe are currently the dominant regions, driven by high adoption rates of advanced security technologies and stringent regulatory environments. However, the Asia-Pacific region is exhibiting high growth potential due to rapid digitalization and increasing internet penetration.
Key Drivers:
- North America: Strong regulatory environment, high adoption of cloud services, advanced technological infrastructure.
- Europe: Growing awareness of cyber threats, stringent data privacy regulations, robust IT infrastructure.
- Asia-Pacific: Rapid digitalization, increasing internet penetration, substantial investments in infrastructure.
Dominant Segments:
- Component: Solutions dominate the market due to their comprehensive nature and ability to address diverse attack vectors.
- Service: Managed security services are gaining popularity due to their ease of implementation and cost-effectiveness.
- Deployment Type: Cloud-based deployments are experiencing rapid growth, driven by scalability, flexibility, and cost benefits.
- Enterprise Size: Large enterprises represent the largest segment due to their high reliance on internet-based services and critical data assets.
- End-user Industry: The Government & Defense, IT & Telecommunication, and BFSI sectors represent the most significant end-user segments due to their critical dependence on internet infrastructure and the potential impact of attacks.
DDoS Prevention Industry Product Innovations
The DDoS prevention market is witnessing rapid innovation, driven by the evolution of DDoS attack methods. New products incorporate advanced technologies such as AI, machine learning, and automation to improve threat detection, mitigation, and response times. These solutions offer enhanced accuracy in identifying malicious traffic, thereby minimizing false positives and improving overall system performance. The market is moving toward more integrated and comprehensive security platforms that seamlessly integrate DDoS protection with other critical security functions. The focus on cloud-based and hybrid deployments is increasing to meet the diverse needs of businesses.
Report Scope & Segmentation Analysis
This report comprehensively segments the DDoS Prevention market based on component (solution, service), deployment type (cloud, on-premise, hybrid), enterprise size (small and medium enterprises (SMEs), large enterprises), and end-user industry (Government & Defense, IT & Telecommunication, Healthcare, Retail, BFSI, Media & Entertainment, Other). Each segment's growth projections, market size, and competitive dynamics are analyzed in detail. For example, the cloud deployment type is expected to witness significant growth due to scalability and flexibility. The large enterprise segment is projected to dominate due to high security budgets and critical infrastructure.
Key Drivers of DDoS Prevention Industry Growth
Several factors are propelling the growth of the DDoS prevention industry. The increasing frequency and sophistication of DDoS attacks are a primary driver, forcing organizations to invest heavily in robust security solutions. Growing reliance on internet-based services across various industries, the increasing adoption of cloud computing, and the stringent regulatory environment demanding robust data protection further fuel market expansion. The development of AI-powered solutions and the integration of DDoS mitigation within broader security platforms are also key catalysts for growth.
Challenges in the DDoS Prevention Industry Sector
The DDoS prevention industry faces challenges such as the ever-evolving nature of DDoS attacks, making it difficult to develop foolproof solutions. High implementation costs and the need for skilled professionals to manage complex systems present significant barriers for smaller organizations. Competition is fierce, requiring vendors to continually innovate and offer cost-effective solutions to stay ahead. The constantly evolving threat landscape demands continuous upgrades and adaptations to existing systems and security protocols.
Emerging Opportunities in DDoS Prevention Industry
Emerging opportunities exist in several areas, including the integration of DDoS protection within broader cybersecurity platforms, the expansion of solutions to address emerging attack vectors (e.g., IoT-based attacks), and the growth of managed security services. The development of AI-powered solutions, particularly in behavioral analysis, provides a significant area of growth. The adoption of edge computing offers opportunities to deploy DDoS protection closer to the source of attacks, thereby reducing latency and improving responsiveness.
Leading Players in the DDoS Prevention Industry Market
- Corero Network Security Inc
- Akamai Technologies Inc
- F5 Networks Inc
- Imperva Inc
- Arbor Networks Inc (NetScout Systems Inc)
- Neustar Inc
- Radware Ltd
- Cloudflare Inc
- Verisign Inc
- Nexusguard Ltd
- Dosarrest Internet Security Ltd
Key Developments in DDoS Prevention Industry
- September 2022: Liquid Networks launched a DDoS Secure offering, expanding services in the African region.
- April 2022: MazeBolt Technologies secured USD 10 Million in funding for its RADAR solution.
- January 2022: Bigleaf Networks launched an automated DDoS mitigation service.
Future Outlook for DDoS Prevention Industry Market
The DDoS prevention market is poised for continued growth, driven by the increasing sophistication and frequency of cyberattacks, the growing adoption of cloud-based services, and the expansion of the internet of things (IoT). Strategic opportunities exist for companies to develop innovative solutions that address emerging attack vectors and integrate DDoS protection within broader security platforms. The market will witness further consolidation, with larger players acquiring smaller companies to expand their product portfolios and market reach. Continued investment in AI and machine learning technologies will be critical for staying ahead of the evolving threat landscape.
DDoS Prevention Industry Segmentation
-
1. Component
- 1.1. Solution
- 1.2. Service
-
2. Deployment Type
- 2.1. Cloud
- 2.2. On-premise
- 2.3. Hybrid
-
3. Size of Enterprise
- 3.1. Small and Medium Enterprises
- 3.2. Large Enterprises
-
4. End-user Industry
- 4.1. Government and Defense
- 4.2. IT and Telecommunication
- 4.3. Healthcare
- 4.4. Retail
- 4.5. BFSI
- 4.6. Media and Entertainment
- 4.7. Other End-user Industries
DDoS Prevention Industry Segmentation By Geography
- 1. North America
- 2. Europe
- 3. Asia Pacific
- 4. Rest of the World
DDoS Prevention Industry REPORT HIGHLIGHTS
| Aspects | Details |
|---|---|
| Study Period | 2019-2033 |
| Base Year | 2024 |
| Estimated Year | 2025 |
| Forecast Period | 2025-2033 |
| Historical Period | 2019-2024 |
| Growth Rate | CAGR of 14.04% from 2019-2033 |
| Segmentation |
|
Table of Contents
- 1. Introduction
- 1.1. Research Scope
- 1.2. Market Segmentation
- 1.3. Research Methodology
- 1.4. Definitions and Assumptions
- 2. Executive Summary
- 2.1. Introduction
- 3. Market Dynamics
- 3.1. Introduction
- 3.2. Market Drivers
- 3.2.1. Increasing Instances of Sophisticated DDoS Attacks; Introduction of Cost-effective Cloud-based and Hybrid Solutions; Proliferation of Technology and Adoption of IoT across Various Verticals
- 3.3. Market Restrains
- 3.3.1. Lack of Skilled and Trained Personnel
- 3.4. Market Trends
- 3.4.1. Increasing Instances of Sophisticated DDoS Attacks to Drive the Market
- 4. Market Factor Analysis
- 4.1. Porters Five Forces
- 4.2. Supply/Value Chain
- 4.3. PESTEL analysis
- 4.4. Market Entropy
- 4.5. Patent/Trademark Analysis
- 5. Global DDoS Prevention Industry Analysis, Insights and Forecast, 2019-2031
- 5.1. Market Analysis, Insights and Forecast - by Component
- 5.1.1. Solution
- 5.1.2. Service
- 5.2. Market Analysis, Insights and Forecast - by Deployment Type
- 5.2.1. Cloud
- 5.2.2. On-premise
- 5.2.3. Hybrid
- 5.3. Market Analysis, Insights and Forecast - by Size of Enterprise
- 5.3.1. Small and Medium Enterprises
- 5.3.2. Large Enterprises
- 5.4. Market Analysis, Insights and Forecast - by End-user Industry
- 5.4.1. Government and Defense
- 5.4.2. IT and Telecommunication
- 5.4.3. Healthcare
- 5.4.4. Retail
- 5.4.5. BFSI
- 5.4.6. Media and Entertainment
- 5.4.7. Other End-user Industries
- 5.5. Market Analysis, Insights and Forecast - by Region
- 5.5.1. North America
- 5.5.2. Europe
- 5.5.3. Asia Pacific
- 5.5.4. Rest of the World
- 5.1. Market Analysis, Insights and Forecast - by Component
- 6. North America DDoS Prevention Industry Analysis, Insights and Forecast, 2019-2031
- 6.1. Market Analysis, Insights and Forecast - by Component
- 6.1.1. Solution
- 6.1.2. Service
- 6.2. Market Analysis, Insights and Forecast - by Deployment Type
- 6.2.1. Cloud
- 6.2.2. On-premise
- 6.2.3. Hybrid
- 6.3. Market Analysis, Insights and Forecast - by Size of Enterprise
- 6.3.1. Small and Medium Enterprises
- 6.3.2. Large Enterprises
- 6.4. Market Analysis, Insights and Forecast - by End-user Industry
- 6.4.1. Government and Defense
- 6.4.2. IT and Telecommunication
- 6.4.3. Healthcare
- 6.4.4. Retail
- 6.4.5. BFSI
- 6.4.6. Media and Entertainment
- 6.4.7. Other End-user Industries
- 6.1. Market Analysis, Insights and Forecast - by Component
- 7. Europe DDoS Prevention Industry Analysis, Insights and Forecast, 2019-2031
- 7.1. Market Analysis, Insights and Forecast - by Component
- 7.1.1. Solution
- 7.1.2. Service
- 7.2. Market Analysis, Insights and Forecast - by Deployment Type
- 7.2.1. Cloud
- 7.2.2. On-premise
- 7.2.3. Hybrid
- 7.3. Market Analysis, Insights and Forecast - by Size of Enterprise
- 7.3.1. Small and Medium Enterprises
- 7.3.2. Large Enterprises
- 7.4. Market Analysis, Insights and Forecast - by End-user Industry
- 7.4.1. Government and Defense
- 7.4.2. IT and Telecommunication
- 7.4.3. Healthcare
- 7.4.4. Retail
- 7.4.5. BFSI
- 7.4.6. Media and Entertainment
- 7.4.7. Other End-user Industries
- 7.1. Market Analysis, Insights and Forecast - by Component
- 8. Asia Pacific DDoS Prevention Industry Analysis, Insights and Forecast, 2019-2031
- 8.1. Market Analysis, Insights and Forecast - by Component
- 8.1.1. Solution
- 8.1.2. Service
- 8.2. Market Analysis, Insights and Forecast - by Deployment Type
- 8.2.1. Cloud
- 8.2.2. On-premise
- 8.2.3. Hybrid
- 8.3. Market Analysis, Insights and Forecast - by Size of Enterprise
- 8.3.1. Small and Medium Enterprises
- 8.3.2. Large Enterprises
- 8.4. Market Analysis, Insights and Forecast - by End-user Industry
- 8.4.1. Government and Defense
- 8.4.2. IT and Telecommunication
- 8.4.3. Healthcare
- 8.4.4. Retail
- 8.4.5. BFSI
- 8.4.6. Media and Entertainment
- 8.4.7. Other End-user Industries
- 8.1. Market Analysis, Insights and Forecast - by Component
- 9. Rest of the World DDoS Prevention Industry Analysis, Insights and Forecast, 2019-2031
- 9.1. Market Analysis, Insights and Forecast - by Component
- 9.1.1. Solution
- 9.1.2. Service
- 9.2. Market Analysis, Insights and Forecast - by Deployment Type
- 9.2.1. Cloud
- 9.2.2. On-premise
- 9.2.3. Hybrid
- 9.3. Market Analysis, Insights and Forecast - by Size of Enterprise
- 9.3.1. Small and Medium Enterprises
- 9.3.2. Large Enterprises
- 9.4. Market Analysis, Insights and Forecast - by End-user Industry
- 9.4.1. Government and Defense
- 9.4.2. IT and Telecommunication
- 9.4.3. Healthcare
- 9.4.4. Retail
- 9.4.5. BFSI
- 9.4.6. Media and Entertainment
- 9.4.7. Other End-user Industries
- 9.1. Market Analysis, Insights and Forecast - by Component
- 10. North America DDoS Prevention Industry Analysis, Insights and Forecast, 2019-2031
- 10.1. Market Analysis, Insights and Forecast - By Country/Sub-region
- 10.1.1 United States
- 10.1.2 Canada
- 10.1.3 Mexico
- 11. Europe DDoS Prevention Industry Analysis, Insights and Forecast, 2019-2031
- 11.1. Market Analysis, Insights and Forecast - By Country/Sub-region
- 11.1.1 Germany
- 11.1.2 United Kingdom
- 11.1.3 France
- 11.1.4 Spain
- 11.1.5 Italy
- 11.1.6 Spain
- 11.1.7 Belgium
- 11.1.8 Netherland
- 11.1.9 Nordics
- 11.1.10 Rest of Europe
- 12. Asia Pacific DDoS Prevention Industry Analysis, Insights and Forecast, 2019-2031
- 12.1. Market Analysis, Insights and Forecast - By Country/Sub-region
- 12.1.1 China
- 12.1.2 Japan
- 12.1.3 India
- 12.1.4 South Korea
- 12.1.5 Southeast Asia
- 12.1.6 Australia
- 12.1.7 Indonesia
- 12.1.8 Phillipes
- 12.1.9 Singapore
- 12.1.10 Thailandc
- 12.1.11 Rest of Asia Pacific
- 13. South America DDoS Prevention Industry Analysis, Insights and Forecast, 2019-2031
- 13.1. Market Analysis, Insights and Forecast - By Country/Sub-region
- 13.1.1 Brazil
- 13.1.2 Argentina
- 13.1.3 Peru
- 13.1.4 Chile
- 13.1.5 Colombia
- 13.1.6 Ecuador
- 13.1.7 Venezuela
- 13.1.8 Rest of South America
- 14. North America DDoS Prevention Industry Analysis, Insights and Forecast, 2019-2031
- 14.1. Market Analysis, Insights and Forecast - By Country/Sub-region
- 14.1.1 United States
- 14.1.2 Canada
- 14.1.3 Mexico
- 15. MEA DDoS Prevention Industry Analysis, Insights and Forecast, 2019-2031
- 15.1. Market Analysis, Insights and Forecast - By Country/Sub-region
- 15.1.1 United Arab Emirates
- 15.1.2 Saudi Arabia
- 15.1.3 South Africa
- 15.1.4 Rest of Middle East and Africa
- 16. Competitive Analysis
- 16.1. Global Market Share Analysis 2024
- 16.2. Company Profiles
- 16.2.1 Corero Network Security Inc
- 16.2.1.1. Overview
- 16.2.1.2. Products
- 16.2.1.3. SWOT Analysis
- 16.2.1.4. Recent Developments
- 16.2.1.5. Financials (Based on Availability)
- 16.2.2 Akamai Technologies Inc
- 16.2.2.1. Overview
- 16.2.2.2. Products
- 16.2.2.3. SWOT Analysis
- 16.2.2.4. Recent Developments
- 16.2.2.5. Financials (Based on Availability)
- 16.2.3 F5 Networks Inc
- 16.2.3.1. Overview
- 16.2.3.2. Products
- 16.2.3.3. SWOT Analysis
- 16.2.3.4. Recent Developments
- 16.2.3.5. Financials (Based on Availability)
- 16.2.4 Imperva Inc
- 16.2.4.1. Overview
- 16.2.4.2. Products
- 16.2.4.3. SWOT Analysis
- 16.2.4.4. Recent Developments
- 16.2.4.5. Financials (Based on Availability)
- 16.2.5 Arbor Networks Inc (NetScout Systems Inc )
- 16.2.5.1. Overview
- 16.2.5.2. Products
- 16.2.5.3. SWOT Analysis
- 16.2.5.4. Recent Developments
- 16.2.5.5. Financials (Based on Availability)
- 16.2.6 Neustar Inc
- 16.2.6.1. Overview
- 16.2.6.2. Products
- 16.2.6.3. SWOT Analysis
- 16.2.6.4. Recent Developments
- 16.2.6.5. Financials (Based on Availability)
- 16.2.7 Radware Ltd
- 16.2.7.1. Overview
- 16.2.7.2. Products
- 16.2.7.3. SWOT Analysis
- 16.2.7.4. Recent Developments
- 16.2.7.5. Financials (Based on Availability)
- 16.2.8 Cloudflare Inc
- 16.2.8.1. Overview
- 16.2.8.2. Products
- 16.2.8.3. SWOT Analysis
- 16.2.8.4. Recent Developments
- 16.2.8.5. Financials (Based on Availability)
- 16.2.9 Verisign Inc
- 16.2.9.1. Overview
- 16.2.9.2. Products
- 16.2.9.3. SWOT Analysis
- 16.2.9.4. Recent Developments
- 16.2.9.5. Financials (Based on Availability)
- 16.2.10 Nexusguard Ltd
- 16.2.10.1. Overview
- 16.2.10.2. Products
- 16.2.10.3. SWOT Analysis
- 16.2.10.4. Recent Developments
- 16.2.10.5. Financials (Based on Availability)
- 16.2.11 Dosarrest Internet Security Ltd
- 16.2.11.1. Overview
- 16.2.11.2. Products
- 16.2.11.3. SWOT Analysis
- 16.2.11.4. Recent Developments
- 16.2.11.5. Financials (Based on Availability)
- 16.2.1 Corero Network Security Inc
List of Figures
- Figure 1: Global DDoS Prevention Industry Revenue Breakdown (Million, %) by Region 2024 & 2032
- Figure 2: North America DDoS Prevention Industry Revenue (Million), by Country 2024 & 2032
- Figure 3: North America DDoS Prevention Industry Revenue Share (%), by Country 2024 & 2032
- Figure 4: Europe DDoS Prevention Industry Revenue (Million), by Country 2024 & 2032
- Figure 5: Europe DDoS Prevention Industry Revenue Share (%), by Country 2024 & 2032
- Figure 6: Asia Pacific DDoS Prevention Industry Revenue (Million), by Country 2024 & 2032
- Figure 7: Asia Pacific DDoS Prevention Industry Revenue Share (%), by Country 2024 & 2032
- Figure 8: South America DDoS Prevention Industry Revenue (Million), by Country 2024 & 2032
- Figure 9: South America DDoS Prevention Industry Revenue Share (%), by Country 2024 & 2032
- Figure 10: North America DDoS Prevention Industry Revenue (Million), by Country 2024 & 2032
- Figure 11: North America DDoS Prevention Industry Revenue Share (%), by Country 2024 & 2032
- Figure 12: MEA DDoS Prevention Industry Revenue (Million), by Country 2024 & 2032
- Figure 13: MEA DDoS Prevention Industry Revenue Share (%), by Country 2024 & 2032
- Figure 14: North America DDoS Prevention Industry Revenue (Million), by Component 2024 & 2032
- Figure 15: North America DDoS Prevention Industry Revenue Share (%), by Component 2024 & 2032
- Figure 16: North America DDoS Prevention Industry Revenue (Million), by Deployment Type 2024 & 2032
- Figure 17: North America DDoS Prevention Industry Revenue Share (%), by Deployment Type 2024 & 2032
- Figure 18: North America DDoS Prevention Industry Revenue (Million), by Size of Enterprise 2024 & 2032
- Figure 19: North America DDoS Prevention Industry Revenue Share (%), by Size of Enterprise 2024 & 2032
- Figure 20: North America DDoS Prevention Industry Revenue (Million), by End-user Industry 2024 & 2032
- Figure 21: North America DDoS Prevention Industry Revenue Share (%), by End-user Industry 2024 & 2032
- Figure 22: North America DDoS Prevention Industry Revenue (Million), by Country 2024 & 2032
- Figure 23: North America DDoS Prevention Industry Revenue Share (%), by Country 2024 & 2032
- Figure 24: Europe DDoS Prevention Industry Revenue (Million), by Component 2024 & 2032
- Figure 25: Europe DDoS Prevention Industry Revenue Share (%), by Component 2024 & 2032
- Figure 26: Europe DDoS Prevention Industry Revenue (Million), by Deployment Type 2024 & 2032
- Figure 27: Europe DDoS Prevention Industry Revenue Share (%), by Deployment Type 2024 & 2032
- Figure 28: Europe DDoS Prevention Industry Revenue (Million), by Size of Enterprise 2024 & 2032
- Figure 29: Europe DDoS Prevention Industry Revenue Share (%), by Size of Enterprise 2024 & 2032
- Figure 30: Europe DDoS Prevention Industry Revenue (Million), by End-user Industry 2024 & 2032
- Figure 31: Europe DDoS Prevention Industry Revenue Share (%), by End-user Industry 2024 & 2032
- Figure 32: Europe DDoS Prevention Industry Revenue (Million), by Country 2024 & 2032
- Figure 33: Europe DDoS Prevention Industry Revenue Share (%), by Country 2024 & 2032
- Figure 34: Asia Pacific DDoS Prevention Industry Revenue (Million), by Component 2024 & 2032
- Figure 35: Asia Pacific DDoS Prevention Industry Revenue Share (%), by Component 2024 & 2032
- Figure 36: Asia Pacific DDoS Prevention Industry Revenue (Million), by Deployment Type 2024 & 2032
- Figure 37: Asia Pacific DDoS Prevention Industry Revenue Share (%), by Deployment Type 2024 & 2032
- Figure 38: Asia Pacific DDoS Prevention Industry Revenue (Million), by Size of Enterprise 2024 & 2032
- Figure 39: Asia Pacific DDoS Prevention Industry Revenue Share (%), by Size of Enterprise 2024 & 2032
- Figure 40: Asia Pacific DDoS Prevention Industry Revenue (Million), by End-user Industry 2024 & 2032
- Figure 41: Asia Pacific DDoS Prevention Industry Revenue Share (%), by End-user Industry 2024 & 2032
- Figure 42: Asia Pacific DDoS Prevention Industry Revenue (Million), by Country 2024 & 2032
- Figure 43: Asia Pacific DDoS Prevention Industry Revenue Share (%), by Country 2024 & 2032
- Figure 44: Rest of the World DDoS Prevention Industry Revenue (Million), by Component 2024 & 2032
- Figure 45: Rest of the World DDoS Prevention Industry Revenue Share (%), by Component 2024 & 2032
- Figure 46: Rest of the World DDoS Prevention Industry Revenue (Million), by Deployment Type 2024 & 2032
- Figure 47: Rest of the World DDoS Prevention Industry Revenue Share (%), by Deployment Type 2024 & 2032
- Figure 48: Rest of the World DDoS Prevention Industry Revenue (Million), by Size of Enterprise 2024 & 2032
- Figure 49: Rest of the World DDoS Prevention Industry Revenue Share (%), by Size of Enterprise 2024 & 2032
- Figure 50: Rest of the World DDoS Prevention Industry Revenue (Million), by End-user Industry 2024 & 2032
- Figure 51: Rest of the World DDoS Prevention Industry Revenue Share (%), by End-user Industry 2024 & 2032
- Figure 52: Rest of the World DDoS Prevention Industry Revenue (Million), by Country 2024 & 2032
- Figure 53: Rest of the World DDoS Prevention Industry Revenue Share (%), by Country 2024 & 2032
List of Tables
- Table 1: Global DDoS Prevention Industry Revenue Million Forecast, by Region 2019 & 2032
- Table 2: Global DDoS Prevention Industry Revenue Million Forecast, by Component 2019 & 2032
- Table 3: Global DDoS Prevention Industry Revenue Million Forecast, by Deployment Type 2019 & 2032
- Table 4: Global DDoS Prevention Industry Revenue Million Forecast, by Size of Enterprise 2019 & 2032
- Table 5: Global DDoS Prevention Industry Revenue Million Forecast, by End-user Industry 2019 & 2032
- Table 6: Global DDoS Prevention Industry Revenue Million Forecast, by Region 2019 & 2032
- Table 7: Global DDoS Prevention Industry Revenue Million Forecast, by Country 2019 & 2032
- Table 8: United States DDoS Prevention Industry Revenue (Million) Forecast, by Application 2019 & 2032
- Table 9: Canada DDoS Prevention Industry Revenue (Million) Forecast, by Application 2019 & 2032
- Table 10: Mexico DDoS Prevention Industry Revenue (Million) Forecast, by Application 2019 & 2032
- Table 11: Global DDoS Prevention Industry Revenue Million Forecast, by Country 2019 & 2032
- Table 12: Germany DDoS Prevention Industry Revenue (Million) Forecast, by Application 2019 & 2032
- Table 13: United Kingdom DDoS Prevention Industry Revenue (Million) Forecast, by Application 2019 & 2032
- Table 14: France DDoS Prevention Industry Revenue (Million) Forecast, by Application 2019 & 2032
- Table 15: Spain DDoS Prevention Industry Revenue (Million) Forecast, by Application 2019 & 2032
- Table 16: Italy DDoS Prevention Industry Revenue (Million) Forecast, by Application 2019 & 2032
- Table 17: Spain DDoS Prevention Industry Revenue (Million) Forecast, by Application 2019 & 2032
- Table 18: Belgium DDoS Prevention Industry Revenue (Million) Forecast, by Application 2019 & 2032
- Table 19: Netherland DDoS Prevention Industry Revenue (Million) Forecast, by Application 2019 & 2032
- Table 20: Nordics DDoS Prevention Industry Revenue (Million) Forecast, by Application 2019 & 2032
- Table 21: Rest of Europe DDoS Prevention Industry Revenue (Million) Forecast, by Application 2019 & 2032
- Table 22: Global DDoS Prevention Industry Revenue Million Forecast, by Country 2019 & 2032
- Table 23: China DDoS Prevention Industry Revenue (Million) Forecast, by Application 2019 & 2032
- Table 24: Japan DDoS Prevention Industry Revenue (Million) Forecast, by Application 2019 & 2032
- Table 25: India DDoS Prevention Industry Revenue (Million) Forecast, by Application 2019 & 2032
- Table 26: South Korea DDoS Prevention Industry Revenue (Million) Forecast, by Application 2019 & 2032
- Table 27: Southeast Asia DDoS Prevention Industry Revenue (Million) Forecast, by Application 2019 & 2032
- Table 28: Australia DDoS Prevention Industry Revenue (Million) Forecast, by Application 2019 & 2032
- Table 29: Indonesia DDoS Prevention Industry Revenue (Million) Forecast, by Application 2019 & 2032
- Table 30: Phillipes DDoS Prevention Industry Revenue (Million) Forecast, by Application 2019 & 2032
- Table 31: Singapore DDoS Prevention Industry Revenue (Million) Forecast, by Application 2019 & 2032
- Table 32: Thailandc DDoS Prevention Industry Revenue (Million) Forecast, by Application 2019 & 2032
- Table 33: Rest of Asia Pacific DDoS Prevention Industry Revenue (Million) Forecast, by Application 2019 & 2032
- Table 34: Global DDoS Prevention Industry Revenue Million Forecast, by Country 2019 & 2032
- Table 35: Brazil DDoS Prevention Industry Revenue (Million) Forecast, by Application 2019 & 2032
- Table 36: Argentina DDoS Prevention Industry Revenue (Million) Forecast, by Application 2019 & 2032
- Table 37: Peru DDoS Prevention Industry Revenue (Million) Forecast, by Application 2019 & 2032
- Table 38: Chile DDoS Prevention Industry Revenue (Million) Forecast, by Application 2019 & 2032
- Table 39: Colombia DDoS Prevention Industry Revenue (Million) Forecast, by Application 2019 & 2032
- Table 40: Ecuador DDoS Prevention Industry Revenue (Million) Forecast, by Application 2019 & 2032
- Table 41: Venezuela DDoS Prevention Industry Revenue (Million) Forecast, by Application 2019 & 2032
- Table 42: Rest of South America DDoS Prevention Industry Revenue (Million) Forecast, by Application 2019 & 2032
- Table 43: Global DDoS Prevention Industry Revenue Million Forecast, by Country 2019 & 2032
- Table 44: United States DDoS Prevention Industry Revenue (Million) Forecast, by Application 2019 & 2032
- Table 45: Canada DDoS Prevention Industry Revenue (Million) Forecast, by Application 2019 & 2032
- Table 46: Mexico DDoS Prevention Industry Revenue (Million) Forecast, by Application 2019 & 2032
- Table 47: Global DDoS Prevention Industry Revenue Million Forecast, by Country 2019 & 2032
- Table 48: United Arab Emirates DDoS Prevention Industry Revenue (Million) Forecast, by Application 2019 & 2032
- Table 49: Saudi Arabia DDoS Prevention Industry Revenue (Million) Forecast, by Application 2019 & 2032
- Table 50: South Africa DDoS Prevention Industry Revenue (Million) Forecast, by Application 2019 & 2032
- Table 51: Rest of Middle East and Africa DDoS Prevention Industry Revenue (Million) Forecast, by Application 2019 & 2032
- Table 52: Global DDoS Prevention Industry Revenue Million Forecast, by Component 2019 & 2032
- Table 53: Global DDoS Prevention Industry Revenue Million Forecast, by Deployment Type 2019 & 2032
- Table 54: Global DDoS Prevention Industry Revenue Million Forecast, by Size of Enterprise 2019 & 2032
- Table 55: Global DDoS Prevention Industry Revenue Million Forecast, by End-user Industry 2019 & 2032
- Table 56: Global DDoS Prevention Industry Revenue Million Forecast, by Country 2019 & 2032
- Table 57: Global DDoS Prevention Industry Revenue Million Forecast, by Component 2019 & 2032
- Table 58: Global DDoS Prevention Industry Revenue Million Forecast, by Deployment Type 2019 & 2032
- Table 59: Global DDoS Prevention Industry Revenue Million Forecast, by Size of Enterprise 2019 & 2032
- Table 60: Global DDoS Prevention Industry Revenue Million Forecast, by End-user Industry 2019 & 2032
- Table 61: Global DDoS Prevention Industry Revenue Million Forecast, by Country 2019 & 2032
- Table 62: Global DDoS Prevention Industry Revenue Million Forecast, by Component 2019 & 2032
- Table 63: Global DDoS Prevention Industry Revenue Million Forecast, by Deployment Type 2019 & 2032
- Table 64: Global DDoS Prevention Industry Revenue Million Forecast, by Size of Enterprise 2019 & 2032
- Table 65: Global DDoS Prevention Industry Revenue Million Forecast, by End-user Industry 2019 & 2032
- Table 66: Global DDoS Prevention Industry Revenue Million Forecast, by Country 2019 & 2032
- Table 67: Global DDoS Prevention Industry Revenue Million Forecast, by Component 2019 & 2032
- Table 68: Global DDoS Prevention Industry Revenue Million Forecast, by Deployment Type 2019 & 2032
- Table 69: Global DDoS Prevention Industry Revenue Million Forecast, by Size of Enterprise 2019 & 2032
- Table 70: Global DDoS Prevention Industry Revenue Million Forecast, by End-user Industry 2019 & 2032
- Table 71: Global DDoS Prevention Industry Revenue Million Forecast, by Country 2019 & 2032
Frequently Asked Questions
1. What is the projected Compound Annual Growth Rate (CAGR) of the DDoS Prevention Industry?
The projected CAGR is approximately 14.04%.
2. Which companies are prominent players in the DDoS Prevention Industry?
Key companies in the market include Corero Network Security Inc, Akamai Technologies Inc, F5 Networks Inc, Imperva Inc, Arbor Networks Inc (NetScout Systems Inc ), Neustar Inc, Radware Ltd, Cloudflare Inc, Verisign Inc, Nexusguard Ltd, Dosarrest Internet Security Ltd.
3. What are the main segments of the DDoS Prevention Industry?
The market segments include Component, Deployment Type, Size of Enterprise, End-user Industry.
4. Can you provide details about the market size?
The market size is estimated to be USD 4.15 Million as of 2022.
5. What are some drivers contributing to market growth?
Increasing Instances of Sophisticated DDoS Attacks; Introduction of Cost-effective Cloud-based and Hybrid Solutions; Proliferation of Technology and Adoption of IoT across Various Verticals.
6. What are the notable trends driving market growth?
Increasing Instances of Sophisticated DDoS Attacks to Drive the Market.
7. Are there any restraints impacting market growth?
Lack of Skilled and Trained Personnel.
8. Can you provide examples of recent developments in the market?
September 2022 - Liquid Networks, a business of Cassava Technologies, launched a Distributed Denial of Service (DDoS) Secure offering to its customers. The company announced that the service is offered to all potential Internet & IP transit clients and will provide these services to existing customers in the African region.
9. What pricing options are available for accessing the report?
Pricing options include single-user, multi-user, and enterprise licenses priced at USD 4750, USD 5250, and USD 8750 respectively.
10. Is the market size provided in terms of value or volume?
The market size is provided in terms of value, measured in Million.
11. Are there any specific market keywords associated with the report?
Yes, the market keyword associated with the report is "DDoS Prevention Industry," which aids in identifying and referencing the specific market segment covered.
12. How do I determine which pricing option suits my needs best?
The pricing options vary based on user requirements and access needs. Individual users may opt for single-user licenses, while businesses requiring broader access may choose multi-user or enterprise licenses for cost-effective access to the report.
13. Are there any additional resources or data provided in the DDoS Prevention Industry report?
While the report offers comprehensive insights, it's advisable to review the specific contents or supplementary materials provided to ascertain if additional resources or data are available.
14. How can I stay updated on further developments or reports in the DDoS Prevention Industry?
To stay informed about further developments, trends, and reports in the DDoS Prevention Industry, consider subscribing to industry newsletters, following relevant companies and organizations, or regularly checking reputable industry news sources and publications.
Methodology
Step 1 - Identification of Relevant Samples Size from Population Database


Step 2 - Approaches for Defining Global Market Size (Value, Volume* & Price*)

Note*: In applicable scenarios
Step 3 - Data Sources
Primary Research
- Web Analytics
- Survey Reports
- Research Institute
- Latest Research Reports
- Opinion Leaders
Secondary Research
- Annual Reports
- White Paper
- Latest Press Release
- Industry Association
- Paid Database
- Investor Presentations

Step 4 - Data Triangulation
Involves using different sources of information in order to increase the validity of a study
These sources are likely to be stakeholders in a program - participants, other researchers, program staff, other community members, and so on.
Then we put all data in single framework & apply various statistical tools to find out the dynamic on the market.
During the analysis stage, feedback from the stakeholder groups would be compared to determine areas of agreement as well as areas of divergence


