
Key Insights
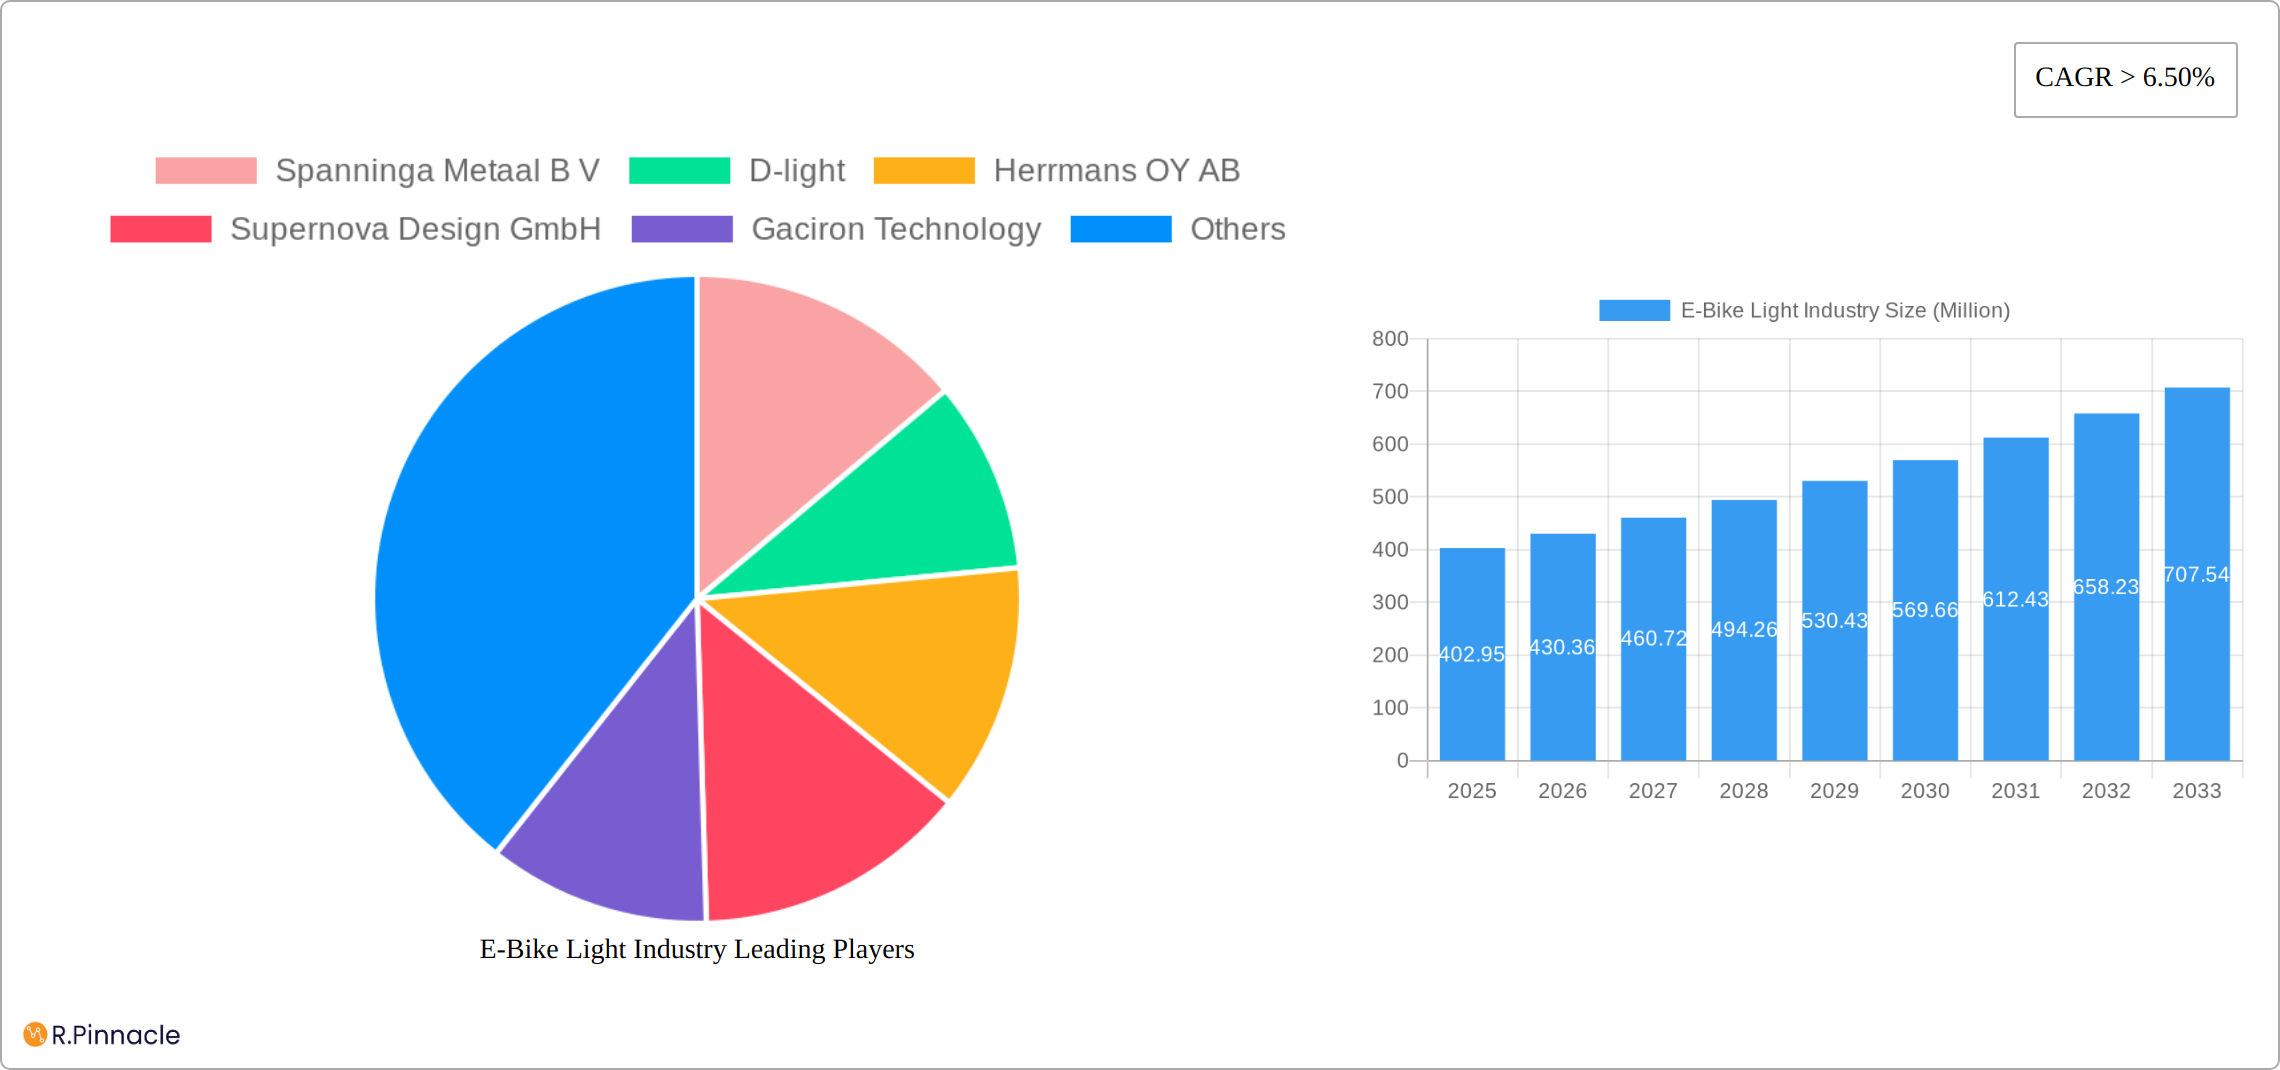
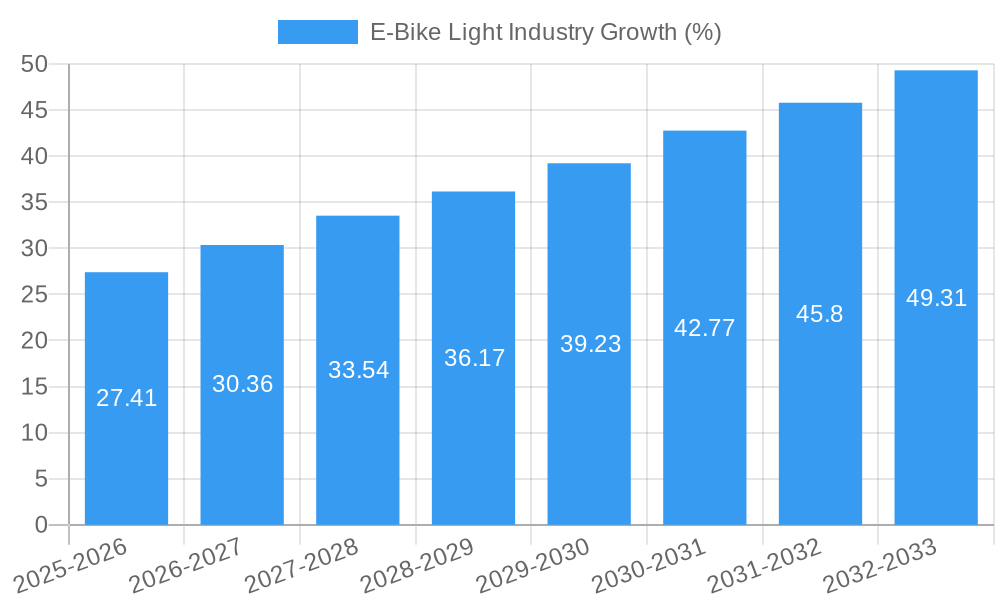
The e-bike light industry is experiencing robust growth, projected to reach a market size of $402.95 million in 2025 and maintain a Compound Annual Growth Rate (CAGR) exceeding 6.50% from 2025 to 2033. This expansion is fueled by several key drivers. The increasing popularity of e-bikes globally, driven by environmental concerns and the desire for sustainable transportation, is a primary factor. Furthermore, stringent safety regulations mandating lighting on e-bikes in many regions are significantly boosting demand. Technological advancements, such as the integration of smart features and improved battery life in e-bike lights, are also contributing to market growth. The market is segmented by light mounting (headlights, rear safety lights), sales channel (offline and online stores), and end-user (aftermarket and stock fitting). The aftermarket segment is particularly dynamic, fueled by the growing customization trend among e-bike owners. Online sales channels are experiencing faster growth compared to offline channels, reflecting the broader shift towards e-commerce. Key players like Spanninga Metaal B.V., D-light, and Supernova Design GmbH are leveraging innovation and strategic partnerships to maintain their market positions. Geographic growth is diverse, with North America and Europe currently dominating, however, the Asia-Pacific region shows significant potential for future expansion, driven by rising disposable incomes and increasing e-bike adoption in countries like China and India.
The competitive landscape is characterized by a mix of established players and emerging innovators. Established brands focus on enhancing product quality and expanding their distribution networks, while newer companies are introducing innovative designs and smart features to attract a wider customer base. While the industry faces challenges such as fluctuating raw material prices and potential supply chain disruptions, the overall outlook remains positive. The long-term growth trajectory is expected to be driven by continued technological advancements, increasing consumer awareness of e-bike safety, and the global push towards sustainable urban mobility. The segment focusing on integrated lighting solutions, directly incorporated into the e-bike design during manufacturing, is poised for significant expansion in the coming years.
E-Bike Light Industry Market Report: 2019-2033
This comprehensive report provides a detailed analysis of the global E-bike Light industry, projecting a market value exceeding $XX Million by 2033. Ideal for industry professionals, investors, and strategic planners, this report offers actionable insights into market trends, competitive dynamics, and future growth opportunities. The study period spans 2019-2033, with 2025 as the base and estimated year.
E-Bike Light Industry Market Structure & Innovation Trends
This section analyzes the market's competitive landscape, highlighting key players such as Spanninga Metaal B V, D-light, Herrmans OY AB, Supernova Design GmbH, Gaciron Technology, Magicshin, Limeforge Ltd, Lezyne, and Lord Benex. We delve into market concentration, examining market share distribution and assessing the impact of mergers and acquisitions (M&A) activities. The total M&A deal value within the industry during the historical period (2019-2024) is estimated at $XX Million. Innovation drivers, including technological advancements in LED technology, battery life, and smart connectivity features, are explored alongside regulatory frameworks impacting product safety and design. The report also assesses the influence of product substitutes and analyzes end-user demographics, identifying key trends in aftermarket vs. stock fitting demands.
- Market Concentration: The market shows a [Describe concentration - e.g., moderately concentrated, highly fragmented] structure with the top 5 players holding approximately XX% market share in 2024.
- M&A Activity: Significant M&A activity was observed between [Years], with a total deal value estimated at $XX Million, largely driven by [mention reasons].
- Innovation Drivers: Advancements in LED technology, improved battery performance, and integration of smart features are driving innovation.
- Regulatory Landscape: Compliance with safety standards (e.g., StVZO in Europe) shapes product development and market access.
E-Bike Light Industry Market Dynamics & Trends
This section delves into the pivotal factors driving and hindering growth within the dynamic e-bike light market. We present a detailed analysis of the Compound Annual Growth Rate (CAGR) projected from 2025 to 2033, offering granular insights into market penetration across diverse segments. This includes a comprehensive examination of technological advancements, such as the integration of cutting-edge lighting technologies (like laser lights and adaptive illumination) and smart connectivity features (including smartphone integration and GPS capabilities). Furthermore, we analyze evolving consumer preferences, revealing a growing demand for brighter, safer, and more technologically advanced lighting solutions that enhance visibility and safety. The competitive landscape is meticulously dissected, focusing on the strategic initiatives employed by key market players to secure and expand their market share. Our projections indicate the global market size will reach $XX Million by 2033, fueled by key growth drivers including the burgeoning e-bike market, increasing consumer awareness of safety, and the implementation of stricter safety regulations.
Dominant Regions & Segments in E-Bike Light Industry
This section identifies the leading regions and segments within the E-bike Light market. We analyze regional variations in market size and growth, highlighting key factors contributing to regional dominance. This includes examining economic policies supporting e-bike adoption, the development of cycling infrastructure, and consumer behavior patterns. The segment analysis focuses on By Light Mounting (Headlight vs. Rear Safety Light), By Sales Channel (Offline Stores vs. Online Stores), and By End-User (Aftermarket vs. Stock Fitting).
- Leading Region: [Region Name] is the dominant region due to [Reasons, e.g., high e-bike adoption rates, supportive government policies].
- Dominant Segment (By Light Mounting): Headlights represent the larger segment due to [Reasons, e.g., higher visibility needs].
- Dominant Segment (By Sales Channel): [Channel] holds a larger market share owing to [Reasons, e.g., established distribution network, consumer preference].
- Dominant Segment (By End-User): [End-User] demonstrates higher growth owing to [Reasons, e.g., increasing demand for aftermarket upgrades].
E-Bike Light Industry Product Innovations
Recent years have witnessed significant innovations in e-bike lighting technology, focusing on enhanced brightness, improved battery life, and integrated smart features. These innovations offer improved safety and visibility, catering to the growing demand for advanced lighting solutions. Key technological trends include the adoption of high-intensity LEDs, advanced light control systems, and the integration of smart connectivity features for enhanced user experience and data analytics. The market is witnessing a shift towards more compact, aesthetically pleasing designs that seamlessly integrate with the overall e-bike design.
Report Scope & Segmentation Analysis
This in-depth report meticulously segments the e-bike light market using several key parameters to provide a holistic view of the industry landscape:
- By Light Mounting: A detailed examination of the Headlight and Rear Safety Light segments, encompassing market size, growth forecasts, and a competitive analysis of each segment. This includes an assessment of different mounting styles and their impact on market adoption.
- By Sales Channel: A comprehensive evaluation of Offline Stores and Online Stores, providing valuable insights into distribution strategies, consumer purchasing behavior, and the overall dynamics of each channel. We explore the impact of e-commerce on market growth and the evolving preferences of consumers.
- By End-User: A thorough analysis of Aftermarket and Stock Fitting segments, highlighting the distinct market requirements and growth prospects associated with each. This section addresses the differences in product features, pricing, and distribution channels.
Each segment receives dedicated analysis, including precise market size estimations, growth projections, and a detailed competitive landscape overview, providing readers with actionable insights.
Key Drivers of E-Bike Light Industry Growth
The remarkable growth trajectory of the e-bike light industry is driven by several significant factors:
- Rising E-bike Adoption: The global surge in e-bike adoption is a fundamental driver, fostering a parallel increase in demand for reliable and high-visibility lighting solutions. We analyze the correlation between e-bike sales and e-bike light market growth.
- Technological Advancements: Continuous innovations in LED technology, resulting in enhanced brightness, energy efficiency, and longer battery life, are significantly enhancing product appeal and functionality. The incorporation of smart features further contributes to market expansion.
- Stringent Safety Regulations: Governments worldwide are increasingly prioritizing cyclist safety, leading to the implementation of stricter regulations mandating the use of high-quality e-bike lights. This regulatory pressure is a significant catalyst for market growth.
- Increased Consumer Awareness: Growing consumer awareness regarding road safety and the importance of enhanced visibility for cyclists is driving demand for high-quality and innovative e-bike lighting solutions.
Challenges in the E-Bike Light Industry Sector
Despite its strong growth potential, the e-bike light industry faces several challenges:
- Intense Competition: The market's competitive intensity necessitates continuous innovation and product differentiation for companies to maintain a sustainable competitive advantage.
- Supply Chain Disruptions: Global supply chain vulnerabilities can lead to component shortages, production delays, and increased manufacturing costs, impacting market stability.
- Price Sensitivity: Consumer price sensitivity can limit the adoption of premium e-bike lighting solutions with advanced features, requiring manufacturers to balance innovation with affordability.
- Counterfeit Products: The presence of counterfeit products in the market poses a threat to both consumer safety and the reputation of legitimate brands.
Emerging Opportunities in E-bike Light Industry
Several emerging opportunities are shaping the E-bike Light market:
- Smart Connectivity: Integrating smart features such as Bluetooth connectivity and app integration offers potential for enhanced user experience and data analytics.
- Expansion into New Markets: Developing markets with increasing e-bike adoption present significant growth opportunities.
- Sustainable and Eco-Friendly Products: Consumers are increasingly seeking eco-friendly and sustainable products, which will drive demand for sustainable materials and manufacturing practices.
Leading Players in the E-bike Light Industry Market
- Spanninga Metaal B V
- D-light
- Herrmans OY AB
- Supernova Design GmbH
- Gaciron Technology
- Magicshin
- Limeforge Ltd
- Lezyne
- Lord Benex
Key Developments in E-bike Light Industry
- December 2022: Magicshine launched the ME StVZO 100LUX E-BIKE LIGHT in India, featuring 3 high-efficiency LEDs.
- March 2023: Upway, a French e-bike refurbisher, launched in the U.S., expanding the market for used and refurbished e-bikes and consequently, the demand for replacement or upgraded lights.
Future Outlook for E-Bike Light Industry Market
The E-bike Light market is poised for robust growth driven by the continued expansion of the e-bike market, technological innovations, and increasing consumer awareness of safety features. Strategic partnerships, expansion into new geographic markets, and the development of innovative lighting solutions will play a pivotal role in shaping the industry's future. The market is expected to witness significant growth fueled by the rising popularity of e-bikes and advancements in lighting technology.
E-Bike Light Industry Segmentation
-
1. Light Mounting
- 1.1. Headlight
- 1.2. Rear Safety Light
-
2. Sales Channel
- 2.1. Offline Stores
- 2.2. Online Stores
-
3. End-User
- 3.1. Aftermarket
- 3.2. Stock Fitting
E-Bike Light Industry Segmentation By Geography
-
1. North America
- 1.1. United States
- 1.2. Canada
- 1.3. Rest of North America
-
2. Europe
- 2.1. Germany
- 2.2. United Kingdom
- 2.3. France
- 2.4. Russia
- 2.5. Spain
- 2.6. Rest of Europe
-
3. Asia Pacific
- 3.1. India
- 3.2. China
- 3.3. Japan
- 3.4. South Korea
- 3.5. Rest of Asia Pacific
-
4. Rest of the World
- 4.1. South America
- 4.2. Middle East and Africa

E-Bike Light Industry REPORT HIGHLIGHTS
| Aspects | Details |
|---|---|
| Study Period | 2019-2033 |
| Base Year | 2024 |
| Estimated Year | 2025 |
| Forecast Period | 2025-2033 |
| Historical Period | 2019-2024 |
| Growth Rate | CAGR of > 6.50% from 2019-2033 |
| Segmentation |
|
Table of Contents
- 1. Introduction
- 1.1. Research Scope
- 1.2. Market Segmentation
- 1.3. Research Methodology
- 1.4. Definitions and Assumptions
- 2. Executive Summary
- 2.1. Introduction
- 3. Market Dynamics
- 3.1. Introduction
- 3.2. Market Drivers
- 3.2.1. Rise in Sales of E-bikes
- 3.3. Market Restrains
- 3.3.1. High Cost of EV Solid-State Battery May Hamper the Growth of the Market
- 3.4. Market Trends
- 3.4.1. Growing Demand for E-bikes
- 4. Market Factor Analysis
- 4.1. Porters Five Forces
- 4.2. Supply/Value Chain
- 4.3. PESTEL analysis
- 4.4. Market Entropy
- 4.5. Patent/Trademark Analysis
- 5. Global E-Bike Light Industry Analysis, Insights and Forecast, 2019-2031
- 5.1. Market Analysis, Insights and Forecast - by Light Mounting
- 5.1.1. Headlight
- 5.1.2. Rear Safety Light
- 5.2. Market Analysis, Insights and Forecast - by Sales Channel
- 5.2.1. Offline Stores
- 5.2.2. Online Stores
- 5.3. Market Analysis, Insights and Forecast - by End-User
- 5.3.1. Aftermarket
- 5.3.2. Stock Fitting
- 5.4. Market Analysis, Insights and Forecast - by Region
- 5.4.1. North America
- 5.4.2. Europe
- 5.4.3. Asia Pacific
- 5.4.4. Rest of the World
- 5.1. Market Analysis, Insights and Forecast - by Light Mounting
- 6. North America E-Bike Light Industry Analysis, Insights and Forecast, 2019-2031
- 6.1. Market Analysis, Insights and Forecast - by Light Mounting
- 6.1.1. Headlight
- 6.1.2. Rear Safety Light
- 6.2. Market Analysis, Insights and Forecast - by Sales Channel
- 6.2.1. Offline Stores
- 6.2.2. Online Stores
- 6.3. Market Analysis, Insights and Forecast - by End-User
- 6.3.1. Aftermarket
- 6.3.2. Stock Fitting
- 6.1. Market Analysis, Insights and Forecast - by Light Mounting
- 7. Europe E-Bike Light Industry Analysis, Insights and Forecast, 2019-2031
- 7.1. Market Analysis, Insights and Forecast - by Light Mounting
- 7.1.1. Headlight
- 7.1.2. Rear Safety Light
- 7.2. Market Analysis, Insights and Forecast - by Sales Channel
- 7.2.1. Offline Stores
- 7.2.2. Online Stores
- 7.3. Market Analysis, Insights and Forecast - by End-User
- 7.3.1. Aftermarket
- 7.3.2. Stock Fitting
- 7.1. Market Analysis, Insights and Forecast - by Light Mounting
- 8. Asia Pacific E-Bike Light Industry Analysis, Insights and Forecast, 2019-2031
- 8.1. Market Analysis, Insights and Forecast - by Light Mounting
- 8.1.1. Headlight
- 8.1.2. Rear Safety Light
- 8.2. Market Analysis, Insights and Forecast - by Sales Channel
- 8.2.1. Offline Stores
- 8.2.2. Online Stores
- 8.3. Market Analysis, Insights and Forecast - by End-User
- 8.3.1. Aftermarket
- 8.3.2. Stock Fitting
- 8.1. Market Analysis, Insights and Forecast - by Light Mounting
- 9. Rest of the World E-Bike Light Industry Analysis, Insights and Forecast, 2019-2031
- 9.1. Market Analysis, Insights and Forecast - by Light Mounting
- 9.1.1. Headlight
- 9.1.2. Rear Safety Light
- 9.2. Market Analysis, Insights and Forecast - by Sales Channel
- 9.2.1. Offline Stores
- 9.2.2. Online Stores
- 9.3. Market Analysis, Insights and Forecast - by End-User
- 9.3.1. Aftermarket
- 9.3.2. Stock Fitting
- 9.1. Market Analysis, Insights and Forecast - by Light Mounting
- 10. North America E-Bike Light Industry Analysis, Insights and Forecast, 2019-2031
- 10.1. Market Analysis, Insights and Forecast - By Country/Sub-region
- 10.1.1 United States
- 10.1.2 Canada
- 10.1.3 Rest of North America
- 11. Europe E-Bike Light Industry Analysis, Insights and Forecast, 2019-2031
- 11.1. Market Analysis, Insights and Forecast - By Country/Sub-region
- 11.1.1 Germany
- 11.1.2 United Kingdom
- 11.1.3 France
- 11.1.4 Russia
- 11.1.5 Spain
- 11.1.6 Rest of Europe
- 12. Asia Pacific E-Bike Light Industry Analysis, Insights and Forecast, 2019-2031
- 12.1. Market Analysis, Insights and Forecast - By Country/Sub-region
- 12.1.1 India
- 12.1.2 China
- 12.1.3 Japan
- 12.1.4 South Korea
- 12.1.5 Rest of Asia Pacific
- 13. Rest of the World E-Bike Light Industry Analysis, Insights and Forecast, 2019-2031
- 13.1. Market Analysis, Insights and Forecast - By Country/Sub-region
- 13.1.1 South America
- 13.1.2 Middle East and Africa
- 14. Competitive Analysis
- 14.1. Global Market Share Analysis 2024
- 14.2. Company Profiles
- 14.2.1 Spanninga Metaal B V
- 14.2.1.1. Overview
- 14.2.1.2. Products
- 14.2.1.3. SWOT Analysis
- 14.2.1.4. Recent Developments
- 14.2.1.5. Financials (Based on Availability)
- 14.2.2 D-light
- 14.2.2.1. Overview
- 14.2.2.2. Products
- 14.2.2.3. SWOT Analysis
- 14.2.2.4. Recent Developments
- 14.2.2.5. Financials (Based on Availability)
- 14.2.3 Herrmans OY AB
- 14.2.3.1. Overview
- 14.2.3.2. Products
- 14.2.3.3. SWOT Analysis
- 14.2.3.4. Recent Developments
- 14.2.3.5. Financials (Based on Availability)
- 14.2.4 Supernova Design GmbH
- 14.2.4.1. Overview
- 14.2.4.2. Products
- 14.2.4.3. SWOT Analysis
- 14.2.4.4. Recent Developments
- 14.2.4.5. Financials (Based on Availability)
- 14.2.5 Gaciron Technology
- 14.2.5.1. Overview
- 14.2.5.2. Products
- 14.2.5.3. SWOT Analysis
- 14.2.5.4. Recent Developments
- 14.2.5.5. Financials (Based on Availability)
- 14.2.6 Magicshin
- 14.2.6.1. Overview
- 14.2.6.2. Products
- 14.2.6.3. SWOT Analysis
- 14.2.6.4. Recent Developments
- 14.2.6.5. Financials (Based on Availability)
- 14.2.7 Limeforge Ltd
- 14.2.7.1. Overview
- 14.2.7.2. Products
- 14.2.7.3. SWOT Analysis
- 14.2.7.4. Recent Developments
- 14.2.7.5. Financials (Based on Availability)
- 14.2.8 Lezyne
- 14.2.8.1. Overview
- 14.2.8.2. Products
- 14.2.8.3. SWOT Analysis
- 14.2.8.4. Recent Developments
- 14.2.8.5. Financials (Based on Availability)
- 14.2.9 Lord Benex
- 14.2.9.1. Overview
- 14.2.9.2. Products
- 14.2.9.3. SWOT Analysis
- 14.2.9.4. Recent Developments
- 14.2.9.5. Financials (Based on Availability)
- 14.2.1 Spanninga Metaal B V
List of Figures
- Figure 1: Global E-Bike Light Industry Revenue Breakdown (Million, %) by Region 2024 & 2032
- Figure 2: North America E-Bike Light Industry Revenue (Million), by Country 2024 & 2032
- Figure 3: North America E-Bike Light Industry Revenue Share (%), by Country 2024 & 2032
- Figure 4: Europe E-Bike Light Industry Revenue (Million), by Country 2024 & 2032
- Figure 5: Europe E-Bike Light Industry Revenue Share (%), by Country 2024 & 2032
- Figure 6: Asia Pacific E-Bike Light Industry Revenue (Million), by Country 2024 & 2032
- Figure 7: Asia Pacific E-Bike Light Industry Revenue Share (%), by Country 2024 & 2032
- Figure 8: Rest of the World E-Bike Light Industry Revenue (Million), by Country 2024 & 2032
- Figure 9: Rest of the World E-Bike Light Industry Revenue Share (%), by Country 2024 & 2032
- Figure 10: North America E-Bike Light Industry Revenue (Million), by Light Mounting 2024 & 2032
- Figure 11: North America E-Bike Light Industry Revenue Share (%), by Light Mounting 2024 & 2032
- Figure 12: North America E-Bike Light Industry Revenue (Million), by Sales Channel 2024 & 2032
- Figure 13: North America E-Bike Light Industry Revenue Share (%), by Sales Channel 2024 & 2032
- Figure 14: North America E-Bike Light Industry Revenue (Million), by End-User 2024 & 2032
- Figure 15: North America E-Bike Light Industry Revenue Share (%), by End-User 2024 & 2032
- Figure 16: North America E-Bike Light Industry Revenue (Million), by Country 2024 & 2032
- Figure 17: North America E-Bike Light Industry Revenue Share (%), by Country 2024 & 2032
- Figure 18: Europe E-Bike Light Industry Revenue (Million), by Light Mounting 2024 & 2032
- Figure 19: Europe E-Bike Light Industry Revenue Share (%), by Light Mounting 2024 & 2032
- Figure 20: Europe E-Bike Light Industry Revenue (Million), by Sales Channel 2024 & 2032
- Figure 21: Europe E-Bike Light Industry Revenue Share (%), by Sales Channel 2024 & 2032
- Figure 22: Europe E-Bike Light Industry Revenue (Million), by End-User 2024 & 2032
- Figure 23: Europe E-Bike Light Industry Revenue Share (%), by End-User 2024 & 2032
- Figure 24: Europe E-Bike Light Industry Revenue (Million), by Country 2024 & 2032
- Figure 25: Europe E-Bike Light Industry Revenue Share (%), by Country 2024 & 2032
- Figure 26: Asia Pacific E-Bike Light Industry Revenue (Million), by Light Mounting 2024 & 2032
- Figure 27: Asia Pacific E-Bike Light Industry Revenue Share (%), by Light Mounting 2024 & 2032
- Figure 28: Asia Pacific E-Bike Light Industry Revenue (Million), by Sales Channel 2024 & 2032
- Figure 29: Asia Pacific E-Bike Light Industry Revenue Share (%), by Sales Channel 2024 & 2032
- Figure 30: Asia Pacific E-Bike Light Industry Revenue (Million), by End-User 2024 & 2032
- Figure 31: Asia Pacific E-Bike Light Industry Revenue Share (%), by End-User 2024 & 2032
- Figure 32: Asia Pacific E-Bike Light Industry Revenue (Million), by Country 2024 & 2032
- Figure 33: Asia Pacific E-Bike Light Industry Revenue Share (%), by Country 2024 & 2032
- Figure 34: Rest of the World E-Bike Light Industry Revenue (Million), by Light Mounting 2024 & 2032
- Figure 35: Rest of the World E-Bike Light Industry Revenue Share (%), by Light Mounting 2024 & 2032
- Figure 36: Rest of the World E-Bike Light Industry Revenue (Million), by Sales Channel 2024 & 2032
- Figure 37: Rest of the World E-Bike Light Industry Revenue Share (%), by Sales Channel 2024 & 2032
- Figure 38: Rest of the World E-Bike Light Industry Revenue (Million), by End-User 2024 & 2032
- Figure 39: Rest of the World E-Bike Light Industry Revenue Share (%), by End-User 2024 & 2032
- Figure 40: Rest of the World E-Bike Light Industry Revenue (Million), by Country 2024 & 2032
- Figure 41: Rest of the World E-Bike Light Industry Revenue Share (%), by Country 2024 & 2032
List of Tables
- Table 1: Global E-Bike Light Industry Revenue Million Forecast, by Region 2019 & 2032
- Table 2: Global E-Bike Light Industry Revenue Million Forecast, by Light Mounting 2019 & 2032
- Table 3: Global E-Bike Light Industry Revenue Million Forecast, by Sales Channel 2019 & 2032
- Table 4: Global E-Bike Light Industry Revenue Million Forecast, by End-User 2019 & 2032
- Table 5: Global E-Bike Light Industry Revenue Million Forecast, by Region 2019 & 2032
- Table 6: Global E-Bike Light Industry Revenue Million Forecast, by Country 2019 & 2032
- Table 7: United States E-Bike Light Industry Revenue (Million) Forecast, by Application 2019 & 2032
- Table 8: Canada E-Bike Light Industry Revenue (Million) Forecast, by Application 2019 & 2032
- Table 9: Rest of North America E-Bike Light Industry Revenue (Million) Forecast, by Application 2019 & 2032
- Table 10: Global E-Bike Light Industry Revenue Million Forecast, by Country 2019 & 2032
- Table 11: Germany E-Bike Light Industry Revenue (Million) Forecast, by Application 2019 & 2032
- Table 12: United Kingdom E-Bike Light Industry Revenue (Million) Forecast, by Application 2019 & 2032
- Table 13: France E-Bike Light Industry Revenue (Million) Forecast, by Application 2019 & 2032
- Table 14: Russia E-Bike Light Industry Revenue (Million) Forecast, by Application 2019 & 2032
- Table 15: Spain E-Bike Light Industry Revenue (Million) Forecast, by Application 2019 & 2032
- Table 16: Rest of Europe E-Bike Light Industry Revenue (Million) Forecast, by Application 2019 & 2032
- Table 17: Global E-Bike Light Industry Revenue Million Forecast, by Country 2019 & 2032
- Table 18: India E-Bike Light Industry Revenue (Million) Forecast, by Application 2019 & 2032
- Table 19: China E-Bike Light Industry Revenue (Million) Forecast, by Application 2019 & 2032
- Table 20: Japan E-Bike Light Industry Revenue (Million) Forecast, by Application 2019 & 2032
- Table 21: South Korea E-Bike Light Industry Revenue (Million) Forecast, by Application 2019 & 2032
- Table 22: Rest of Asia Pacific E-Bike Light Industry Revenue (Million) Forecast, by Application 2019 & 2032
- Table 23: Global E-Bike Light Industry Revenue Million Forecast, by Country 2019 & 2032
- Table 24: South America E-Bike Light Industry Revenue (Million) Forecast, by Application 2019 & 2032
- Table 25: Middle East and Africa E-Bike Light Industry Revenue (Million) Forecast, by Application 2019 & 2032
- Table 26: Global E-Bike Light Industry Revenue Million Forecast, by Light Mounting 2019 & 2032
- Table 27: Global E-Bike Light Industry Revenue Million Forecast, by Sales Channel 2019 & 2032
- Table 28: Global E-Bike Light Industry Revenue Million Forecast, by End-User 2019 & 2032
- Table 29: Global E-Bike Light Industry Revenue Million Forecast, by Country 2019 & 2032
- Table 30: United States E-Bike Light Industry Revenue (Million) Forecast, by Application 2019 & 2032
- Table 31: Canada E-Bike Light Industry Revenue (Million) Forecast, by Application 2019 & 2032
- Table 32: Rest of North America E-Bike Light Industry Revenue (Million) Forecast, by Application 2019 & 2032
- Table 33: Global E-Bike Light Industry Revenue Million Forecast, by Light Mounting 2019 & 2032
- Table 34: Global E-Bike Light Industry Revenue Million Forecast, by Sales Channel 2019 & 2032
- Table 35: Global E-Bike Light Industry Revenue Million Forecast, by End-User 2019 & 2032
- Table 36: Global E-Bike Light Industry Revenue Million Forecast, by Country 2019 & 2032
- Table 37: Germany E-Bike Light Industry Revenue (Million) Forecast, by Application 2019 & 2032
- Table 38: United Kingdom E-Bike Light Industry Revenue (Million) Forecast, by Application 2019 & 2032
- Table 39: France E-Bike Light Industry Revenue (Million) Forecast, by Application 2019 & 2032
- Table 40: Russia E-Bike Light Industry Revenue (Million) Forecast, by Application 2019 & 2032
- Table 41: Spain E-Bike Light Industry Revenue (Million) Forecast, by Application 2019 & 2032
- Table 42: Rest of Europe E-Bike Light Industry Revenue (Million) Forecast, by Application 2019 & 2032
- Table 43: Global E-Bike Light Industry Revenue Million Forecast, by Light Mounting 2019 & 2032
- Table 44: Global E-Bike Light Industry Revenue Million Forecast, by Sales Channel 2019 & 2032
- Table 45: Global E-Bike Light Industry Revenue Million Forecast, by End-User 2019 & 2032
- Table 46: Global E-Bike Light Industry Revenue Million Forecast, by Country 2019 & 2032
- Table 47: India E-Bike Light Industry Revenue (Million) Forecast, by Application 2019 & 2032
- Table 48: China E-Bike Light Industry Revenue (Million) Forecast, by Application 2019 & 2032
- Table 49: Japan E-Bike Light Industry Revenue (Million) Forecast, by Application 2019 & 2032
- Table 50: South Korea E-Bike Light Industry Revenue (Million) Forecast, by Application 2019 & 2032
- Table 51: Rest of Asia Pacific E-Bike Light Industry Revenue (Million) Forecast, by Application 2019 & 2032
- Table 52: Global E-Bike Light Industry Revenue Million Forecast, by Light Mounting 2019 & 2032
- Table 53: Global E-Bike Light Industry Revenue Million Forecast, by Sales Channel 2019 & 2032
- Table 54: Global E-Bike Light Industry Revenue Million Forecast, by End-User 2019 & 2032
- Table 55: Global E-Bike Light Industry Revenue Million Forecast, by Country 2019 & 2032
- Table 56: South America E-Bike Light Industry Revenue (Million) Forecast, by Application 2019 & 2032
- Table 57: Middle East and Africa E-Bike Light Industry Revenue (Million) Forecast, by Application 2019 & 2032
Frequently Asked Questions
1. What is the projected Compound Annual Growth Rate (CAGR) of the E-Bike Light Industry?
The projected CAGR is approximately > 6.50%.
2. Which companies are prominent players in the E-Bike Light Industry?
Key companies in the market include Spanninga Metaal B V, D-light, Herrmans OY AB, Supernova Design GmbH, Gaciron Technology, Magicshin, Limeforge Ltd, Lezyne, Lord Benex.
3. What are the main segments of the E-Bike Light Industry?
The market segments include Light Mounting, Sales Channel, End-User.
4. Can you provide details about the market size?
The market size is estimated to be USD 402.95 Million as of 2022.
5. What are some drivers contributing to market growth?
Rise in Sales of E-bikes.
6. What are the notable trends driving market growth?
Growing Demand for E-bikes.
7. Are there any restraints impacting market growth?
High Cost of EV Solid-State Battery May Hamper the Growth of the Market.
8. Can you provide examples of recent developments in the market?
March 2023: Upway, the French refurbisher and reseller of electric bikes across various brands, launched in the United States. The company will focus its efforts on the Northeast region of the country. Still, its bikes will be available for shipping across the continental U.S. Upway already collaborates with major European e-bike brands such as VanMoof, Riese & Müller, and Gazelle. Still, it plans to extend its roster to include American bike brands such as Specialised, Cannondale, and Rad Power Bikes.
9. What pricing options are available for accessing the report?
Pricing options include single-user, multi-user, and enterprise licenses priced at USD 4750, USD 5250, and USD 8750 respectively.
10. Is the market size provided in terms of value or volume?
The market size is provided in terms of value, measured in Million.
11. Are there any specific market keywords associated with the report?
Yes, the market keyword associated with the report is "E-Bike Light Industry," which aids in identifying and referencing the specific market segment covered.
12. How do I determine which pricing option suits my needs best?
The pricing options vary based on user requirements and access needs. Individual users may opt for single-user licenses, while businesses requiring broader access may choose multi-user or enterprise licenses for cost-effective access to the report.
13. Are there any additional resources or data provided in the E-Bike Light Industry report?
While the report offers comprehensive insights, it's advisable to review the specific contents or supplementary materials provided to ascertain if additional resources or data are available.
14. How can I stay updated on further developments or reports in the E-Bike Light Industry?
To stay informed about further developments, trends, and reports in the E-Bike Light Industry, consider subscribing to industry newsletters, following relevant companies and organizations, or regularly checking reputable industry news sources and publications.
Methodology
Step 1 - Identification of Relevant Samples Size from Population Database


Step 2 - Approaches for Defining Global Market Size (Value, Volume* & Price*)

Note*: In applicable scenarios
Step 3 - Data Sources
Primary Research
- Web Analytics
- Survey Reports
- Research Institute
- Latest Research Reports
- Opinion Leaders
Secondary Research
- Annual Reports
- White Paper
- Latest Press Release
- Industry Association
- Paid Database
- Investor Presentations

Step 4 - Data Triangulation
Involves using different sources of information in order to increase the validity of a study
These sources are likely to be stakeholders in a program - participants, other researchers, program staff, other community members, and so on.
Then we put all data in single framework & apply various statistical tools to find out the dynamic on the market.
During the analysis stage, feedback from the stakeholder groups would be compared to determine areas of agreement as well as areas of divergence


