
Key Insights
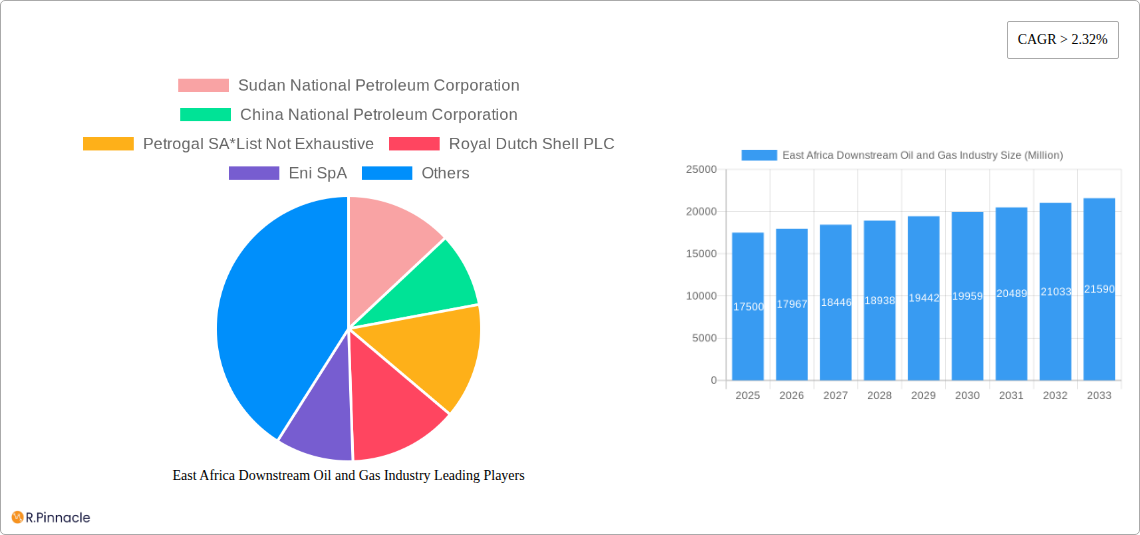
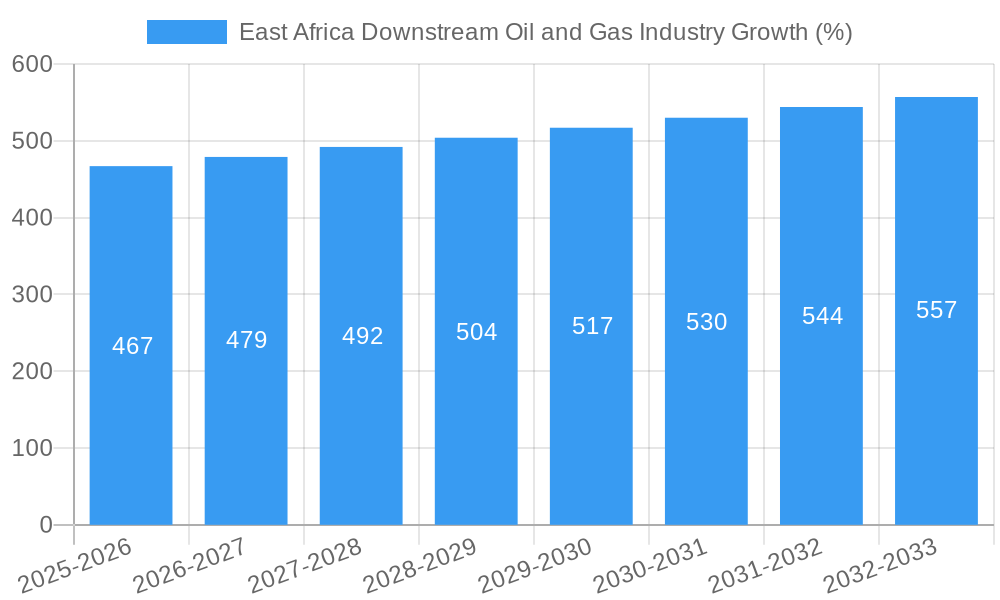
The East African downstream oil and gas industry, valued at $17,500 million in 2025, exhibits robust growth potential, projected to expand at a CAGR exceeding 2.32% from 2025 to 2033. This growth is fueled by several key drivers. Firstly, the increasing industrialization and urbanization across the region are significantly boosting demand for refined petroleum products, particularly in sectors like transportation and manufacturing. Secondly, a burgeoning population and rising disposable incomes are driving higher consumption of LPG for household use and fueling the growth in the automotive sector. However, challenges persist. Price volatility in global crude oil markets presents a significant headwind, impacting profitability for downstream players. Furthermore, government regulations aimed at promoting renewable energy sources and improving energy efficiency could potentially moderate future growth of the traditional oil and gas sector in the long term. The industry is segmented by product type (refined petroleum products, lubricants, petrochemicals, LPG) and end-user (industrial, transportation, commercial, household). Key players include international giants like Shell and Total Energies, alongside national oil companies such as the Sudan National Petroleum Corporation and Kenya Petroleum Refineries Ltd. Competition is intense, with a mix of state-owned and private entities vying for market share. Regional variations in market dynamics exist, with countries like Kenya and Tanzania displaying stronger growth compared to others due to their relatively higher economic development and infrastructure. The forecast period suggests a continuing, albeit moderate, expansion, with further segmentation within each product and end-user category offering opportunities for specialized players.
The competitive landscape is likely to see further consolidation in the coming years, as companies seek to optimize operations and expand their market presence. Investment in refining capacity and distribution networks will be crucial for sustained growth, alongside initiatives focused on improving supply chain efficiency and enhancing product diversification. The industry's future will hinge on effectively navigating the balance between meeting the region’s energy demands and adapting to evolving global energy policies, emphasizing a transition towards cleaner energy sources. Strategic partnerships and investments in sustainable technologies will be key differentiators for success in this dynamic market.
East Africa Downstream Oil and Gas Industry: Market Analysis and Forecast 2019-2033
This comprehensive report provides a detailed analysis of the East Africa downstream oil and gas industry, covering market structure, dynamics, leading players, and future outlook. The study period spans 2019-2033, with 2025 as the base and estimated year. This report is essential for industry professionals, investors, and policymakers seeking actionable insights into this dynamic market.
East Africa Downstream Oil and Gas Industry Market Structure & Innovation Trends
This section analyzes the market concentration, innovation drivers, regulatory frameworks, product substitutes, end-user demographics, and M&A activities within the East African downstream oil and gas sector. The analysis considers the historical period (2019-2024) and projects trends through to 2033.
Market Concentration: The East African downstream oil and gas market exhibits a moderately concentrated structure, with a few major international and national players holding significant market share. Market share data for key players will vary by segment but the top five companies (Sudan National Petroleum Corporation, China National Petroleum Corporation, Petrogal SA, Royal Dutch Shell PLC, and Eni SpA) likely account for over xx% of the total market value.
Innovation Drivers: Key innovation drivers include the increasing demand for cleaner fuels, stricter environmental regulations, and technological advancements in refining and distribution. The push towards biofuels and alternative energy sources are also shaping the industry landscape.
Regulatory Frameworks: Varying regulatory landscapes across East African nations influence market dynamics. Investment decisions are heavily impacted by licensing procedures, tax policies, and environmental regulations.
Product Substitutes: The rise of electric vehicles and renewable energy sources poses a long-term threat to the traditional oil and gas market. The industry is responding by investing in alternative fuels and energy efficiency technologies.
End-User Demographics: The report analyzes the end-user segments (Industrial, Transportation, Commercial, Household) and their respective consumption patterns. Growth in specific segments is influenced by factors such as economic development, urbanization, and industrialization.
M&A Activities: Significant M&A activity has been witnessed, exemplified by Savannah Energy's USD 1.25 Billion acquisition of oil fields in South Sudan in December 2022. These activities reshape the competitive landscape and influence market share. Further M&A deals are expected, with projected deal values exceeding USD xx Billion over the forecast period.
East Africa Downstream Oil and Gas Industry Market Dynamics & Trends
This section explores the market growth drivers, technological disruptions, consumer preferences, and competitive dynamics within the East African downstream oil and gas industry. The analysis covers the historical period (2019-2024), the base year (2025), and forecasts to 2033. The market is expected to exhibit a Compound Annual Growth Rate (CAGR) of xx% during the forecast period (2025-2033). Market penetration of refined petroleum products is expected to reach xx% by 2033, driven by industrialization and increasing vehicle ownership. This growth will also be shaped by technological advancements such as the increased efficiency of refining processes and the adoption of new distribution methods. Furthermore, evolving consumer preferences for cleaner fuels and environmentally friendly practices will significantly impact industry strategies.
Dominant Regions & Segments in East Africa Downstream Oil and Gas Industry
This section identifies the leading regions and segments within the East African downstream oil and gas industry, analyzing key growth drivers.
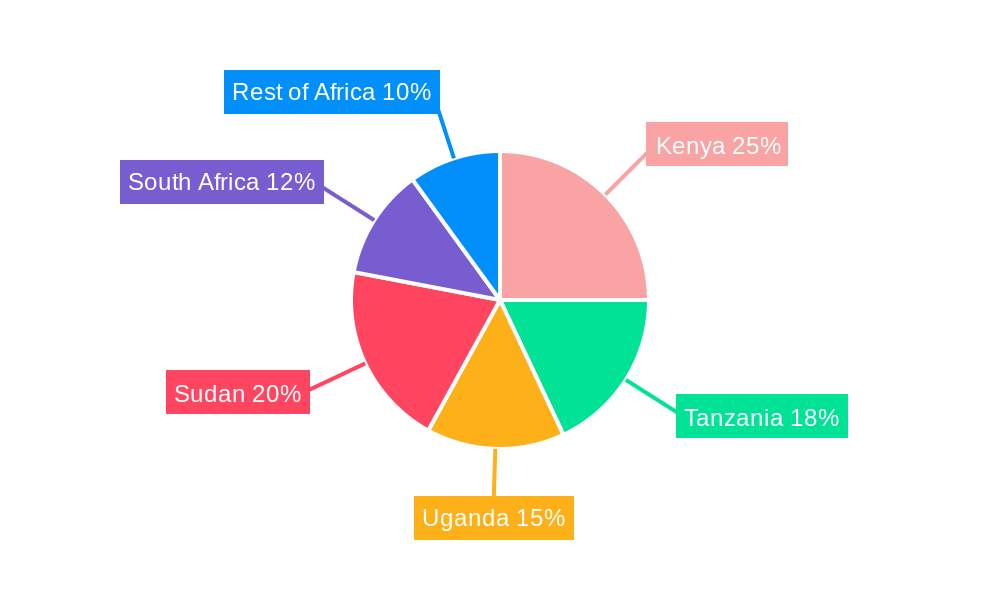
Dominant Region: Kenya is currently projected as the dominant region due to its relatively developed infrastructure and strong economic growth.
Dominant Segments:
Product Segment: Refined petroleum products constitute the largest segment, driven by high demand from the transportation and industrial sectors.
End-User Segment: The transportation sector accounts for the largest share of refined petroleum product consumption, due to the increasing number of vehicles.
Key Drivers:
Economic Policies: Government policies regarding fuel subsidies and taxation significantly influence market dynamics.
Infrastructure: The availability and quality of refining and distribution infrastructure play a crucial role in market growth.
Economic Growth: Strong economic growth, particularly in industrial and transportation sectors, fuels demand.
Population Growth: Increasing population further drives demand for refined petroleum products.
East Africa Downstream Oil and Gas Industry Product Innovations
The East African downstream oil and gas industry is witnessing significant product innovations focused on improving fuel efficiency, reducing emissions, and diversifying product offerings. The focus is on the development of higher-quality lubricants and the expansion of LPG distribution networks. Technological advances in refining processes are improving efficiency and reducing waste. These developments help improve market fit and competitiveness.
Report Scope & Segmentation Analysis
This report segments the East African downstream oil and gas market based on:
Product Segment: Refined Petroleum Products (Gasoline, Diesel, Jet Fuel, Kerosene), Lubricants, Petrochemicals, Liquefied Petroleum Gas (LPG). Each segment's analysis includes growth projections and competitive dynamics. For example, the refined petroleum products segment is expected to grow at xx% CAGR due to a steady increase in demand from various sectors. The LPG segment, while smaller, enjoys substantial growth potential driven by initiatives promoting clean cooking solutions.
End-User Segment: Industrial, Transportation, Commercial, Household. Each segment is analysed for its size, growth drivers, and competitive pressures. The industrial segment is anticipated to display strong growth due to industrialization and infrastructural development, while the household segment will be influenced by LPG penetration rates and consumer affordability.
Key Drivers of East Africa Downstream Oil and Gas Industry Growth
Key growth drivers include:
Increasing industrialization and urbanization: Driving demand for energy and transportation fuels.
Government investments in infrastructure: Facilitating better distribution and storage capacity.
Rising disposable incomes: Enhancing fuel consumption in personal transportation.
Technological advancements: Improving efficiency and enhancing product offerings.
Challenges in the East Africa Downstream Oil and Gas Industry Sector
The industry faces significant challenges, including:
Infrastructure constraints: Limiting efficient distribution and hindering timely deliveries.
Regulatory uncertainty: Creating difficulties in investment planning and execution.
Price volatility of crude oil: Affecting profitability and market stability.
Competition from renewable energy sources: Presenting a long-term threat to the traditional fuel market.
Emerging Opportunities in East Africa Downstream Oil and Gas Industry
Emerging opportunities include:
Growth of the LPG sector: Driven by clean cooking initiatives.
Expansion of petrochemical production: Meeting growing demands from the manufacturing sector.
Investments in renewable energy integration: Reducing reliance on fossil fuels.
Development of efficient logistics and distribution networks: Improving market access.
Leading Players in the East Africa Downstream Oil and Gas Industry Market
- China National Petroleum Corporation
- Eni SpA
- Royal Dutch Shell PLC
- Kenya Petroleum Refineries Ltd (KPRL)
- Total Energies Marketing Kenya
- Shell Kenya
- National Oil Corporation of Kenya (NOCK)
- Oil Libya (Tamoil)
- Sudan National Petroleum Corporation
- Petrogal SA
Key Developments in East Africa Downstream Oil and Gas Industry Industry
- December 2022: Savannah Energy's USD 1.25 Billion acquisition of oil fields in South Sudan, significantly impacting the market share and competitive landscape. This acquisition involved partnerships with China National Petroleum Corporation and others.
Future Outlook for East Africa Downstream Oil and Gas Industry Market
The East African downstream oil and gas market holds significant future potential, driven by continuous economic growth, population increase, and urbanization. Strategic investments in infrastructure development, coupled with the adoption of cleaner fuels and energy-efficient technologies, will shape its future trajectory. Despite challenges, the industry is expected to experience substantial growth over the forecast period, presenting attractive opportunities for investors and industry participants.
East Africa Downstream Oil and Gas Industry Segmentation
- 1. Refineries
- 2. Petrochemicals Plants
-
3. Geography
- 3.1. Mozambique
- 3.2. South Sudan
- 3.3. Kenya
- 3.4. Rest of East Africa
East Africa Downstream Oil and Gas Industry Segmentation By Geography
- 1. Mozambique
- 2. South Sudan
- 3. Kenya
- 4. Rest of East Africa
East Africa Downstream Oil and Gas Industry REPORT HIGHLIGHTS
| Aspects | Details |
|---|---|
| Study Period | 2019-2033 |
| Base Year | 2024 |
| Estimated Year | 2025 |
| Forecast Period | 2025-2033 |
| Historical Period | 2019-2024 |
| Growth Rate | CAGR of > 2.32% from 2019-2033 |
| Segmentation |
|
Table of Contents
- 1. Introduction
- 1.1. Research Scope
- 1.2. Market Segmentation
- 1.3. Research Methodology
- 1.4. Definitions and Assumptions
- 2. Executive Summary
- 2.1. Introduction
- 3. Market Dynamics
- 3.1. Introduction
- 3.2. Market Drivers
- 3.2.1. 4.; Increasing Electricity Demand4.; Rsing Investments in the Coal Industry
- 3.3. Market Restrains
- 3.3.1. 4.; Increasing Installation of Renewable Energy Sources
- 3.4. Market Trends
- 3.4.1. Refinery Capacity to Witness growth
- 4. Market Factor Analysis
- 4.1. Porters Five Forces
- 4.2. Supply/Value Chain
- 4.3. PESTEL analysis
- 4.4. Market Entropy
- 4.5. Patent/Trademark Analysis
- 5. East Africa Downstream Oil and Gas Industry Analysis, Insights and Forecast, 2019-2031
- 5.1. Market Analysis, Insights and Forecast - by Refineries
- 5.2. Market Analysis, Insights and Forecast - by Petrochemicals Plants
- 5.3. Market Analysis, Insights and Forecast - by Geography
- 5.3.1. Mozambique
- 5.3.2. South Sudan
- 5.3.3. Kenya
- 5.3.4. Rest of East Africa
- 5.4. Market Analysis, Insights and Forecast - by Region
- 5.4.1. Mozambique
- 5.4.2. South Sudan
- 5.4.3. Kenya
- 5.4.4. Rest of East Africa
- 5.1. Market Analysis, Insights and Forecast - by Refineries
- 6. Mozambique East Africa Downstream Oil and Gas Industry Analysis, Insights and Forecast, 2019-2031
- 6.1. Market Analysis, Insights and Forecast - by Refineries
- 6.2. Market Analysis, Insights and Forecast - by Petrochemicals Plants
- 6.3. Market Analysis, Insights and Forecast - by Geography
- 6.3.1. Mozambique
- 6.3.2. South Sudan
- 6.3.3. Kenya
- 6.3.4. Rest of East Africa
- 6.1. Market Analysis, Insights and Forecast - by Refineries
- 7. South Sudan East Africa Downstream Oil and Gas Industry Analysis, Insights and Forecast, 2019-2031
- 7.1. Market Analysis, Insights and Forecast - by Refineries
- 7.2. Market Analysis, Insights and Forecast - by Petrochemicals Plants
- 7.3. Market Analysis, Insights and Forecast - by Geography
- 7.3.1. Mozambique
- 7.3.2. South Sudan
- 7.3.3. Kenya
- 7.3.4. Rest of East Africa
- 7.1. Market Analysis, Insights and Forecast - by Refineries
- 8. Kenya East Africa Downstream Oil and Gas Industry Analysis, Insights and Forecast, 2019-2031
- 8.1. Market Analysis, Insights and Forecast - by Refineries
- 8.2. Market Analysis, Insights and Forecast - by Petrochemicals Plants
- 8.3. Market Analysis, Insights and Forecast - by Geography
- 8.3.1. Mozambique
- 8.3.2. South Sudan
- 8.3.3. Kenya
- 8.3.4. Rest of East Africa
- 8.1. Market Analysis, Insights and Forecast - by Refineries
- 9. Rest of East Africa East Africa Downstream Oil and Gas Industry Analysis, Insights and Forecast, 2019-2031
- 9.1. Market Analysis, Insights and Forecast - by Refineries
- 9.2. Market Analysis, Insights and Forecast - by Petrochemicals Plants
- 9.3. Market Analysis, Insights and Forecast - by Geography
- 9.3.1. Mozambique
- 9.3.2. South Sudan
- 9.3.3. Kenya
- 9.3.4. Rest of East Africa
- 9.1. Market Analysis, Insights and Forecast - by Refineries
- 10. South Africa East Africa Downstream Oil and Gas Industry Analysis, Insights and Forecast, 2019-2031
- 11. Sudan East Africa Downstream Oil and Gas Industry Analysis, Insights and Forecast, 2019-2031
- 12. Uganda East Africa Downstream Oil and Gas Industry Analysis, Insights and Forecast, 2019-2031
- 13. Tanzania East Africa Downstream Oil and Gas Industry Analysis, Insights and Forecast, 2019-2031
- 14. Kenya East Africa Downstream Oil and Gas Industry Analysis, Insights and Forecast, 2019-2031
- 15. Rest of Africa East Africa Downstream Oil and Gas Industry Analysis, Insights and Forecast, 2019-2031
- 16. Competitive Analysis
- 16.1. Market Share Analysis 2024
- 16.2. Company Profiles
- 16.2.1 Sudan National Petroleum Corporation
- 16.2.1.1. Overview
- 16.2.1.2. Products
- 16.2.1.3. SWOT Analysis
- 16.2.1.4. Recent Developments
- 16.2.1.5. Financials (Based on Availability)
- 16.2.2 China National Petroleum Corporation
- 16.2.2.1. Overview
- 16.2.2.2. Products
- 16.2.2.3. SWOT Analysis
- 16.2.2.4. Recent Developments
- 16.2.2.5. Financials (Based on Availability)
- 16.2.3 Petrogal SA*List Not Exhaustive
- 16.2.3.1. Overview
- 16.2.3.2. Products
- 16.2.3.3. SWOT Analysis
- 16.2.3.4. Recent Developments
- 16.2.3.5. Financials (Based on Availability)
- 16.2.4 Royal Dutch Shell PLC
- 16.2.4.1. Overview
- 16.2.4.2. Products
- 16.2.4.3. SWOT Analysis
- 16.2.4.4. Recent Developments
- 16.2.4.5. Financials (Based on Availability)
- 16.2.5 Eni SpA
- 16.2.5.1. Overview
- 16.2.5.2. Products
- 16.2.5.3. SWOT Analysis
- 16.2.5.4. Recent Developments
- 16.2.5.5. Financials (Based on Availability)
- 16.2.6 Kenya Petroleum Refineries Ltd (KPRL)
- 16.2.6.1. Overview
- 16.2.6.2. Products
- 16.2.6.3. SWOT Analysis
- 16.2.6.4. Recent Developments
- 16.2.6.5. Financials (Based on Availability)
- 16.2.7 Total Energies Marketing Kenya
- 16.2.7.1. Overview
- 16.2.7.2. Products
- 16.2.7.3. SWOT Analysis
- 16.2.7.4. Recent Developments
- 16.2.7.5. Financials (Based on Availability)
- 16.2.8 Shell Kenya
- 16.2.8.1. Overview
- 16.2.8.2. Products
- 16.2.8.3. SWOT Analysis
- 16.2.8.4. Recent Developments
- 16.2.8.5. Financials (Based on Availability)
- 16.2.9 National Oil Corporation of Kenya (NOCK)
- 16.2.9.1. Overview
- 16.2.9.2. Products
- 16.2.9.3. SWOT Analysis
- 16.2.9.4. Recent Developments
- 16.2.9.5. Financials (Based on Availability)
- 16.2.10 Oil Libya (Tamoil)
- 16.2.10.1. Overview
- 16.2.10.2. Products
- 16.2.10.3. SWOT Analysis
- 16.2.10.4. Recent Developments
- 16.2.10.5. Financials (Based on Availability)
- 16.2.1 Sudan National Petroleum Corporation
List of Figures
- Figure 1: East Africa Downstream Oil and Gas Industry Revenue Breakdown (Million, %) by Product 2024 & 2032
- Figure 2: East Africa Downstream Oil and Gas Industry Share (%) by Company 2024
List of Tables
- Table 1: East Africa Downstream Oil and Gas Industry Revenue Million Forecast, by Region 2019 & 2032
- Table 2: East Africa Downstream Oil and Gas Industry Volume liter Forecast, by Region 2019 & 2032
- Table 3: East Africa Downstream Oil and Gas Industry Revenue Million Forecast, by Refineries 2019 & 2032
- Table 4: East Africa Downstream Oil and Gas Industry Volume liter Forecast, by Refineries 2019 & 2032
- Table 5: East Africa Downstream Oil and Gas Industry Revenue Million Forecast, by Petrochemicals Plants 2019 & 2032
- Table 6: East Africa Downstream Oil and Gas Industry Volume liter Forecast, by Petrochemicals Plants 2019 & 2032
- Table 7: East Africa Downstream Oil and Gas Industry Revenue Million Forecast, by Geography 2019 & 2032
- Table 8: East Africa Downstream Oil and Gas Industry Volume liter Forecast, by Geography 2019 & 2032
- Table 9: East Africa Downstream Oil and Gas Industry Revenue Million Forecast, by Region 2019 & 2032
- Table 10: East Africa Downstream Oil and Gas Industry Volume liter Forecast, by Region 2019 & 2032
- Table 11: East Africa Downstream Oil and Gas Industry Revenue Million Forecast, by Country 2019 & 2032
- Table 12: East Africa Downstream Oil and Gas Industry Volume liter Forecast, by Country 2019 & 2032
- Table 13: South Africa East Africa Downstream Oil and Gas Industry Revenue (Million) Forecast, by Application 2019 & 2032
- Table 14: South Africa East Africa Downstream Oil and Gas Industry Volume (liter ) Forecast, by Application 2019 & 2032
- Table 15: Sudan East Africa Downstream Oil and Gas Industry Revenue (Million) Forecast, by Application 2019 & 2032
- Table 16: Sudan East Africa Downstream Oil and Gas Industry Volume (liter ) Forecast, by Application 2019 & 2032
- Table 17: Uganda East Africa Downstream Oil and Gas Industry Revenue (Million) Forecast, by Application 2019 & 2032
- Table 18: Uganda East Africa Downstream Oil and Gas Industry Volume (liter ) Forecast, by Application 2019 & 2032
- Table 19: Tanzania East Africa Downstream Oil and Gas Industry Revenue (Million) Forecast, by Application 2019 & 2032
- Table 20: Tanzania East Africa Downstream Oil and Gas Industry Volume (liter ) Forecast, by Application 2019 & 2032
- Table 21: Kenya East Africa Downstream Oil and Gas Industry Revenue (Million) Forecast, by Application 2019 & 2032
- Table 22: Kenya East Africa Downstream Oil and Gas Industry Volume (liter ) Forecast, by Application 2019 & 2032
- Table 23: Rest of Africa East Africa Downstream Oil and Gas Industry Revenue (Million) Forecast, by Application 2019 & 2032
- Table 24: Rest of Africa East Africa Downstream Oil and Gas Industry Volume (liter ) Forecast, by Application 2019 & 2032
- Table 25: East Africa Downstream Oil and Gas Industry Revenue Million Forecast, by Refineries 2019 & 2032
- Table 26: East Africa Downstream Oil and Gas Industry Volume liter Forecast, by Refineries 2019 & 2032
- Table 27: East Africa Downstream Oil and Gas Industry Revenue Million Forecast, by Petrochemicals Plants 2019 & 2032
- Table 28: East Africa Downstream Oil and Gas Industry Volume liter Forecast, by Petrochemicals Plants 2019 & 2032
- Table 29: East Africa Downstream Oil and Gas Industry Revenue Million Forecast, by Geography 2019 & 2032
- Table 30: East Africa Downstream Oil and Gas Industry Volume liter Forecast, by Geography 2019 & 2032
- Table 31: East Africa Downstream Oil and Gas Industry Revenue Million Forecast, by Country 2019 & 2032
- Table 32: East Africa Downstream Oil and Gas Industry Volume liter Forecast, by Country 2019 & 2032
- Table 33: East Africa Downstream Oil and Gas Industry Revenue Million Forecast, by Refineries 2019 & 2032
- Table 34: East Africa Downstream Oil and Gas Industry Volume liter Forecast, by Refineries 2019 & 2032
- Table 35: East Africa Downstream Oil and Gas Industry Revenue Million Forecast, by Petrochemicals Plants 2019 & 2032
- Table 36: East Africa Downstream Oil and Gas Industry Volume liter Forecast, by Petrochemicals Plants 2019 & 2032
- Table 37: East Africa Downstream Oil and Gas Industry Revenue Million Forecast, by Geography 2019 & 2032
- Table 38: East Africa Downstream Oil and Gas Industry Volume liter Forecast, by Geography 2019 & 2032
- Table 39: East Africa Downstream Oil and Gas Industry Revenue Million Forecast, by Country 2019 & 2032
- Table 40: East Africa Downstream Oil and Gas Industry Volume liter Forecast, by Country 2019 & 2032
- Table 41: East Africa Downstream Oil and Gas Industry Revenue Million Forecast, by Refineries 2019 & 2032
- Table 42: East Africa Downstream Oil and Gas Industry Volume liter Forecast, by Refineries 2019 & 2032
- Table 43: East Africa Downstream Oil and Gas Industry Revenue Million Forecast, by Petrochemicals Plants 2019 & 2032
- Table 44: East Africa Downstream Oil and Gas Industry Volume liter Forecast, by Petrochemicals Plants 2019 & 2032
- Table 45: East Africa Downstream Oil and Gas Industry Revenue Million Forecast, by Geography 2019 & 2032
- Table 46: East Africa Downstream Oil and Gas Industry Volume liter Forecast, by Geography 2019 & 2032
- Table 47: East Africa Downstream Oil and Gas Industry Revenue Million Forecast, by Country 2019 & 2032
- Table 48: East Africa Downstream Oil and Gas Industry Volume liter Forecast, by Country 2019 & 2032
- Table 49: East Africa Downstream Oil and Gas Industry Revenue Million Forecast, by Refineries 2019 & 2032
- Table 50: East Africa Downstream Oil and Gas Industry Volume liter Forecast, by Refineries 2019 & 2032
- Table 51: East Africa Downstream Oil and Gas Industry Revenue Million Forecast, by Petrochemicals Plants 2019 & 2032
- Table 52: East Africa Downstream Oil and Gas Industry Volume liter Forecast, by Petrochemicals Plants 2019 & 2032
- Table 53: East Africa Downstream Oil and Gas Industry Revenue Million Forecast, by Geography 2019 & 2032
- Table 54: East Africa Downstream Oil and Gas Industry Volume liter Forecast, by Geography 2019 & 2032
- Table 55: East Africa Downstream Oil and Gas Industry Revenue Million Forecast, by Country 2019 & 2032
- Table 56: East Africa Downstream Oil and Gas Industry Volume liter Forecast, by Country 2019 & 2032
Frequently Asked Questions
1. What is the projected Compound Annual Growth Rate (CAGR) of the East Africa Downstream Oil and Gas Industry?
The projected CAGR is approximately > 2.32%.
2. Which companies are prominent players in the East Africa Downstream Oil and Gas Industry?
Key companies in the market include Sudan National Petroleum Corporation, China National Petroleum Corporation, Petrogal SA*List Not Exhaustive, Royal Dutch Shell PLC, Eni SpA, Kenya Petroleum Refineries Ltd (KPRL) , Total Energies Marketing Kenya , Shell Kenya , National Oil Corporation of Kenya (NOCK) , Oil Libya (Tamoil).
3. What are the main segments of the East Africa Downstream Oil and Gas Industry?
The market segments include Refineries, Petrochemicals Plants, Geography.
4. Can you provide details about the market size?
The market size is estimated to be USD 17500 Million as of 2022.
5. What are some drivers contributing to market growth?
4.; Increasing Electricity Demand4.; Rsing Investments in the Coal Industry.
6. What are the notable trends driving market growth?
Refinery Capacity to Witness growth.
7. Are there any restraints impacting market growth?
4.; Increasing Installation of Renewable Energy Sources.
8. Can you provide examples of recent developments in the market?
In December 2022, Savannah Energy declared the acquisition of producing oil fields in South Sudan from Malaysian state oil and gas company Petronas. The investment is valued at USD 1.25 billion. The other partners include the international energy company, the China National Petroleum Corporation, India's flagship energy major, the Oil and Natural Gas Corporation, and South Sudan's national oil and gas company, Nilepet.
9. What pricing options are available for accessing the report?
Pricing options include single-user, multi-user, and enterprise licenses priced at USD 4750, USD 5250, and USD 8750 respectively.
10. Is the market size provided in terms of value or volume?
The market size is provided in terms of value, measured in Million and volume, measured in liter .
11. Are there any specific market keywords associated with the report?
Yes, the market keyword associated with the report is "East Africa Downstream Oil and Gas Industry," which aids in identifying and referencing the specific market segment covered.
12. How do I determine which pricing option suits my needs best?
The pricing options vary based on user requirements and access needs. Individual users may opt for single-user licenses, while businesses requiring broader access may choose multi-user or enterprise licenses for cost-effective access to the report.
13. Are there any additional resources or data provided in the East Africa Downstream Oil and Gas Industry report?
While the report offers comprehensive insights, it's advisable to review the specific contents or supplementary materials provided to ascertain if additional resources or data are available.
14. How can I stay updated on further developments or reports in the East Africa Downstream Oil and Gas Industry?
To stay informed about further developments, trends, and reports in the East Africa Downstream Oil and Gas Industry, consider subscribing to industry newsletters, following relevant companies and organizations, or regularly checking reputable industry news sources and publications.
Methodology
Step 1 - Identification of Relevant Samples Size from Population Database


Step 2 - Approaches for Defining Global Market Size (Value, Volume* & Price*)

Note*: In applicable scenarios
Step 3 - Data Sources
Primary Research
- Web Analytics
- Survey Reports
- Research Institute
- Latest Research Reports
- Opinion Leaders
Secondary Research
- Annual Reports
- White Paper
- Latest Press Release
- Industry Association
- Paid Database
- Investor Presentations

Step 4 - Data Triangulation
Involves using different sources of information in order to increase the validity of a study
These sources are likely to be stakeholders in a program - participants, other researchers, program staff, other community members, and so on.
Then we put all data in single framework & apply various statistical tools to find out the dynamic on the market.
During the analysis stage, feedback from the stakeholder groups would be compared to determine areas of agreement as well as areas of divergence


