
Key Insights
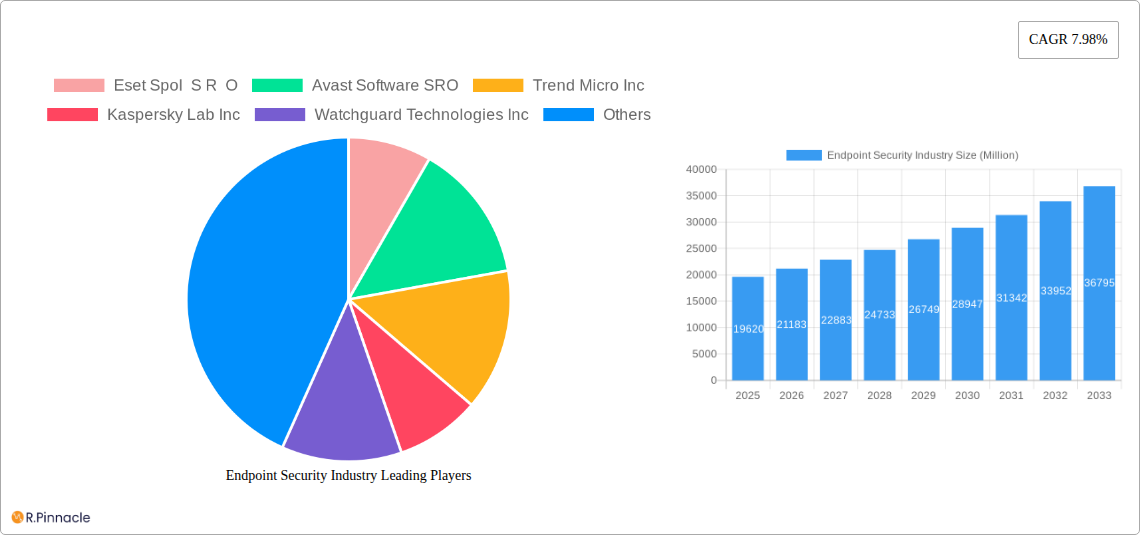
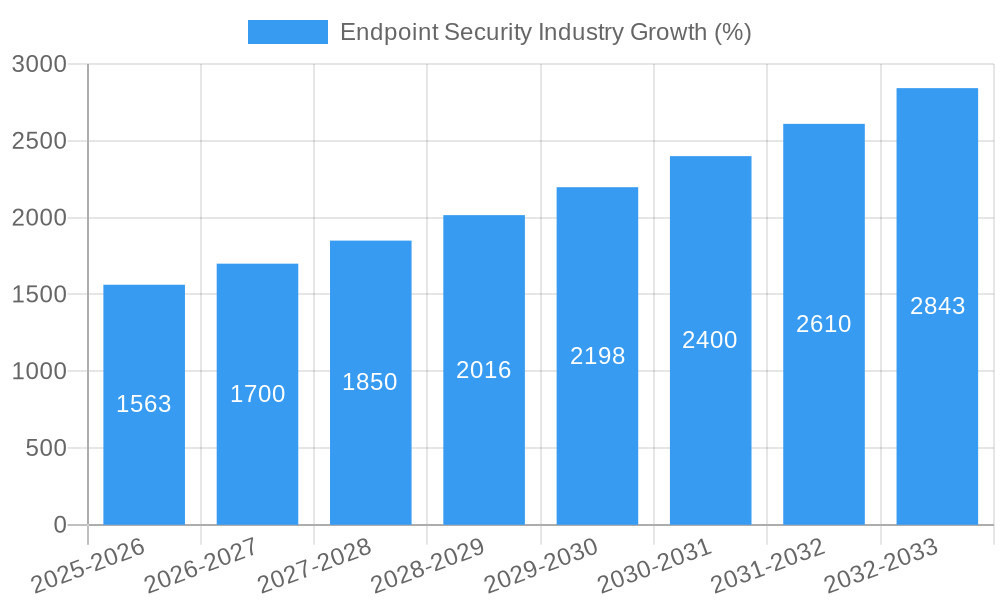
The endpoint security market, valued at $19.62 billion in 2025, is experiencing robust growth, projected to expand at a compound annual growth rate (CAGR) of 7.98% from 2025 to 2033. This expansion is driven by the escalating frequency and sophistication of cyberattacks targeting individual users and businesses alike. The increasing reliance on remote work and cloud-based services has broadened the attack surface, necessitating robust endpoint security solutions. Furthermore, the growing adoption of Internet of Things (IoT) devices and the increasing prevalence of ransomware attacks are key factors fueling market growth. The market is segmented by end-user into consumer and business segments, with the business segment currently holding a larger share due to higher spending on security infrastructure and compliance requirements. Major players like Eset, Avast, Trend Micro, and Kaspersky, along with established IT giants such as Microsoft and Cisco, are actively competing in this dynamic landscape, constantly innovating with advanced threat detection, response, and prevention technologies. The competitive landscape is characterized by a mix of established players and emerging startups focusing on areas like artificial intelligence (AI)-powered threat detection and endpoint detection and response (EDR) solutions.
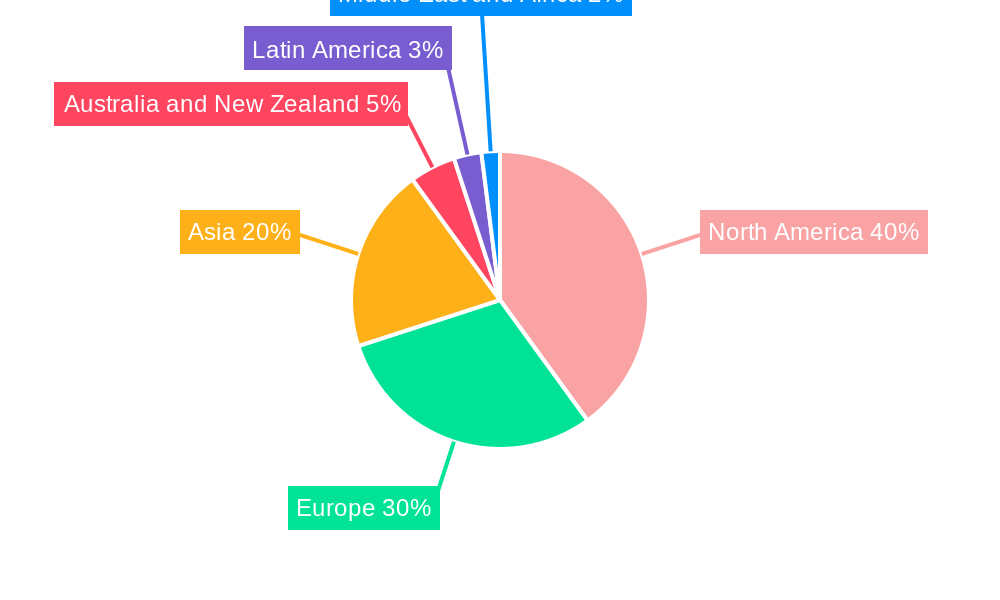
The geographical distribution of the market reveals significant regional variations. North America is expected to maintain a substantial market share due to high technological adoption and the presence of key industry players. Europe follows closely, with strong growth anticipated in emerging economies within Asia, driven by increasing digitalization and government initiatives aimed at cybersecurity enhancement. The market's growth trajectory is expected to remain positive throughout the forecast period, driven by factors such as continuous technological advancements, heightened cybersecurity awareness, and evolving regulatory frameworks. However, challenges such as the rising cost of advanced security solutions and the need for continuous updates and training could act as potential restraints on market growth. The market's future evolution will depend on the successful integration of AI and machine learning into endpoint security solutions, the development of more effective threat intelligence platforms, and the increasing adoption of cloud-based security services.
Endpoint Security Industry Report: 2019-2033
This comprehensive report provides an in-depth analysis of the Endpoint Security industry, covering market size, growth drivers, competitive landscape, and future outlook from 2019 to 2033. With a focus on actionable insights for industry professionals, this report is a must-read for anyone involved in or seeking to understand this dynamic sector. The report leverages a robust methodology and incorporates real-world data to offer a clear picture of the current state and future trajectory of the endpoint security market, projecting a market value exceeding xx Million by 2033.
Endpoint Security Industry Market Structure & Innovation Trends
The endpoint security market, valued at xx Million in 2025, exhibits a moderately concentrated structure. Key players like Microsoft Corporation, Crowdstrike Holdings Inc, and Palo Alto Networks Inc hold significant market share, though the presence of numerous smaller, specialized vendors fosters competition. Market share data for 2025 estimates Microsoft at xx%, Crowdstrike at xx%, and Palo Alto Networks at xx%, with the remaining share distributed among other players. Innovation is driven by the evolving threat landscape, necessitating continuous advancements in detection, prevention, and response capabilities. The regulatory landscape, particularly GDPR and CCPA, influences vendor strategies and consumer expectations regarding data privacy and security. Product substitutes, such as legacy antivirus software, are gradually losing ground to comprehensive endpoint detection and response (EDR) solutions. Significant M&A activity has been observed, with deal values totaling xx Million in the last five years. This consolidation reflects the strategic importance of endpoint security and the need for larger players to expand their capabilities and market reach.
- Market Concentration: Moderately concentrated with several major players and numerous niche vendors.
- Innovation Drivers: Evolving threat landscape, regulatory compliance (GDPR, CCPA), and demand for advanced threat detection.
- M&A Activity: Significant activity over the past five years, totaling xx Million in deal value, driven by the need for expansion and capability enhancement.
- End-user Demographics: Businesses are the dominant end-user segment, driven by increased digitalization.
Endpoint Security Industry Market Dynamics & Trends
The endpoint security market exhibits robust growth, driven by factors such as the increasing adoption of cloud computing, remote work models, and the growing sophistication of cyber threats. The compound annual growth rate (CAGR) from 2025 to 2033 is projected at xx%, resulting in a market size of xx Million by 2033. Market penetration is currently at approximately xx% and is expected to rise considerably. Technological advancements, including AI and machine learning in threat detection, contribute significantly to this growth. Consumer preferences are shifting towards comprehensive security solutions offering seamless integration and ease of use. The competitive landscape is characterized by fierce competition among established players and emerging startups, leading to continuous innovation and price optimization. The shift towards cloud-based solutions and the integration of endpoint security with other security layers (e.g., network security, data security) are major market trends. The market is also influenced by government regulations and cybersecurity awareness campaigns that encourage users to adopt stronger security measures.
Dominant Regions & Segments in Endpoint Security Industry
North America currently dominates the endpoint security market, followed by Europe and Asia-Pacific. This dominance is driven by several factors, including higher levels of digital adoption, robust IT infrastructure, and stringent data privacy regulations.
- North America: High digital adoption, robust IT infrastructure, strong regulatory landscape, and significant investment in cybersecurity measures.
- Europe: Stringent data privacy regulations (GDPR) drive demand for advanced security solutions.
- Asia-Pacific: Rapid economic growth, rising internet penetration, and increasing government focus on cybersecurity.
The Business segment holds a significantly larger share (approximately xx%) of the market compared to the Consumer segment (approximately xx%). This is due to higher security needs of businesses with larger data assets and greater reliance on digital infrastructure.
Endpoint Security Industry Product Innovations
Recent product developments focus on enhanced threat detection using AI/ML, improved threat response capabilities (e.g., automated remediation), and seamless integration with other security solutions. Endpoint Detection and Response (EDR) solutions remain a key area of innovation, alongside the growing integration of Extended Detection and Response (XDR) platforms. These innovative products offer significant competitive advantages through superior threat prevention and response capabilities, enabling businesses to better protect against increasingly sophisticated cyberattacks. The market is also witnessing an increasing trend towards cloud-based and SaaS solutions that provide scalability, ease of management and reduced costs for businesses.
Report Scope & Segmentation Analysis
This report segments the endpoint security market by end-user:
Consumer Segment: This segment focuses on individuals and households. The growth is projected at xx% CAGR from 2025 to 2033, reaching xx Million by 2033. The market is highly competitive, with a large number of players offering various solutions.
Business Segment: This segment caters to enterprises and organizations of all sizes. The projected growth is xx% CAGR from 2025 to 2033, reaching xx Million by 2033. This segment is marked by intense competition amongst established players and new entrants. The market is driven by the increasing adoption of advanced security solutions such as EDR and XDR.
Key Drivers of Endpoint Security Industry Growth
The growth of the endpoint security market is fueled by several key factors: the increasing adoption of cloud computing and remote work, leading to a wider attack surface; the sophistication and frequency of cyberattacks; rising awareness of data privacy regulations; and continuous technological advancements in threat detection and response. Government regulations mandating stronger security measures further contribute to market expansion.
Challenges in the Endpoint Security Industry Sector
The endpoint security industry faces challenges such as the ever-evolving nature of cyber threats, making it difficult for solutions to keep pace; the complexity of integrating endpoint security with other security layers; and the high cost of deploying and maintaining advanced security solutions. The industry also faces supply chain vulnerabilities and the increasing pressure of competitive pricing.
Emerging Opportunities in Endpoint Security Industry
Emerging opportunities lie in the development and adoption of AI-powered solutions, offering more effective threat detection and response; the growing demand for XDR solutions offering unified security across multiple endpoints; and the expansion of endpoint security into new markets, including IoT devices and industrial control systems.
Leading Players in the Endpoint Security Industry Market
- Eset Spol S R O
- Avast Software SRO
- Trend Micro Inc
- Kaspersky Lab Inc
- Watchguard Technologies Inc
- Bitdefender LLC
- Fortinet Inc
- Musarubra Us LLC (Trellix)
- Cybereason Inc
- Cisco Systems Inc
- Broadcom Inc
- Microsoft Corporation
- Blackberry Limite
- Sophos Ltd
- Open Text Corporation
- Crowdstrike Holdings Inc
- Sentinelone Inc
- Palo Alto Networks Inc
- Deep Instinct Ltd
Key Developments in Endpoint Security Industry Industry
- February 2024: NinjaOne secured USD 231.5 Million in Series C funding, boosting its expansion in the endpoint security market.
- January 2024: ASUS partnered with IBM to offer IBM's AI-powered endpoint security solution, indicating increasing adoption of AI in EDR.
Future Outlook for Endpoint Security Industry Market
The future of the endpoint security market is bright, driven by sustained growth in cloud adoption, increasing cyber threats, and the continuous innovation in security technologies. Strategic opportunities exist for players who can effectively address the evolving threat landscape through advanced threat detection, automated response capabilities, and seamless integration with other security solutions. The market is poised for continued expansion as organizations prioritize robust security to protect their valuable data and reputation.
Endpoint Security Industry Segmentation
-
1. End User
- 1.1. Consumer
-
1.2. Business
- 1.2.1. BFSI
- 1.2.2. Government
- 1.2.3. Manufacturing
- 1.2.4. Healthcare
- 1.2.5. Energy and Power
- 1.2.6. Retail
- 1.2.7. Other Businesses
Endpoint Security Industry Segmentation By Geography
- 1. North America
- 2. Europe
- 3. Asia
- 4. Australia and New Zealand
- 5. Latin America
- 6. Middle East and Africa
Endpoint Security Industry REPORT HIGHLIGHTS
| Aspects | Details |
|---|---|
| Study Period | 2019-2033 |
| Base Year | 2024 |
| Estimated Year | 2025 |
| Forecast Period | 2025-2033 |
| Historical Period | 2019-2024 |
| Growth Rate | CAGR of 7.98% from 2019-2033 |
| Segmentation |
|
Table of Contents
- 1. Introduction
- 1.1. Research Scope
- 1.2. Market Segmentation
- 1.3. Research Methodology
- 1.4. Definitions and Assumptions
- 2. Executive Summary
- 2.1. Introduction
- 3. Market Dynamics
- 3.1. Introduction
- 3.2. Market Drivers
- 3.2.1. Growth in Smart Devices; Increasing Number of Data Breaches
- 3.3. Market Restrains
- 3.3.1. Failure of the Widespread Adoption of 4G Services Due to Insufficient Users; Lack of Internet Penetration in Certain Areas
- 3.4. Market Trends
- 3.4.1. Consumer Segment is Expected to Witness Significant Growth
- 4. Market Factor Analysis
- 4.1. Porters Five Forces
- 4.2. Supply/Value Chain
- 4.3. PESTEL analysis
- 4.4. Market Entropy
- 4.5. Patent/Trademark Analysis
- 5. Global Endpoint Security Industry Analysis, Insights and Forecast, 2019-2031
- 5.1. Market Analysis, Insights and Forecast - by End User
- 5.1.1. Consumer
- 5.1.2. Business
- 5.1.2.1. BFSI
- 5.1.2.2. Government
- 5.1.2.3. Manufacturing
- 5.1.2.4. Healthcare
- 5.1.2.5. Energy and Power
- 5.1.2.6. Retail
- 5.1.2.7. Other Businesses
- 5.2. Market Analysis, Insights and Forecast - by Region
- 5.2.1. North America
- 5.2.2. Europe
- 5.2.3. Asia
- 5.2.4. Australia and New Zealand
- 5.2.5. Latin America
- 5.2.6. Middle East and Africa
- 5.1. Market Analysis, Insights and Forecast - by End User
- 6. North America Endpoint Security Industry Analysis, Insights and Forecast, 2019-2031
- 6.1. Market Analysis, Insights and Forecast - by End User
- 6.1.1. Consumer
- 6.1.2. Business
- 6.1.2.1. BFSI
- 6.1.2.2. Government
- 6.1.2.3. Manufacturing
- 6.1.2.4. Healthcare
- 6.1.2.5. Energy and Power
- 6.1.2.6. Retail
- 6.1.2.7. Other Businesses
- 6.1. Market Analysis, Insights and Forecast - by End User
- 7. Europe Endpoint Security Industry Analysis, Insights and Forecast, 2019-2031
- 7.1. Market Analysis, Insights and Forecast - by End User
- 7.1.1. Consumer
- 7.1.2. Business
- 7.1.2.1. BFSI
- 7.1.2.2. Government
- 7.1.2.3. Manufacturing
- 7.1.2.4. Healthcare
- 7.1.2.5. Energy and Power
- 7.1.2.6. Retail
- 7.1.2.7. Other Businesses
- 7.1. Market Analysis, Insights and Forecast - by End User
- 8. Asia Endpoint Security Industry Analysis, Insights and Forecast, 2019-2031
- 8.1. Market Analysis, Insights and Forecast - by End User
- 8.1.1. Consumer
- 8.1.2. Business
- 8.1.2.1. BFSI
- 8.1.2.2. Government
- 8.1.2.3. Manufacturing
- 8.1.2.4. Healthcare
- 8.1.2.5. Energy and Power
- 8.1.2.6. Retail
- 8.1.2.7. Other Businesses
- 8.1. Market Analysis, Insights and Forecast - by End User
- 9. Australia and New Zealand Endpoint Security Industry Analysis, Insights and Forecast, 2019-2031
- 9.1. Market Analysis, Insights and Forecast - by End User
- 9.1.1. Consumer
- 9.1.2. Business
- 9.1.2.1. BFSI
- 9.1.2.2. Government
- 9.1.2.3. Manufacturing
- 9.1.2.4. Healthcare
- 9.1.2.5. Energy and Power
- 9.1.2.6. Retail
- 9.1.2.7. Other Businesses
- 9.1. Market Analysis, Insights and Forecast - by End User
- 10. Latin America Endpoint Security Industry Analysis, Insights and Forecast, 2019-2031
- 10.1. Market Analysis, Insights and Forecast - by End User
- 10.1.1. Consumer
- 10.1.2. Business
- 10.1.2.1. BFSI
- 10.1.2.2. Government
- 10.1.2.3. Manufacturing
- 10.1.2.4. Healthcare
- 10.1.2.5. Energy and Power
- 10.1.2.6. Retail
- 10.1.2.7. Other Businesses
- 10.1. Market Analysis, Insights and Forecast - by End User
- 11. Middle East and Africa Endpoint Security Industry Analysis, Insights and Forecast, 2019-2031
- 11.1. Market Analysis, Insights and Forecast - by End User
- 11.1.1. Consumer
- 11.1.2. Business
- 11.1.2.1. BFSI
- 11.1.2.2. Government
- 11.1.2.3. Manufacturing
- 11.1.2.4. Healthcare
- 11.1.2.5. Energy and Power
- 11.1.2.6. Retail
- 11.1.2.7. Other Businesses
- 11.1. Market Analysis, Insights and Forecast - by End User
- 12. North America Endpoint Security Industry Analysis, Insights and Forecast, 2019-2031
- 12.1. Market Analysis, Insights and Forecast - By Country/Sub-region
- 12.1.1.
- 13. Europe Endpoint Security Industry Analysis, Insights and Forecast, 2019-2031
- 13.1. Market Analysis, Insights and Forecast - By Country/Sub-region
- 13.1.1.
- 14. Asia Endpoint Security Industry Analysis, Insights and Forecast, 2019-2031
- 14.1. Market Analysis, Insights and Forecast - By Country/Sub-region
- 14.1.1.
- 15. Australia and New Zealand Endpoint Security Industry Analysis, Insights and Forecast, 2019-2031
- 15.1. Market Analysis, Insights and Forecast - By Country/Sub-region
- 15.1.1.
- 16. Latin America Endpoint Security Industry Analysis, Insights and Forecast, 2019-2031
- 16.1. Market Analysis, Insights and Forecast - By Country/Sub-region
- 16.1.1.
- 17. Middle East and Africa Endpoint Security Industry Analysis, Insights and Forecast, 2019-2031
- 17.1. Market Analysis, Insights and Forecast - By Country/Sub-region
- 17.1.1.
- 18. Competitive Analysis
- 18.1. Global Market Share Analysis 2024
- 18.2. Company Profiles
- 18.2.1 Eset Spol S R O
- 18.2.1.1. Overview
- 18.2.1.2. Products
- 18.2.1.3. SWOT Analysis
- 18.2.1.4. Recent Developments
- 18.2.1.5. Financials (Based on Availability)
- 18.2.2 Avast Software SRO
- 18.2.2.1. Overview
- 18.2.2.2. Products
- 18.2.2.3. SWOT Analysis
- 18.2.2.4. Recent Developments
- 18.2.2.5. Financials (Based on Availability)
- 18.2.3 Trend Micro Inc
- 18.2.3.1. Overview
- 18.2.3.2. Products
- 18.2.3.3. SWOT Analysis
- 18.2.3.4. Recent Developments
- 18.2.3.5. Financials (Based on Availability)
- 18.2.4 Kaspersky Lab Inc
- 18.2.4.1. Overview
- 18.2.4.2. Products
- 18.2.4.3. SWOT Analysis
- 18.2.4.4. Recent Developments
- 18.2.4.5. Financials (Based on Availability)
- 18.2.5 Watchguard Technologies Inc
- 18.2.5.1. Overview
- 18.2.5.2. Products
- 18.2.5.3. SWOT Analysis
- 18.2.5.4. Recent Developments
- 18.2.5.5. Financials (Based on Availability)
- 18.2.6 Bitdefender LLC
- 18.2.6.1. Overview
- 18.2.6.2. Products
- 18.2.6.3. SWOT Analysis
- 18.2.6.4. Recent Developments
- 18.2.6.5. Financials (Based on Availability)
- 18.2.7 Fortinet Inc
- 18.2.7.1. Overview
- 18.2.7.2. Products
- 18.2.7.3. SWOT Analysis
- 18.2.7.4. Recent Developments
- 18.2.7.5. Financials (Based on Availability)
- 18.2.8 Musarubra Us LLC (Trellix)
- 18.2.8.1. Overview
- 18.2.8.2. Products
- 18.2.8.3. SWOT Analysis
- 18.2.8.4. Recent Developments
- 18.2.8.5. Financials (Based on Availability)
- 18.2.9 Cybereason Inc
- 18.2.9.1. Overview
- 18.2.9.2. Products
- 18.2.9.3. SWOT Analysis
- 18.2.9.4. Recent Developments
- 18.2.9.5. Financials (Based on Availability)
- 18.2.10 Cisco Systems Inc
- 18.2.10.1. Overview
- 18.2.10.2. Products
- 18.2.10.3. SWOT Analysis
- 18.2.10.4. Recent Developments
- 18.2.10.5. Financials (Based on Availability)
- 18.2.11 Broadcom Inc
- 18.2.11.1. Overview
- 18.2.11.2. Products
- 18.2.11.3. SWOT Analysis
- 18.2.11.4. Recent Developments
- 18.2.11.5. Financials (Based on Availability)
- 18.2.12 Microsoft Corporation
- 18.2.12.1. Overview
- 18.2.12.2. Products
- 18.2.12.3. SWOT Analysis
- 18.2.12.4. Recent Developments
- 18.2.12.5. Financials (Based on Availability)
- 18.2.13 Blackberry Limite
- 18.2.13.1. Overview
- 18.2.13.2. Products
- 18.2.13.3. SWOT Analysis
- 18.2.13.4. Recent Developments
- 18.2.13.5. Financials (Based on Availability)
- 18.2.14 Sophos Ltd
- 18.2.14.1. Overview
- 18.2.14.2. Products
- 18.2.14.3. SWOT Analysis
- 18.2.14.4. Recent Developments
- 18.2.14.5. Financials (Based on Availability)
- 18.2.15 Open Text Corporation
- 18.2.15.1. Overview
- 18.2.15.2. Products
- 18.2.15.3. SWOT Analysis
- 18.2.15.4. Recent Developments
- 18.2.15.5. Financials (Based on Availability)
- 18.2.16 Crowdstrike Holdings Inc
- 18.2.16.1. Overview
- 18.2.16.2. Products
- 18.2.16.3. SWOT Analysis
- 18.2.16.4. Recent Developments
- 18.2.16.5. Financials (Based on Availability)
- 18.2.17 Sentinelone Inc
- 18.2.17.1. Overview
- 18.2.17.2. Products
- 18.2.17.3. SWOT Analysis
- 18.2.17.4. Recent Developments
- 18.2.17.5. Financials (Based on Availability)
- 18.2.18 Palo Alto Networks Inc
- 18.2.18.1. Overview
- 18.2.18.2. Products
- 18.2.18.3. SWOT Analysis
- 18.2.18.4. Recent Developments
- 18.2.18.5. Financials (Based on Availability)
- 18.2.19 Deep Instinct Ltd
- 18.2.19.1. Overview
- 18.2.19.2. Products
- 18.2.19.3. SWOT Analysis
- 18.2.19.4. Recent Developments
- 18.2.19.5. Financials (Based on Availability)
- 18.2.1 Eset Spol S R O
List of Figures
- Figure 1: Global Endpoint Security Industry Revenue Breakdown (Million, %) by Region 2024 & 2032
- Figure 2: North America Endpoint Security Industry Revenue (Million), by Country 2024 & 2032
- Figure 3: North America Endpoint Security Industry Revenue Share (%), by Country 2024 & 2032
- Figure 4: Europe Endpoint Security Industry Revenue (Million), by Country 2024 & 2032
- Figure 5: Europe Endpoint Security Industry Revenue Share (%), by Country 2024 & 2032
- Figure 6: Asia Endpoint Security Industry Revenue (Million), by Country 2024 & 2032
- Figure 7: Asia Endpoint Security Industry Revenue Share (%), by Country 2024 & 2032
- Figure 8: Australia and New Zealand Endpoint Security Industry Revenue (Million), by Country 2024 & 2032
- Figure 9: Australia and New Zealand Endpoint Security Industry Revenue Share (%), by Country 2024 & 2032
- Figure 10: Latin America Endpoint Security Industry Revenue (Million), by Country 2024 & 2032
- Figure 11: Latin America Endpoint Security Industry Revenue Share (%), by Country 2024 & 2032
- Figure 12: Middle East and Africa Endpoint Security Industry Revenue (Million), by Country 2024 & 2032
- Figure 13: Middle East and Africa Endpoint Security Industry Revenue Share (%), by Country 2024 & 2032
- Figure 14: North America Endpoint Security Industry Revenue (Million), by End User 2024 & 2032
- Figure 15: North America Endpoint Security Industry Revenue Share (%), by End User 2024 & 2032
- Figure 16: North America Endpoint Security Industry Revenue (Million), by Country 2024 & 2032
- Figure 17: North America Endpoint Security Industry Revenue Share (%), by Country 2024 & 2032
- Figure 18: Europe Endpoint Security Industry Revenue (Million), by End User 2024 & 2032
- Figure 19: Europe Endpoint Security Industry Revenue Share (%), by End User 2024 & 2032
- Figure 20: Europe Endpoint Security Industry Revenue (Million), by Country 2024 & 2032
- Figure 21: Europe Endpoint Security Industry Revenue Share (%), by Country 2024 & 2032
- Figure 22: Asia Endpoint Security Industry Revenue (Million), by End User 2024 & 2032
- Figure 23: Asia Endpoint Security Industry Revenue Share (%), by End User 2024 & 2032
- Figure 24: Asia Endpoint Security Industry Revenue (Million), by Country 2024 & 2032
- Figure 25: Asia Endpoint Security Industry Revenue Share (%), by Country 2024 & 2032
- Figure 26: Australia and New Zealand Endpoint Security Industry Revenue (Million), by End User 2024 & 2032
- Figure 27: Australia and New Zealand Endpoint Security Industry Revenue Share (%), by End User 2024 & 2032
- Figure 28: Australia and New Zealand Endpoint Security Industry Revenue (Million), by Country 2024 & 2032
- Figure 29: Australia and New Zealand Endpoint Security Industry Revenue Share (%), by Country 2024 & 2032
- Figure 30: Latin America Endpoint Security Industry Revenue (Million), by End User 2024 & 2032
- Figure 31: Latin America Endpoint Security Industry Revenue Share (%), by End User 2024 & 2032
- Figure 32: Latin America Endpoint Security Industry Revenue (Million), by Country 2024 & 2032
- Figure 33: Latin America Endpoint Security Industry Revenue Share (%), by Country 2024 & 2032
- Figure 34: Middle East and Africa Endpoint Security Industry Revenue (Million), by End User 2024 & 2032
- Figure 35: Middle East and Africa Endpoint Security Industry Revenue Share (%), by End User 2024 & 2032
- Figure 36: Middle East and Africa Endpoint Security Industry Revenue (Million), by Country 2024 & 2032
- Figure 37: Middle East and Africa Endpoint Security Industry Revenue Share (%), by Country 2024 & 2032
List of Tables
- Table 1: Global Endpoint Security Industry Revenue Million Forecast, by Region 2019 & 2032
- Table 2: Global Endpoint Security Industry Revenue Million Forecast, by End User 2019 & 2032
- Table 3: Global Endpoint Security Industry Revenue Million Forecast, by Region 2019 & 2032
- Table 4: Global Endpoint Security Industry Revenue Million Forecast, by Country 2019 & 2032
- Table 5: Endpoint Security Industry Revenue (Million) Forecast, by Application 2019 & 2032
- Table 6: Global Endpoint Security Industry Revenue Million Forecast, by Country 2019 & 2032
- Table 7: Endpoint Security Industry Revenue (Million) Forecast, by Application 2019 & 2032
- Table 8: Global Endpoint Security Industry Revenue Million Forecast, by Country 2019 & 2032
- Table 9: Endpoint Security Industry Revenue (Million) Forecast, by Application 2019 & 2032
- Table 10: Global Endpoint Security Industry Revenue Million Forecast, by Country 2019 & 2032
- Table 11: Endpoint Security Industry Revenue (Million) Forecast, by Application 2019 & 2032
- Table 12: Global Endpoint Security Industry Revenue Million Forecast, by Country 2019 & 2032
- Table 13: Endpoint Security Industry Revenue (Million) Forecast, by Application 2019 & 2032
- Table 14: Global Endpoint Security Industry Revenue Million Forecast, by Country 2019 & 2032
- Table 15: Endpoint Security Industry Revenue (Million) Forecast, by Application 2019 & 2032
- Table 16: Global Endpoint Security Industry Revenue Million Forecast, by End User 2019 & 2032
- Table 17: Global Endpoint Security Industry Revenue Million Forecast, by Country 2019 & 2032
- Table 18: Global Endpoint Security Industry Revenue Million Forecast, by End User 2019 & 2032
- Table 19: Global Endpoint Security Industry Revenue Million Forecast, by Country 2019 & 2032
- Table 20: Global Endpoint Security Industry Revenue Million Forecast, by End User 2019 & 2032
- Table 21: Global Endpoint Security Industry Revenue Million Forecast, by Country 2019 & 2032
- Table 22: Global Endpoint Security Industry Revenue Million Forecast, by End User 2019 & 2032
- Table 23: Global Endpoint Security Industry Revenue Million Forecast, by Country 2019 & 2032
- Table 24: Global Endpoint Security Industry Revenue Million Forecast, by End User 2019 & 2032
- Table 25: Global Endpoint Security Industry Revenue Million Forecast, by Country 2019 & 2032
- Table 26: Global Endpoint Security Industry Revenue Million Forecast, by End User 2019 & 2032
- Table 27: Global Endpoint Security Industry Revenue Million Forecast, by Country 2019 & 2032
Frequently Asked Questions
1. What is the projected Compound Annual Growth Rate (CAGR) of the Endpoint Security Industry?
The projected CAGR is approximately 7.98%.
2. Which companies are prominent players in the Endpoint Security Industry?
Key companies in the market include Eset Spol S R O, Avast Software SRO, Trend Micro Inc, Kaspersky Lab Inc, Watchguard Technologies Inc, Bitdefender LLC, Fortinet Inc, Musarubra Us LLC (Trellix), Cybereason Inc, Cisco Systems Inc, Broadcom Inc, Microsoft Corporation, Blackberry Limite, Sophos Ltd, Open Text Corporation, Crowdstrike Holdings Inc, Sentinelone Inc, Palo Alto Networks Inc, Deep Instinct Ltd.
3. What are the main segments of the Endpoint Security Industry?
The market segments include End User.
4. Can you provide details about the market size?
The market size is estimated to be USD 19.62 Million as of 2022.
5. What are some drivers contributing to market growth?
Growth in Smart Devices; Increasing Number of Data Breaches.
6. What are the notable trends driving market growth?
Consumer Segment is Expected to Witness Significant Growth.
7. Are there any restraints impacting market growth?
Failure of the Widespread Adoption of 4G Services Due to Insufficient Users; Lack of Internet Penetration in Certain Areas.
8. Can you provide examples of recent developments in the market?
February 2024: NinjaOne, which provides endpoint management, security, and monitoring, raised a USD 231.5 million Series C led by Iconiq Growth, which would support its business expansion in the endpoint security market and can fuel the overall growth of the market by supporting the availability of endpoint security solutions.
9. What pricing options are available for accessing the report?
Pricing options include single-user, multi-user, and enterprise licenses priced at USD 4750, USD 5250, and USD 8750 respectively.
10. Is the market size provided in terms of value or volume?
The market size is provided in terms of value, measured in Million.
11. Are there any specific market keywords associated with the report?
Yes, the market keyword associated with the report is "Endpoint Security Industry," which aids in identifying and referencing the specific market segment covered.
12. How do I determine which pricing option suits my needs best?
The pricing options vary based on user requirements and access needs. Individual users may opt for single-user licenses, while businesses requiring broader access may choose multi-user or enterprise licenses for cost-effective access to the report.
13. Are there any additional resources or data provided in the Endpoint Security Industry report?
While the report offers comprehensive insights, it's advisable to review the specific contents or supplementary materials provided to ascertain if additional resources or data are available.
14. How can I stay updated on further developments or reports in the Endpoint Security Industry?
To stay informed about further developments, trends, and reports in the Endpoint Security Industry, consider subscribing to industry newsletters, following relevant companies and organizations, or regularly checking reputable industry news sources and publications.
Methodology
Step 1 - Identification of Relevant Samples Size from Population Database


Step 2 - Approaches for Defining Global Market Size (Value, Volume* & Price*)

Note*: In applicable scenarios
Step 3 - Data Sources
Primary Research
- Web Analytics
- Survey Reports
- Research Institute
- Latest Research Reports
- Opinion Leaders
Secondary Research
- Annual Reports
- White Paper
- Latest Press Release
- Industry Association
- Paid Database
- Investor Presentations

Step 4 - Data Triangulation
Involves using different sources of information in order to increase the validity of a study
These sources are likely to be stakeholders in a program - participants, other researchers, program staff, other community members, and so on.
Then we put all data in single framework & apply various statistical tools to find out the dynamic on the market.
During the analysis stage, feedback from the stakeholder groups would be compared to determine areas of agreement as well as areas of divergence


