
Key Insights
The Enterprise High-Productivity Application Platform as a Service (hPaaS) market is experiencing robust growth, driven by the increasing demand for rapid application development, digital transformation initiatives, and the need for greater agility within organizations. The market's expansion is fueled by several key factors, including the rising adoption of cloud-based solutions, the increasing complexity of business processes requiring customized applications, and the growing preference for low-code/no-code development platforms that empower citizen developers. Major players like OutSystems, Mendix, Salesforce, and Microsoft are actively shaping the market landscape through continuous innovation and strategic acquisitions, consolidating their market positions and expanding their feature sets. This competitive environment fosters innovation and drives down costs, making hPaaS solutions more accessible to a wider range of businesses, from large enterprises to small and medium-sized enterprises (SMEs). The market is segmented by deployment (cloud, on-premise), organization size (small, medium, large), and industry vertical (BFSI, healthcare, retail, etc.), each showing varying growth rates depending on technological maturity and adoption speed.
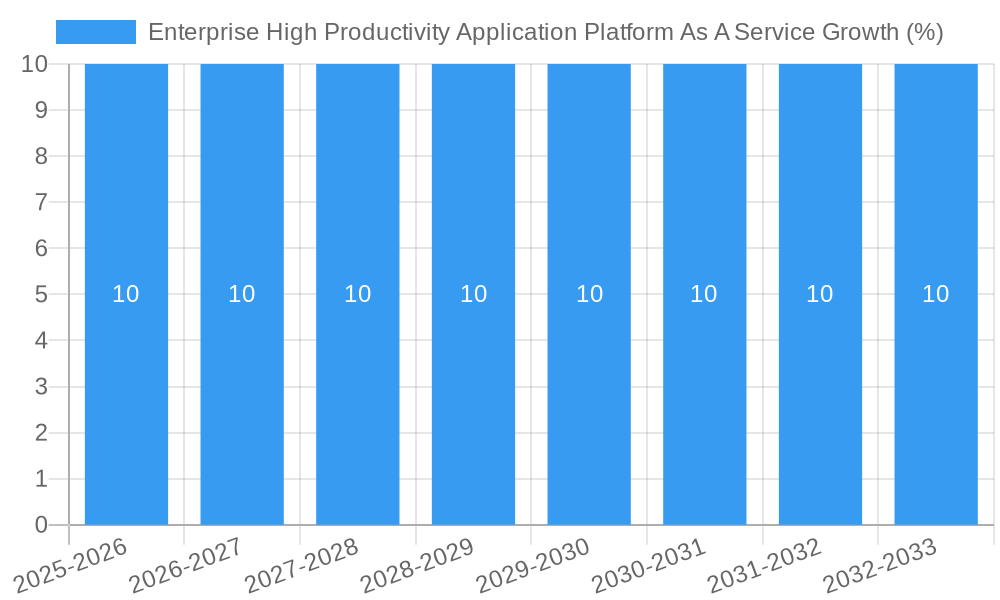
Looking ahead, the hPaaS market is poised for continued expansion, propelled by ongoing technological advancements like AI-powered development tools and enhanced integration capabilities. The increasing focus on automation and improved user experiences will further accelerate market growth. While potential restraints such as security concerns and the need for skilled developers remain, the overall market trajectory is positive, indicating substantial growth opportunities for both established players and new entrants. The market is expected to witness a considerable increase in adoption across various industries, particularly those facing pressure to rapidly adapt to changing market conditions and customer demands. This translates to considerable expansion within the next decade, with consistent year-on-year growth.
Enterprise High Productivity Application Platform as a Service (aPaaS) Market Report: 2019-2033
This comprehensive report provides an in-depth analysis of the Enterprise High Productivity Application Platform as a Service (aPaaS) market, projecting a multi-million dollar valuation by 2033. It offers invaluable insights for industry professionals, investors, and strategic decision-makers seeking to navigate this rapidly evolving landscape. The study covers the historical period (2019-2024), the base year (2025), and forecasts the market's trajectory from 2025 to 2033.
Enterprise High Productivity Application Platform As A Service Market Structure & Innovation Trends
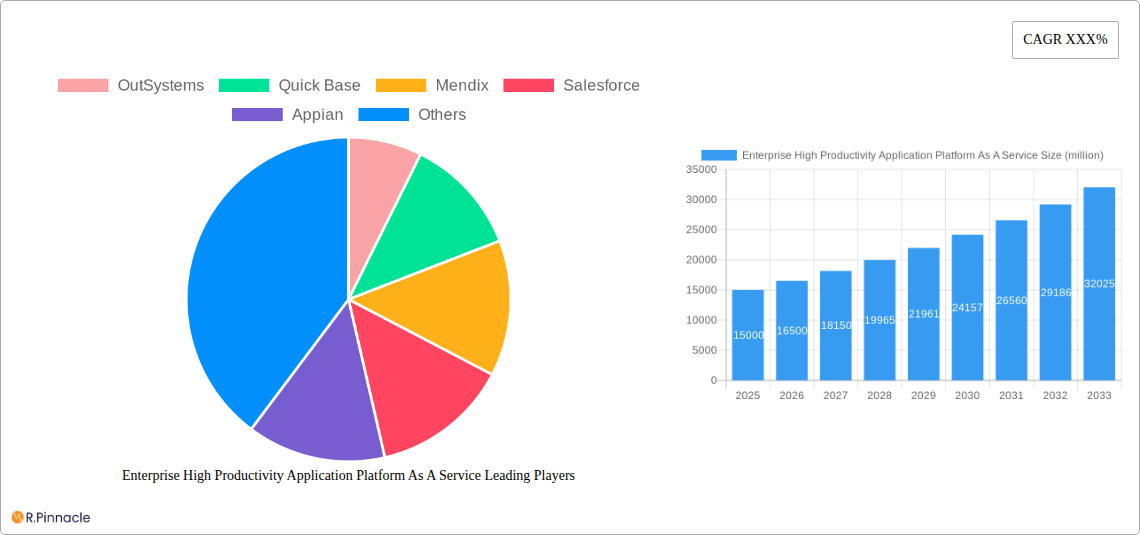
This section analyzes the competitive landscape, highlighting market concentration, innovation drivers, regulatory influences, and key market activities. The report examines the market share held by major players such as OutSystems, Quick Base, Mendix, Salesforce, Appian, Microsoft, ServiceNow, Google, Oracle, Zoho, Workday, Kintone, Betty Blocks, Bubble, WaveMaker, and AgilePoint. We analyze the impact of mergers and acquisitions (M&A), quantifying deal values in millions of dollars where data is available. For example, the report assesses the strategic implications of xx number of M&A deals valued at approximately $xx million in the period 2019-2024, impacting market concentration and shaping future competitive dynamics. The analysis also considers the influence of regulatory frameworks and the presence of substitute products on market growth, alongside an examination of end-user demographics and their evolving needs.
Enterprise High Productivity Application Platform As A Service Market Dynamics & Trends
This section delves into the driving forces shaping the aPaaS market. We analyze market growth drivers (including but not limited to the increasing demand for rapid application development, the rise of cloud computing, and the growing adoption of digital transformation initiatives) leading to a projected Compound Annual Growth Rate (CAGR) of xx% during the forecast period (2025-2033). The report explores technological disruptions, examining the impact of new technologies like AI and machine learning on aPaaS offerings. Consumer preferences are examined, considering the evolving needs and demands of businesses for agile and scalable application solutions. Furthermore, we analyze competitive dynamics, including pricing strategies, product differentiation, and market penetration rates by leading vendors, projecting market penetration to reach xx% by 2033.
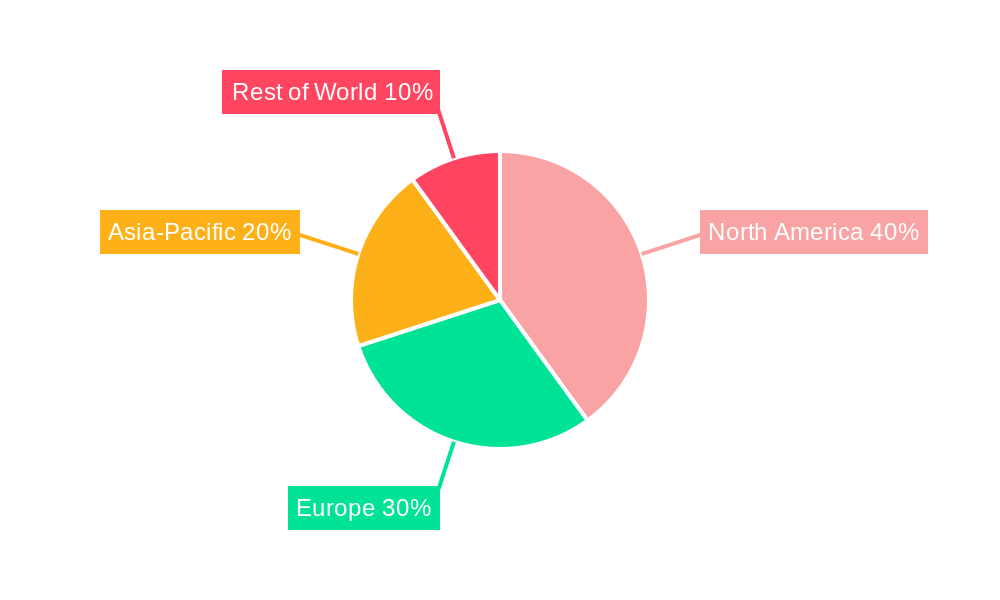
Dominant Regions & Segments in Enterprise High Productivity Application Platform As A Service
This section identifies the leading regions and segments within the aPaaS market. The report offers a detailed analysis of the dominant region(s), focusing on factors driving market growth.
- Key Drivers: The report will pinpoint key drivers for the dominant region(s) and segment(s). This includes but is not limited to:
- Favorable economic policies promoting digital transformation.
- Robust IT infrastructure supporting cloud adoption.
- A high concentration of businesses adopting aPaaS solutions.
- Strong government initiatives supporting digitalization.
The detailed dominance analysis will provide a comprehensive understanding of the market landscape, including the factors that contribute to the leadership positions of specific regions and segments. The report analyzes market size in millions of dollars for each leading segment.
Enterprise High Productivity Application Platform As A Service Product Innovations
This section explores the latest product developments in the aPaaS market. The analysis highlights key technological trends such as low-code/no-code development platforms, AI-powered automation capabilities, and enhanced integration features, showcasing how these innovations contribute to improved market fit and competitive advantage for leading vendors. Specific examples of product innovations and their market impact will be discussed.
Report Scope & Segmentation Analysis
This report segments the aPaaS market based on various factors, including deployment model (cloud, on-premises, hybrid), organization size (small, medium, large enterprises), industry vertical (e.g., BFSI, healthcare, manufacturing), and application type. Each segment's growth projections, market size (in millions of dollars), and competitive dynamics are analyzed in detail. This provides a granular view of the market's composition and growth potential.
Key Drivers of Enterprise High Productivity Application Platform As A Service Growth
The growth of the aPaaS market is driven by a confluence of factors. These include the increasing demand for rapid application development, the growing adoption of cloud-based solutions, the need for greater agility and scalability in business applications, and supportive government initiatives promoting digital transformation. The report will analyze the interplay of these factors, emphasizing their specific contribution to market expansion in millions of dollars.
Challenges in the Enterprise High Productivity Application Platform As A Service Sector
The aPaaS market faces several challenges, including the complexities of integrating legacy systems, the need for robust security measures to protect sensitive data, the potential for vendor lock-in, and the ongoing evolution of technological standards. These challenges are analyzed with their potential quantitative impacts on market growth.
Emerging Opportunities in Enterprise High Productivity Application Platform As A Service
This section highlights several promising avenues for growth. The emergence of new technologies like AI and blockchain, the expansion into untapped markets (such as developing economies), and the increasing demand for specialized aPaaS solutions tailored to specific industry verticals all present significant opportunities. This section explores potential market expansion in millions of dollars associated with these opportunities.
Leading Players in the Enterprise High Productivity Application Platform As A Service Market
- OutSystems
- Quick Base
- Mendix
- Salesforce
- Appian
- Microsoft
- ServiceNow
- Oracle
- Zoho
- Workday
- Kintone
- Betty Blocks
- Bubble
- WaveMaker
- AgilePoint
Key Developments in Enterprise High Productivity Application Platform As A Service Industry
- [Date]: [Specific development, e.g., Launch of a new low-code platform by OutSystems]
- [Date]: [Specific development, e.g., Acquisition of [Company A] by [Company B]]
- [Date]: [Specific development, e.g., Release of a major update to Mendix platform with AI capabilities]
(Further developments to be added, maintaining the date and development format)
Future Outlook for Enterprise High Productivity Application Platform As A Service Market
The aPaaS market is poised for significant growth over the next decade, driven by continuous technological advancements, expanding cloud adoption, and the increasing demand for rapid application development. The integration of AI, machine learning, and other emerging technologies is expected to further enhance the capabilities of aPaaS platforms, driving market expansion and creating new opportunities for innovation and growth. The report concludes with a positive outlook, emphasizing the substantial potential for market expansion in millions of dollars throughout the forecast period.
Enterprise High Productivity Application Platform As A Service Segmentation
-
1. Application
- 1.1. SME (Small and Medium Enterprises)
- 1.2. Large Enterprise
-
2. Type
- 2.1. Monthly Subscription
- 2.2. Annual Subscription
Enterprise High Productivity Application Platform As A Service Segmentation By Geography
-
1. North America
- 1.1. United States
- 1.2. Canada
- 1.3. Mexico
-
2. South America
- 2.1. Brazil
- 2.2. Argentina
- 2.3. Rest of South America
-
3. Europe
- 3.1. United Kingdom
- 3.2. Germany
- 3.3. France
- 3.4. Italy
- 3.5. Spain
- 3.6. Russia
- 3.7. Benelux
- 3.8. Nordics
- 3.9. Rest of Europe
-
4. Middle East & Africa
- 4.1. Turkey
- 4.2. Israel
- 4.3. GCC
- 4.4. North Africa
- 4.5. South Africa
- 4.6. Rest of Middle East & Africa
-
5. Asia Pacific
- 5.1. China
- 5.2. India
- 5.3. Japan
- 5.4. South Korea
- 5.5. ASEAN
- 5.6. Oceania
- 5.7. Rest of Asia Pacific
Enterprise High Productivity Application Platform As A Service REPORT HIGHLIGHTS
| Aspects | Details |
|---|---|
| Study Period | 2019-2033 |
| Base Year | 2024 |
| Estimated Year | 2025 |
| Forecast Period | 2025-2033 |
| Historical Period | 2019-2024 |
| Growth Rate | CAGR of XXX% from 2019-2033 |
| Segmentation |
|
Table of Contents
- 1. Introduction
- 1.1. Research Scope
- 1.2. Market Segmentation
- 1.3. Research Methodology
- 1.4. Definitions and Assumptions
- 2. Executive Summary
- 2.1. Introduction
- 3. Market Dynamics
- 3.1. Introduction
- 3.2. Market Drivers
- 3.3. Market Restrains
- 3.4. Market Trends
- 4. Market Factor Analysis
- 4.1. Porters Five Forces
- 4.2. Supply/Value Chain
- 4.3. PESTEL analysis
- 4.4. Market Entropy
- 4.5. Patent/Trademark Analysis
- 5. Global Enterprise High Productivity Application Platform As A Service Analysis, Insights and Forecast, 2019-2031
- 5.1. Market Analysis, Insights and Forecast - by Application
- 5.1.1. SME (Small and Medium Enterprises)
- 5.1.2. Large Enterprise
- 5.2. Market Analysis, Insights and Forecast - by Type
- 5.2.1. Monthly Subscription
- 5.2.2. Annual Subscription
- 5.3. Market Analysis, Insights and Forecast - by Region
- 5.3.1. North America
- 5.3.2. South America
- 5.3.3. Europe
- 5.3.4. Middle East & Africa
- 5.3.5. Asia Pacific
- 5.1. Market Analysis, Insights and Forecast - by Application
- 6. North America Enterprise High Productivity Application Platform As A Service Analysis, Insights and Forecast, 2019-2031
- 6.1. Market Analysis, Insights and Forecast - by Application
- 6.1.1. SME (Small and Medium Enterprises)
- 6.1.2. Large Enterprise
- 6.2. Market Analysis, Insights and Forecast - by Type
- 6.2.1. Monthly Subscription
- 6.2.2. Annual Subscription
- 6.1. Market Analysis, Insights and Forecast - by Application
- 7. South America Enterprise High Productivity Application Platform As A Service Analysis, Insights and Forecast, 2019-2031
- 7.1. Market Analysis, Insights and Forecast - by Application
- 7.1.1. SME (Small and Medium Enterprises)
- 7.1.2. Large Enterprise
- 7.2. Market Analysis, Insights and Forecast - by Type
- 7.2.1. Monthly Subscription
- 7.2.2. Annual Subscription
- 7.1. Market Analysis, Insights and Forecast - by Application
- 8. Europe Enterprise High Productivity Application Platform As A Service Analysis, Insights and Forecast, 2019-2031
- 8.1. Market Analysis, Insights and Forecast - by Application
- 8.1.1. SME (Small and Medium Enterprises)
- 8.1.2. Large Enterprise
- 8.2. Market Analysis, Insights and Forecast - by Type
- 8.2.1. Monthly Subscription
- 8.2.2. Annual Subscription
- 8.1. Market Analysis, Insights and Forecast - by Application
- 9. Middle East & Africa Enterprise High Productivity Application Platform As A Service Analysis, Insights and Forecast, 2019-2031
- 9.1. Market Analysis, Insights and Forecast - by Application
- 9.1.1. SME (Small and Medium Enterprises)
- 9.1.2. Large Enterprise
- 9.2. Market Analysis, Insights and Forecast - by Type
- 9.2.1. Monthly Subscription
- 9.2.2. Annual Subscription
- 9.1. Market Analysis, Insights and Forecast - by Application
- 10. Asia Pacific Enterprise High Productivity Application Platform As A Service Analysis, Insights and Forecast, 2019-2031
- 10.1. Market Analysis, Insights and Forecast - by Application
- 10.1.1. SME (Small and Medium Enterprises)
- 10.1.2. Large Enterprise
- 10.2. Market Analysis, Insights and Forecast - by Type
- 10.2.1. Monthly Subscription
- 10.2.2. Annual Subscription
- 10.1. Market Analysis, Insights and Forecast - by Application
- 11. Competitive Analysis
- 11.1. Global Market Share Analysis 2024
- 11.2. Company Profiles
- 11.2.1 OutSystems
- 11.2.1.1. Overview
- 11.2.1.2. Products
- 11.2.1.3. SWOT Analysis
- 11.2.1.4. Recent Developments
- 11.2.1.5. Financials (Based on Availability)
- 11.2.2 Quick Base
- 11.2.2.1. Overview
- 11.2.2.2. Products
- 11.2.2.3. SWOT Analysis
- 11.2.2.4. Recent Developments
- 11.2.2.5. Financials (Based on Availability)
- 11.2.3 Mendix
- 11.2.3.1. Overview
- 11.2.3.2. Products
- 11.2.3.3. SWOT Analysis
- 11.2.3.4. Recent Developments
- 11.2.3.5. Financials (Based on Availability)
- 11.2.4 Salesforce
- 11.2.4.1. Overview
- 11.2.4.2. Products
- 11.2.4.3. SWOT Analysis
- 11.2.4.4. Recent Developments
- 11.2.4.5. Financials (Based on Availability)
- 11.2.5 Appian
- 11.2.5.1. Overview
- 11.2.5.2. Products
- 11.2.5.3. SWOT Analysis
- 11.2.5.4. Recent Developments
- 11.2.5.5. Financials (Based on Availability)
- 11.2.6 Microsoft
- 11.2.6.1. Overview
- 11.2.6.2. Products
- 11.2.6.3. SWOT Analysis
- 11.2.6.4. Recent Developments
- 11.2.6.5. Financials (Based on Availability)
- 11.2.7 ServiceNow
- 11.2.7.1. Overview
- 11.2.7.2. Products
- 11.2.7.3. SWOT Analysis
- 11.2.7.4. Recent Developments
- 11.2.7.5. Financials (Based on Availability)
- 11.2.8 Google
- 11.2.8.1. Overview
- 11.2.8.2. Products
- 11.2.8.3. SWOT Analysis
- 11.2.8.4. Recent Developments
- 11.2.8.5. Financials (Based on Availability)
- 11.2.9 Oracle
- 11.2.9.1. Overview
- 11.2.9.2. Products
- 11.2.9.3. SWOT Analysis
- 11.2.9.4. Recent Developments
- 11.2.9.5. Financials (Based on Availability)
- 11.2.10 Zoho
- 11.2.10.1. Overview
- 11.2.10.2. Products
- 11.2.10.3. SWOT Analysis
- 11.2.10.4. Recent Developments
- 11.2.10.5. Financials (Based on Availability)
- 11.2.11 Workday
- 11.2.11.1. Overview
- 11.2.11.2. Products
- 11.2.11.3. SWOT Analysis
- 11.2.11.4. Recent Developments
- 11.2.11.5. Financials (Based on Availability)
- 11.2.12 Kintone
- 11.2.12.1. Overview
- 11.2.12.2. Products
- 11.2.12.3. SWOT Analysis
- 11.2.12.4. Recent Developments
- 11.2.12.5. Financials (Based on Availability)
- 11.2.13 Betty Blocks
- 11.2.13.1. Overview
- 11.2.13.2. Products
- 11.2.13.3. SWOT Analysis
- 11.2.13.4. Recent Developments
- 11.2.13.5. Financials (Based on Availability)
- 11.2.14 Bubble
- 11.2.14.1. Overview
- 11.2.14.2. Products
- 11.2.14.3. SWOT Analysis
- 11.2.14.4. Recent Developments
- 11.2.14.5. Financials (Based on Availability)
- 11.2.15 WaveMaker
- 11.2.15.1. Overview
- 11.2.15.2. Products
- 11.2.15.3. SWOT Analysis
- 11.2.15.4. Recent Developments
- 11.2.15.5. Financials (Based on Availability)
- 11.2.16 AgilePoint
- 11.2.16.1. Overview
- 11.2.16.2. Products
- 11.2.16.3. SWOT Analysis
- 11.2.16.4. Recent Developments
- 11.2.16.5. Financials (Based on Availability)
- 11.2.1 OutSystems
List of Figures
- Figure 1: Global Enterprise High Productivity Application Platform As A Service Revenue Breakdown (million, %) by Region 2024 & 2032
- Figure 2: North America Enterprise High Productivity Application Platform As A Service Revenue (million), by Application 2024 & 2032
- Figure 3: North America Enterprise High Productivity Application Platform As A Service Revenue Share (%), by Application 2024 & 2032
- Figure 4: North America Enterprise High Productivity Application Platform As A Service Revenue (million), by Type 2024 & 2032
- Figure 5: North America Enterprise High Productivity Application Platform As A Service Revenue Share (%), by Type 2024 & 2032
- Figure 6: North America Enterprise High Productivity Application Platform As A Service Revenue (million), by Country 2024 & 2032
- Figure 7: North America Enterprise High Productivity Application Platform As A Service Revenue Share (%), by Country 2024 & 2032
- Figure 8: South America Enterprise High Productivity Application Platform As A Service Revenue (million), by Application 2024 & 2032
- Figure 9: South America Enterprise High Productivity Application Platform As A Service Revenue Share (%), by Application 2024 & 2032
- Figure 10: South America Enterprise High Productivity Application Platform As A Service Revenue (million), by Type 2024 & 2032
- Figure 11: South America Enterprise High Productivity Application Platform As A Service Revenue Share (%), by Type 2024 & 2032
- Figure 12: South America Enterprise High Productivity Application Platform As A Service Revenue (million), by Country 2024 & 2032
- Figure 13: South America Enterprise High Productivity Application Platform As A Service Revenue Share (%), by Country 2024 & 2032
- Figure 14: Europe Enterprise High Productivity Application Platform As A Service Revenue (million), by Application 2024 & 2032
- Figure 15: Europe Enterprise High Productivity Application Platform As A Service Revenue Share (%), by Application 2024 & 2032
- Figure 16: Europe Enterprise High Productivity Application Platform As A Service Revenue (million), by Type 2024 & 2032
- Figure 17: Europe Enterprise High Productivity Application Platform As A Service Revenue Share (%), by Type 2024 & 2032
- Figure 18: Europe Enterprise High Productivity Application Platform As A Service Revenue (million), by Country 2024 & 2032
- Figure 19: Europe Enterprise High Productivity Application Platform As A Service Revenue Share (%), by Country 2024 & 2032
- Figure 20: Middle East & Africa Enterprise High Productivity Application Platform As A Service Revenue (million), by Application 2024 & 2032
- Figure 21: Middle East & Africa Enterprise High Productivity Application Platform As A Service Revenue Share (%), by Application 2024 & 2032
- Figure 22: Middle East & Africa Enterprise High Productivity Application Platform As A Service Revenue (million), by Type 2024 & 2032
- Figure 23: Middle East & Africa Enterprise High Productivity Application Platform As A Service Revenue Share (%), by Type 2024 & 2032
- Figure 24: Middle East & Africa Enterprise High Productivity Application Platform As A Service Revenue (million), by Country 2024 & 2032
- Figure 25: Middle East & Africa Enterprise High Productivity Application Platform As A Service Revenue Share (%), by Country 2024 & 2032
- Figure 26: Asia Pacific Enterprise High Productivity Application Platform As A Service Revenue (million), by Application 2024 & 2032
- Figure 27: Asia Pacific Enterprise High Productivity Application Platform As A Service Revenue Share (%), by Application 2024 & 2032
- Figure 28: Asia Pacific Enterprise High Productivity Application Platform As A Service Revenue (million), by Type 2024 & 2032
- Figure 29: Asia Pacific Enterprise High Productivity Application Platform As A Service Revenue Share (%), by Type 2024 & 2032
- Figure 30: Asia Pacific Enterprise High Productivity Application Platform As A Service Revenue (million), by Country 2024 & 2032
- Figure 31: Asia Pacific Enterprise High Productivity Application Platform As A Service Revenue Share (%), by Country 2024 & 2032
List of Tables
- Table 1: Global Enterprise High Productivity Application Platform As A Service Revenue million Forecast, by Region 2019 & 2032
- Table 2: Global Enterprise High Productivity Application Platform As A Service Revenue million Forecast, by Application 2019 & 2032
- Table 3: Global Enterprise High Productivity Application Platform As A Service Revenue million Forecast, by Type 2019 & 2032
- Table 4: Global Enterprise High Productivity Application Platform As A Service Revenue million Forecast, by Region 2019 & 2032
- Table 5: Global Enterprise High Productivity Application Platform As A Service Revenue million Forecast, by Application 2019 & 2032
- Table 6: Global Enterprise High Productivity Application Platform As A Service Revenue million Forecast, by Type 2019 & 2032
- Table 7: Global Enterprise High Productivity Application Platform As A Service Revenue million Forecast, by Country 2019 & 2032
- Table 8: United States Enterprise High Productivity Application Platform As A Service Revenue (million) Forecast, by Application 2019 & 2032
- Table 9: Canada Enterprise High Productivity Application Platform As A Service Revenue (million) Forecast, by Application 2019 & 2032
- Table 10: Mexico Enterprise High Productivity Application Platform As A Service Revenue (million) Forecast, by Application 2019 & 2032
- Table 11: Global Enterprise High Productivity Application Platform As A Service Revenue million Forecast, by Application 2019 & 2032
- Table 12: Global Enterprise High Productivity Application Platform As A Service Revenue million Forecast, by Type 2019 & 2032
- Table 13: Global Enterprise High Productivity Application Platform As A Service Revenue million Forecast, by Country 2019 & 2032
- Table 14: Brazil Enterprise High Productivity Application Platform As A Service Revenue (million) Forecast, by Application 2019 & 2032
- Table 15: Argentina Enterprise High Productivity Application Platform As A Service Revenue (million) Forecast, by Application 2019 & 2032
- Table 16: Rest of South America Enterprise High Productivity Application Platform As A Service Revenue (million) Forecast, by Application 2019 & 2032
- Table 17: Global Enterprise High Productivity Application Platform As A Service Revenue million Forecast, by Application 2019 & 2032
- Table 18: Global Enterprise High Productivity Application Platform As A Service Revenue million Forecast, by Type 2019 & 2032
- Table 19: Global Enterprise High Productivity Application Platform As A Service Revenue million Forecast, by Country 2019 & 2032
- Table 20: United Kingdom Enterprise High Productivity Application Platform As A Service Revenue (million) Forecast, by Application 2019 & 2032
- Table 21: Germany Enterprise High Productivity Application Platform As A Service Revenue (million) Forecast, by Application 2019 & 2032
- Table 22: France Enterprise High Productivity Application Platform As A Service Revenue (million) Forecast, by Application 2019 & 2032
- Table 23: Italy Enterprise High Productivity Application Platform As A Service Revenue (million) Forecast, by Application 2019 & 2032
- Table 24: Spain Enterprise High Productivity Application Platform As A Service Revenue (million) Forecast, by Application 2019 & 2032
- Table 25: Russia Enterprise High Productivity Application Platform As A Service Revenue (million) Forecast, by Application 2019 & 2032
- Table 26: Benelux Enterprise High Productivity Application Platform As A Service Revenue (million) Forecast, by Application 2019 & 2032
- Table 27: Nordics Enterprise High Productivity Application Platform As A Service Revenue (million) Forecast, by Application 2019 & 2032
- Table 28: Rest of Europe Enterprise High Productivity Application Platform As A Service Revenue (million) Forecast, by Application 2019 & 2032
- Table 29: Global Enterprise High Productivity Application Platform As A Service Revenue million Forecast, by Application 2019 & 2032
- Table 30: Global Enterprise High Productivity Application Platform As A Service Revenue million Forecast, by Type 2019 & 2032
- Table 31: Global Enterprise High Productivity Application Platform As A Service Revenue million Forecast, by Country 2019 & 2032
- Table 32: Turkey Enterprise High Productivity Application Platform As A Service Revenue (million) Forecast, by Application 2019 & 2032
- Table 33: Israel Enterprise High Productivity Application Platform As A Service Revenue (million) Forecast, by Application 2019 & 2032
- Table 34: GCC Enterprise High Productivity Application Platform As A Service Revenue (million) Forecast, by Application 2019 & 2032
- Table 35: North Africa Enterprise High Productivity Application Platform As A Service Revenue (million) Forecast, by Application 2019 & 2032
- Table 36: South Africa Enterprise High Productivity Application Platform As A Service Revenue (million) Forecast, by Application 2019 & 2032
- Table 37: Rest of Middle East & Africa Enterprise High Productivity Application Platform As A Service Revenue (million) Forecast, by Application 2019 & 2032
- Table 38: Global Enterprise High Productivity Application Platform As A Service Revenue million Forecast, by Application 2019 & 2032
- Table 39: Global Enterprise High Productivity Application Platform As A Service Revenue million Forecast, by Type 2019 & 2032
- Table 40: Global Enterprise High Productivity Application Platform As A Service Revenue million Forecast, by Country 2019 & 2032
- Table 41: China Enterprise High Productivity Application Platform As A Service Revenue (million) Forecast, by Application 2019 & 2032
- Table 42: India Enterprise High Productivity Application Platform As A Service Revenue (million) Forecast, by Application 2019 & 2032
- Table 43: Japan Enterprise High Productivity Application Platform As A Service Revenue (million) Forecast, by Application 2019 & 2032
- Table 44: South Korea Enterprise High Productivity Application Platform As A Service Revenue (million) Forecast, by Application 2019 & 2032
- Table 45: ASEAN Enterprise High Productivity Application Platform As A Service Revenue (million) Forecast, by Application 2019 & 2032
- Table 46: Oceania Enterprise High Productivity Application Platform As A Service Revenue (million) Forecast, by Application 2019 & 2032
- Table 47: Rest of Asia Pacific Enterprise High Productivity Application Platform As A Service Revenue (million) Forecast, by Application 2019 & 2032
Frequently Asked Questions
1. What is the projected Compound Annual Growth Rate (CAGR) of the Enterprise High Productivity Application Platform As A Service?
The projected CAGR is approximately XXX%.
2. Which companies are prominent players in the Enterprise High Productivity Application Platform As A Service?
Key companies in the market include OutSystems, Quick Base, Mendix, Salesforce, Appian, Microsoft, ServiceNow, Google, Oracle, Zoho, Workday, Kintone, Betty Blocks, Bubble, WaveMaker, AgilePoint.
3. What are the main segments of the Enterprise High Productivity Application Platform As A Service?
The market segments include Application, Type.
4. Can you provide details about the market size?
The market size is estimated to be USD XXX million as of 2022.
5. What are some drivers contributing to market growth?
N/A
6. What are the notable trends driving market growth?
N/A
7. Are there any restraints impacting market growth?
N/A
8. Can you provide examples of recent developments in the market?
N/A
9. What pricing options are available for accessing the report?
Pricing options include single-user, multi-user, and enterprise licenses priced at USD 4250.00, USD 6375.00, and USD 8500.00 respectively.
10. Is the market size provided in terms of value or volume?
The market size is provided in terms of value, measured in million.
11. Are there any specific market keywords associated with the report?
Yes, the market keyword associated with the report is "Enterprise High Productivity Application Platform As A Service," which aids in identifying and referencing the specific market segment covered.
12. How do I determine which pricing option suits my needs best?
The pricing options vary based on user requirements and access needs. Individual users may opt for single-user licenses, while businesses requiring broader access may choose multi-user or enterprise licenses for cost-effective access to the report.
13. Are there any additional resources or data provided in the Enterprise High Productivity Application Platform As A Service report?
While the report offers comprehensive insights, it's advisable to review the specific contents or supplementary materials provided to ascertain if additional resources or data are available.
14. How can I stay updated on further developments or reports in the Enterprise High Productivity Application Platform As A Service?
To stay informed about further developments, trends, and reports in the Enterprise High Productivity Application Platform As A Service, consider subscribing to industry newsletters, following relevant companies and organizations, or regularly checking reputable industry news sources and publications.
Methodology
Step 1 - Identification of Relevant Samples Size from Population Database


Step 2 - Approaches for Defining Global Market Size (Value, Volume* & Price*)

Note*: In applicable scenarios
Step 3 - Data Sources
Primary Research
- Web Analytics
- Survey Reports
- Research Institute
- Latest Research Reports
- Opinion Leaders
Secondary Research
- Annual Reports
- White Paper
- Latest Press Release
- Industry Association
- Paid Database
- Investor Presentations

Step 4 - Data Triangulation
Involves using different sources of information in order to increase the validity of a study
These sources are likely to be stakeholders in a program - participants, other researchers, program staff, other community members, and so on.
Then we put all data in single framework & apply various statistical tools to find out the dynamic on the market.
During the analysis stage, feedback from the stakeholder groups would be compared to determine areas of agreement as well as areas of divergence


