
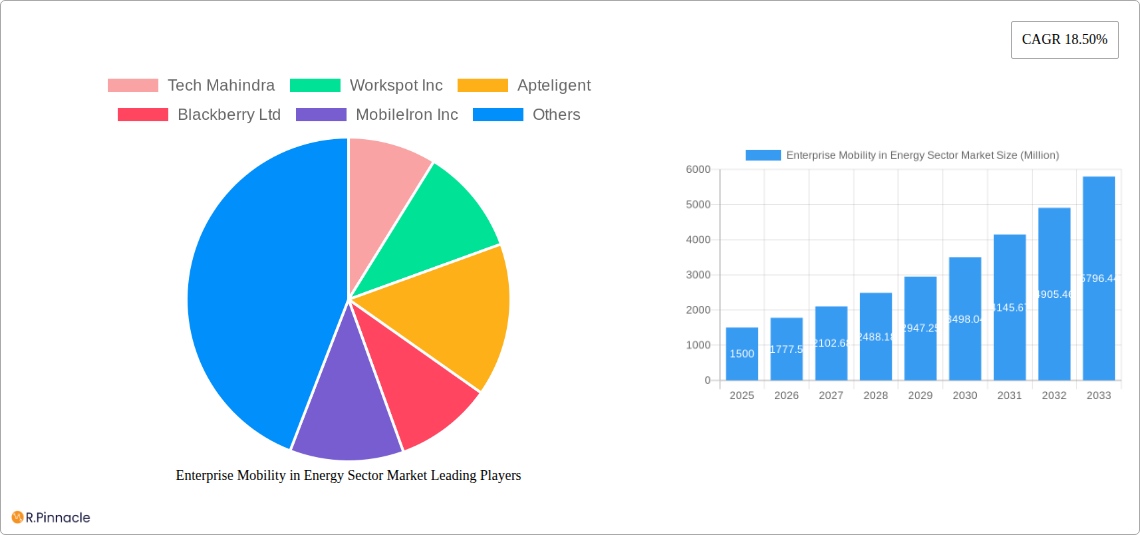
Key Insights
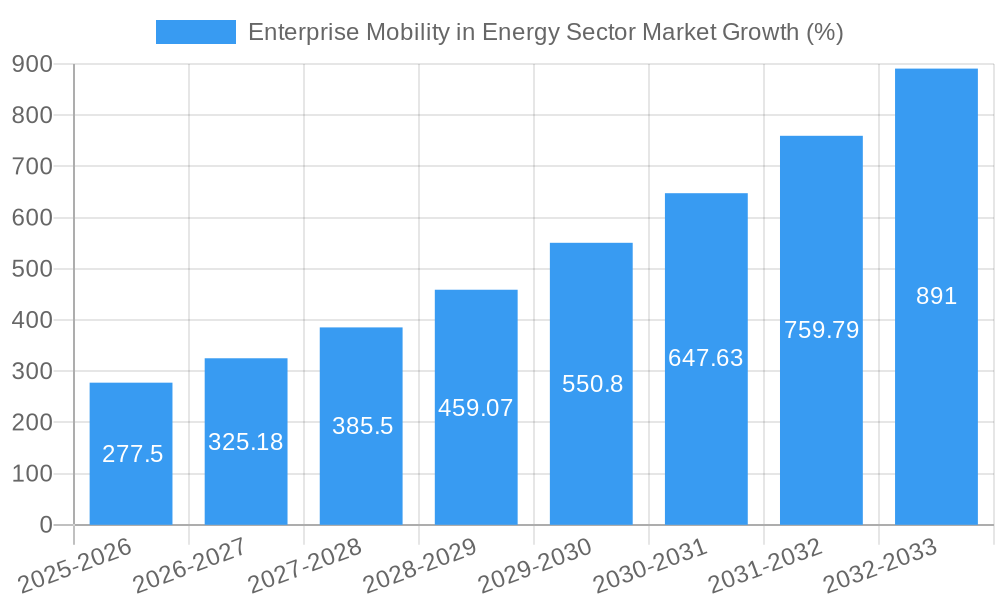
The Enterprise Mobility in the Energy Sector market is experiencing robust growth, projected to reach a significant size by 2033, driven by a Compound Annual Growth Rate (CAGR) of 18.50% from 2025 to 2033. This expansion is fueled by several key factors. Firstly, the increasing adoption of digital transformation initiatives within energy companies is pushing the need for efficient and secure mobile solutions. Remote workforce management, improved field operations, and enhanced real-time data access for oil & gas exploration, renewable energy monitoring, and power grid management are all major drivers. Secondly, the rising demand for enhanced safety and operational efficiency is fostering the adoption of enterprise mobility solutions, allowing for better communication and coordination across geographically dispersed teams. Thirdly, the technological advancements in mobile devices and cloud computing are making enterprise mobility solutions more cost-effective and scalable, further accelerating market growth. The market is segmented by device type (smartphones, laptops, tablets) and deployment mode (on-premise, cloud), with the cloud deployment segment likely exhibiting faster growth due to its flexibility and scalability benefits.
While the market presents substantial opportunities, several challenges exist. High initial investment costs for implementing enterprise mobility solutions can act as a restraint for smaller energy companies. Data security and privacy concerns remain paramount, requiring robust security measures to mitigate risks associated with mobile data access. Integration complexities with existing legacy systems within energy organizations also present a hurdle. Despite these challenges, the long-term market outlook remains positive, with continued technological advancements and increasing regulatory pressures pushing the adoption of enterprise mobility solutions across the energy sector. Geographic expansion, particularly in regions with developing energy infrastructure, is expected to contribute significantly to future growth. Key players like Tech Mahindra, Workspot Inc, and others are strategically positioned to capitalize on these opportunities.
Enterprise Mobility in Energy Sector Market: A Comprehensive Report (2019-2033)
This in-depth report provides a comprehensive analysis of the Enterprise Mobility in Energy Sector Market, offering invaluable insights for industry professionals, investors, and strategic decision-makers. Covering the period 2019-2033, with a focus on 2025, this report meticulously examines market structure, dynamics, key players, and future growth prospects. The estimated market size in 2025 is projected at xx Million, with a robust forecast period extending to 2033.
Enterprise Mobility in Energy Sector Market Structure & Innovation Trends
This section analyzes the competitive landscape, examining market concentration, innovation drivers, and regulatory influences shaping the Enterprise Mobility in Energy Sector Market. The report delves into the role of mergers and acquisitions (M&A) activities, providing insights into deal values and their impact on market share. We assess the influence of product substitutes and evolving end-user demographics, offering a granular understanding of market structure.
- Market Concentration: The market exhibits a [Describe market concentration – e.g., moderately concentrated, highly fragmented] structure, with [Number] key players holding a combined market share of approximately xx%.
- Innovation Drivers: Key drivers include advancements in [Specific technologies e.g., 5G, IoT, AI], increasing demand for enhanced operational efficiency, and the need for robust cybersecurity solutions within the energy sector.
- Regulatory Frameworks: Regulations concerning data privacy and security significantly influence market dynamics, creating both opportunities and challenges for market participants. Compliance with [Specific regulations e.g., GDPR, CCPA] is crucial for market success.
- Product Substitutes: The emergence of [Specific substitutes e.g., alternative communication platforms, cloud-based solutions] presents both competitive threats and opportunities for innovation.
- End-User Demographics: The primary end-users are [Specify end-user types e.g., oil and gas companies, renewable energy firms, utility providers] with varying needs and technological adoption rates.
- M&A Activities: The report analyzes significant M&A activities during the historical period (2019-2024), highlighting deal values exceeding xx Million and their influence on market consolidation and technological integration. Examples include [mention specific M&A activities if available, else state "several key acquisitions that strengthened market positioning"].
Enterprise Mobility in Energy Sector Market Dynamics & Trends
This section explores the key growth drivers, technological disruptions, evolving consumer preferences, and competitive dynamics influencing the Enterprise Mobility in Energy Sector Market. We examine the market's Compound Annual Growth Rate (CAGR) and market penetration, providing a clear picture of market evolution.
[This section requires 600 words of detailed analysis on market growth drivers (e.g., rising adoption of mobile devices, increasing need for remote workforce management), technological disruptions (e.g., advancements in cloud computing, IoT integration), consumer preferences (e.g., demand for enhanced security features, user-friendly interfaces), and competitive dynamics (e.g., strategic partnerships, product differentiation). Include specific metrics such as CAGR and market penetration rates. This section needs to be filled with the relevant information.]
Dominant Regions & Segments in Enterprise Mobility in Energy Sector Market
This section identifies the leading regions and segments within the Enterprise Mobility in Energy Sector Market. We analyze the dominance of specific regions and segments (By Device: Smartphones, Laptops, Tablets; By Deployment: On-Premise, Cloud), highlighting key growth drivers and providing a detailed analysis of market leadership.
By Device:
- Smartphones: Smartphones represent the dominant device type, driven by their portability, cost-effectiveness, and widespread adoption across the energy sector. [Explain further in detail]
- Laptops: Laptops maintain a significant market presence, particularly for tasks requiring larger screens and enhanced computing power. [Explain further in detail]
- Tablets: Tablets are experiencing [growth/decline] due to [reason]. [Explain further in detail]
By Deployment:
- Cloud: Cloud deployment is experiencing significant growth due to its scalability, cost-effectiveness, and enhanced accessibility. [Explain further in detail]
- On-Premise: On-Premise solutions maintain a presence, particularly in sectors prioritizing data security and control. [Explain further in detail]
[This section requires a detailed analysis of the leading regions and countries, supported by relevant economic policies, infrastructure developments, and specific examples. The analysis should justify the dominance of these regions/segments.]
Enterprise Mobility in Energy Sector Market Product Innovations
This section summarizes recent product developments, applications, and competitive advantages in the Enterprise Mobility in Energy Sector Market. We focus on key technological trends and their market fit.
[This section needs 100-150 words summarizing product innovations, highlighting technological trends (e.g., AI-powered solutions, enhanced security features) and their impact on market competitiveness. Provide specific examples of innovative products if available.]
Report Scope & Segmentation Analysis
This report provides a detailed segmentation analysis of the Enterprise Mobility in Energy Sector Market, categorized by device type (Smartphones, Laptops, Tablets) and deployment model (On-Premise, Cloud).
By Device: The report provides growth projections, market sizes, and competitive dynamics for each device category.
By Deployment: The report offers a similar analysis for on-premise and cloud deployments, highlighting their respective market shares, growth rates, and competitive landscapes.
[This section requires 100-150 words describing the market segmentation analysis. Include growth projections and market size estimates for each segment.]
Key Drivers of Enterprise Mobility in Energy Sector Market Growth
Several factors drive the growth of the Enterprise Mobility in Energy Sector Market. These include technological advancements such as the Internet of Things (IoT) and 5G connectivity, enabling real-time data monitoring and improved operational efficiency. Economic factors, such as the increasing demand for remote workforce capabilities, also contribute to market growth. Finally, regulatory pressures encouraging digital transformation and enhanced data security play a significant role.
[This section should provide a concise overview of the key growth drivers, providing specific examples and quantifiable data where possible.]
Challenges in the Enterprise Mobility in Energy Sector Market Sector
The Enterprise Mobility in Energy Sector Market faces challenges, including regulatory hurdles related to data privacy and cybersecurity. Supply chain disruptions can impact the availability of necessary hardware and software components. Furthermore, intense competition from established technology providers necessitates continuous innovation and adaptability.
[This section requires a brief discussion (100-150 words) of the challenges in the market, focusing on regulatory hurdles, supply chain issues, and competitive pressures. Quantifiable impacts should be included where possible.]
Emerging Opportunities in Enterprise Mobility in Energy Sector Market
Emerging opportunities exist in new markets and technologies. The expansion of 5G networks presents significant potential for enhancing mobile connectivity and data transfer speeds, driving the adoption of advanced mobility solutions. The integration of Artificial Intelligence (AI) and Machine Learning (ML) capabilities into mobile applications can further improve operational efficiency and decision-making processes.
[This section should highlight emerging opportunities in the market (100-150 words), focusing on new markets, technologies, or consumer preferences. Examples should be provided.]
Leading Players in the Enterprise Mobility in Energy Sector Market Market
- Tech Mahindra
- Workspot Inc
- Apteligent
- Blackberry Ltd
- MobileIron Inc
- TCS Private Limited
- McAfee Inc
- Cisco Systems Inc
- Microsoft Corporation
- Tylr Mobile Inc
- Oracle Corporation
- VMware Inc
- Broadcom Inc (Symantec Corporation)
- Citrix Systems Inc
- SAP SE
Key Developments in Enterprise Mobility in Energy Sector Industry
- [List key developments with year/month, emphasizing their impact on market dynamics. E.g., "October 2023: Company X launched a new mobile application for remote asset management."]
Future Outlook for Enterprise Mobility in Energy Sector Market Market
The future outlook for the Enterprise Mobility in Energy Sector Market is positive, driven by ongoing technological advancements and the increasing adoption of digital transformation strategies within the energy sector. Continued growth is anticipated, with significant opportunities for companies that can adapt to the changing market dynamics and provide innovative solutions that address the evolving needs of energy companies.
[This section should provide a concise summary (100-150 words) of the future market potential and strategic opportunities. Focus on growth accelerators and future trends.]
Enterprise Mobility in Energy Sector Market Segmentation
-
1. Device
- 1.1. Smartphones
- 1.2. Laptops
- 1.3. Tablets
-
2. Deployment
- 2.1. On-Premise
- 2.2. Cloud
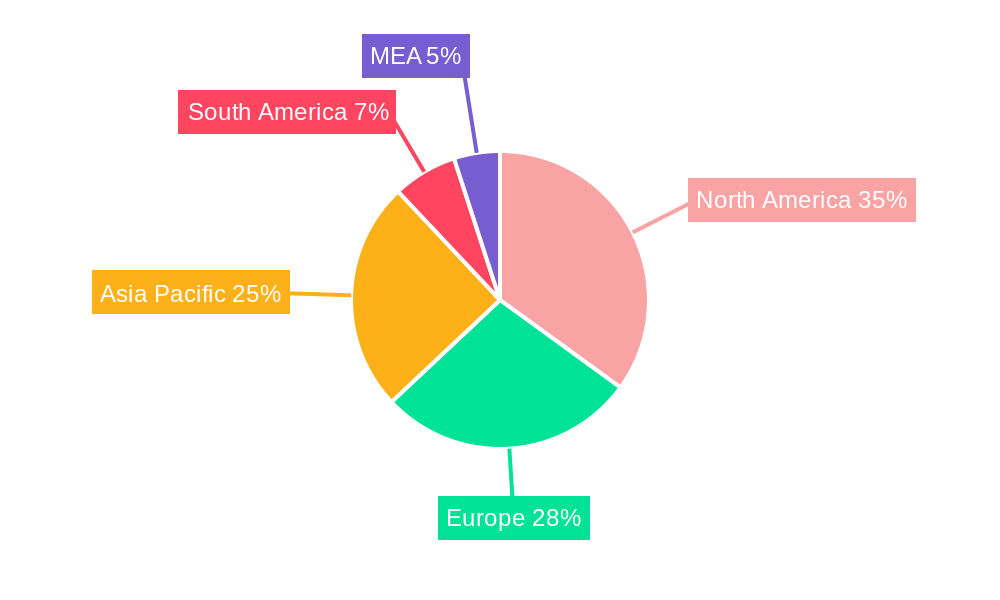
Enterprise Mobility in Energy Sector Market Segmentation By Geography
- 1. North America
- 2. Europe
- 3. Asia Pacific
- 4. Latin America
- 5. Middle East
Enterprise Mobility in Energy Sector Market REPORT HIGHLIGHTS
| Aspects | Details |
|---|---|
| Study Period | 2019-2033 |
| Base Year | 2024 |
| Estimated Year | 2025 |
| Forecast Period | 2025-2033 |
| Historical Period | 2019-2024 |
| Growth Rate | CAGR of 18.50% from 2019-2033 |
| Segmentation |
|
Table of Contents
- 1. Introduction
- 1.1. Research Scope
- 1.2. Market Segmentation
- 1.3. Research Methodology
- 1.4. Definitions and Assumptions
- 2. Executive Summary
- 2.1. Introduction
- 3. Market Dynamics
- 3.1. Introduction
- 3.2. Market Drivers
- 3.2.1. ; Advancements in Energy Revolution is the Major Driving Factor
- 3.3. Market Restrains
- 3.3.1. ; Security Vulnerability is the Major Discouraging Factor
- 3.4. Market Trends
- 3.4.1. Smartphones to Dominate the Market
- 4. Market Factor Analysis
- 4.1. Porters Five Forces
- 4.2. Supply/Value Chain
- 4.3. PESTEL analysis
- 4.4. Market Entropy
- 4.5. Patent/Trademark Analysis
- 5. Global Enterprise Mobility in Energy Sector Market Analysis, Insights and Forecast, 2019-2031
- 5.1. Market Analysis, Insights and Forecast - by Device
- 5.1.1. Smartphones
- 5.1.2. Laptops
- 5.1.3. Tablets
- 5.2. Market Analysis, Insights and Forecast - by Deployment
- 5.2.1. On-Premise
- 5.2.2. Cloud
- 5.3. Market Analysis, Insights and Forecast - by Region
- 5.3.1. North America
- 5.3.2. Europe
- 5.3.3. Asia Pacific
- 5.3.4. Latin America
- 5.3.5. Middle East
- 5.1. Market Analysis, Insights and Forecast - by Device
- 6. North America Enterprise Mobility in Energy Sector Market Analysis, Insights and Forecast, 2019-2031
- 6.1. Market Analysis, Insights and Forecast - by Device
- 6.1.1. Smartphones
- 6.1.2. Laptops
- 6.1.3. Tablets
- 6.2. Market Analysis, Insights and Forecast - by Deployment
- 6.2.1. On-Premise
- 6.2.2. Cloud
- 6.1. Market Analysis, Insights and Forecast - by Device
- 7. Europe Enterprise Mobility in Energy Sector Market Analysis, Insights and Forecast, 2019-2031
- 7.1. Market Analysis, Insights and Forecast - by Device
- 7.1.1. Smartphones
- 7.1.2. Laptops
- 7.1.3. Tablets
- 7.2. Market Analysis, Insights and Forecast - by Deployment
- 7.2.1. On-Premise
- 7.2.2. Cloud
- 7.1. Market Analysis, Insights and Forecast - by Device
- 8. Asia Pacific Enterprise Mobility in Energy Sector Market Analysis, Insights and Forecast, 2019-2031
- 8.1. Market Analysis, Insights and Forecast - by Device
- 8.1.1. Smartphones
- 8.1.2. Laptops
- 8.1.3. Tablets
- 8.2. Market Analysis, Insights and Forecast - by Deployment
- 8.2.1. On-Premise
- 8.2.2. Cloud
- 8.1. Market Analysis, Insights and Forecast - by Device
- 9. Latin America Enterprise Mobility in Energy Sector Market Analysis, Insights and Forecast, 2019-2031
- 9.1. Market Analysis, Insights and Forecast - by Device
- 9.1.1. Smartphones
- 9.1.2. Laptops
- 9.1.3. Tablets
- 9.2. Market Analysis, Insights and Forecast - by Deployment
- 9.2.1. On-Premise
- 9.2.2. Cloud
- 9.1. Market Analysis, Insights and Forecast - by Device
- 10. Middle East Enterprise Mobility in Energy Sector Market Analysis, Insights and Forecast, 2019-2031
- 10.1. Market Analysis, Insights and Forecast - by Device
- 10.1.1. Smartphones
- 10.1.2. Laptops
- 10.1.3. Tablets
- 10.2. Market Analysis, Insights and Forecast - by Deployment
- 10.2.1. On-Premise
- 10.2.2. Cloud
- 10.1. Market Analysis, Insights and Forecast - by Device
- 11. North America Enterprise Mobility in Energy Sector Market Analysis, Insights and Forecast, 2019-2031
- 11.1. Market Analysis, Insights and Forecast - By Country/Sub-region
- 11.1.1 United States
- 11.1.2 Canada
- 11.1.3 Mexico
- 12. Europe Enterprise Mobility in Energy Sector Market Analysis, Insights and Forecast, 2019-2031
- 12.1. Market Analysis, Insights and Forecast - By Country/Sub-region
- 12.1.1 Germany
- 12.1.2 United Kingdom
- 12.1.3 France
- 12.1.4 Spain
- 12.1.5 Italy
- 12.1.6 Spain
- 12.1.7 Belgium
- 12.1.8 Netherland
- 12.1.9 Nordics
- 12.1.10 Rest of Europe
- 13. Asia Pacific Enterprise Mobility in Energy Sector Market Analysis, Insights and Forecast, 2019-2031
- 13.1. Market Analysis, Insights and Forecast - By Country/Sub-region
- 13.1.1 China
- 13.1.2 Japan
- 13.1.3 India
- 13.1.4 South Korea
- 13.1.5 Southeast Asia
- 13.1.6 Australia
- 13.1.7 Indonesia
- 13.1.8 Phillipes
- 13.1.9 Singapore
- 13.1.10 Thailandc
- 13.1.11 Rest of Asia Pacific
- 14. South America Enterprise Mobility in Energy Sector Market Analysis, Insights and Forecast, 2019-2031
- 14.1. Market Analysis, Insights and Forecast - By Country/Sub-region
- 14.1.1 Brazil
- 14.1.2 Argentina
- 14.1.3 Peru
- 14.1.4 Chile
- 14.1.5 Colombia
- 14.1.6 Ecuador
- 14.1.7 Venezuela
- 14.1.8 Rest of South America
- 15. North America Enterprise Mobility in Energy Sector Market Analysis, Insights and Forecast, 2019-2031
- 15.1. Market Analysis, Insights and Forecast - By Country/Sub-region
- 15.1.1 United States
- 15.1.2 Canada
- 15.1.3 Mexico
- 16. MEA Enterprise Mobility in Energy Sector Market Analysis, Insights and Forecast, 2019-2031
- 16.1. Market Analysis, Insights and Forecast - By Country/Sub-region
- 16.1.1 United Arab Emirates
- 16.1.2 Saudi Arabia
- 16.1.3 South Africa
- 16.1.4 Rest of Middle East and Africa
- 17. Competitive Analysis
- 17.1. Global Market Share Analysis 2024
- 17.2. Company Profiles
- 17.2.1 Tech Mahindra
- 17.2.1.1. Overview
- 17.2.1.2. Products
- 17.2.1.3. SWOT Analysis
- 17.2.1.4. Recent Developments
- 17.2.1.5. Financials (Based on Availability)
- 17.2.2 Workspot Inc
- 17.2.2.1. Overview
- 17.2.2.2. Products
- 17.2.2.3. SWOT Analysis
- 17.2.2.4. Recent Developments
- 17.2.2.5. Financials (Based on Availability)
- 17.2.3 Apteligent
- 17.2.3.1. Overview
- 17.2.3.2. Products
- 17.2.3.3. SWOT Analysis
- 17.2.3.4. Recent Developments
- 17.2.3.5. Financials (Based on Availability)
- 17.2.4 Blackberry Ltd
- 17.2.4.1. Overview
- 17.2.4.2. Products
- 17.2.4.3. SWOT Analysis
- 17.2.4.4. Recent Developments
- 17.2.4.5. Financials (Based on Availability)
- 17.2.5 MobileIron Inc
- 17.2.5.1. Overview
- 17.2.5.2. Products
- 17.2.5.3. SWOT Analysis
- 17.2.5.4. Recent Developments
- 17.2.5.5. Financials (Based on Availability)
- 17.2.6 TCS Private Limited
- 17.2.6.1. Overview
- 17.2.6.2. Products
- 17.2.6.3. SWOT Analysis
- 17.2.6.4. Recent Developments
- 17.2.6.5. Financials (Based on Availability)
- 17.2.7 McAfee Inc
- 17.2.7.1. Overview
- 17.2.7.2. Products
- 17.2.7.3. SWOT Analysis
- 17.2.7.4. Recent Developments
- 17.2.7.5. Financials (Based on Availability)
- 17.2.8 Cisco Systems Inc
- 17.2.8.1. Overview
- 17.2.8.2. Products
- 17.2.8.3. SWOT Analysis
- 17.2.8.4. Recent Developments
- 17.2.8.5. Financials (Based on Availability)
- 17.2.9 Microsoft Corporation
- 17.2.9.1. Overview
- 17.2.9.2. Products
- 17.2.9.3. SWOT Analysis
- 17.2.9.4. Recent Developments
- 17.2.9.5. Financials (Based on Availability)
- 17.2.10 Tylr Mobile Inc
- 17.2.10.1. Overview
- 17.2.10.2. Products
- 17.2.10.3. SWOT Analysis
- 17.2.10.4. Recent Developments
- 17.2.10.5. Financials (Based on Availability)
- 17.2.11 Oracle Corporation
- 17.2.11.1. Overview
- 17.2.11.2. Products
- 17.2.11.3. SWOT Analysis
- 17.2.11.4. Recent Developments
- 17.2.11.5. Financials (Based on Availability)
- 17.2.12 VMware Inc
- 17.2.12.1. Overview
- 17.2.12.2. Products
- 17.2.12.3. SWOT Analysis
- 17.2.12.4. Recent Developments
- 17.2.12.5. Financials (Based on Availability)
- 17.2.13 Broadcom Inc (Symantec Corporation)
- 17.2.13.1. Overview
- 17.2.13.2. Products
- 17.2.13.3. SWOT Analysis
- 17.2.13.4. Recent Developments
- 17.2.13.5. Financials (Based on Availability)
- 17.2.14 Citrix Systems Inc
- 17.2.14.1. Overview
- 17.2.14.2. Products
- 17.2.14.3. SWOT Analysis
- 17.2.14.4. Recent Developments
- 17.2.14.5. Financials (Based on Availability)
- 17.2.15 SAP SE
- 17.2.15.1. Overview
- 17.2.15.2. Products
- 17.2.15.3. SWOT Analysis
- 17.2.15.4. Recent Developments
- 17.2.15.5. Financials (Based on Availability)
- 17.2.1 Tech Mahindra
List of Figures
- Figure 1: Global Enterprise Mobility in Energy Sector Market Revenue Breakdown (Million, %) by Region 2024 & 2032
- Figure 2: North America Enterprise Mobility in Energy Sector Market Revenue (Million), by Country 2024 & 2032
- Figure 3: North America Enterprise Mobility in Energy Sector Market Revenue Share (%), by Country 2024 & 2032
- Figure 4: Europe Enterprise Mobility in Energy Sector Market Revenue (Million), by Country 2024 & 2032
- Figure 5: Europe Enterprise Mobility in Energy Sector Market Revenue Share (%), by Country 2024 & 2032
- Figure 6: Asia Pacific Enterprise Mobility in Energy Sector Market Revenue (Million), by Country 2024 & 2032
- Figure 7: Asia Pacific Enterprise Mobility in Energy Sector Market Revenue Share (%), by Country 2024 & 2032
- Figure 8: South America Enterprise Mobility in Energy Sector Market Revenue (Million), by Country 2024 & 2032
- Figure 9: South America Enterprise Mobility in Energy Sector Market Revenue Share (%), by Country 2024 & 2032
- Figure 10: North America Enterprise Mobility in Energy Sector Market Revenue (Million), by Country 2024 & 2032
- Figure 11: North America Enterprise Mobility in Energy Sector Market Revenue Share (%), by Country 2024 & 2032
- Figure 12: MEA Enterprise Mobility in Energy Sector Market Revenue (Million), by Country 2024 & 2032
- Figure 13: MEA Enterprise Mobility in Energy Sector Market Revenue Share (%), by Country 2024 & 2032
- Figure 14: North America Enterprise Mobility in Energy Sector Market Revenue (Million), by Device 2024 & 2032
- Figure 15: North America Enterprise Mobility in Energy Sector Market Revenue Share (%), by Device 2024 & 2032
- Figure 16: North America Enterprise Mobility in Energy Sector Market Revenue (Million), by Deployment 2024 & 2032
- Figure 17: North America Enterprise Mobility in Energy Sector Market Revenue Share (%), by Deployment 2024 & 2032
- Figure 18: North America Enterprise Mobility in Energy Sector Market Revenue (Million), by Country 2024 & 2032
- Figure 19: North America Enterprise Mobility in Energy Sector Market Revenue Share (%), by Country 2024 & 2032
- Figure 20: Europe Enterprise Mobility in Energy Sector Market Revenue (Million), by Device 2024 & 2032
- Figure 21: Europe Enterprise Mobility in Energy Sector Market Revenue Share (%), by Device 2024 & 2032
- Figure 22: Europe Enterprise Mobility in Energy Sector Market Revenue (Million), by Deployment 2024 & 2032
- Figure 23: Europe Enterprise Mobility in Energy Sector Market Revenue Share (%), by Deployment 2024 & 2032
- Figure 24: Europe Enterprise Mobility in Energy Sector Market Revenue (Million), by Country 2024 & 2032
- Figure 25: Europe Enterprise Mobility in Energy Sector Market Revenue Share (%), by Country 2024 & 2032
- Figure 26: Asia Pacific Enterprise Mobility in Energy Sector Market Revenue (Million), by Device 2024 & 2032
- Figure 27: Asia Pacific Enterprise Mobility in Energy Sector Market Revenue Share (%), by Device 2024 & 2032
- Figure 28: Asia Pacific Enterprise Mobility in Energy Sector Market Revenue (Million), by Deployment 2024 & 2032
- Figure 29: Asia Pacific Enterprise Mobility in Energy Sector Market Revenue Share (%), by Deployment 2024 & 2032
- Figure 30: Asia Pacific Enterprise Mobility in Energy Sector Market Revenue (Million), by Country 2024 & 2032
- Figure 31: Asia Pacific Enterprise Mobility in Energy Sector Market Revenue Share (%), by Country 2024 & 2032
- Figure 32: Latin America Enterprise Mobility in Energy Sector Market Revenue (Million), by Device 2024 & 2032
- Figure 33: Latin America Enterprise Mobility in Energy Sector Market Revenue Share (%), by Device 2024 & 2032
- Figure 34: Latin America Enterprise Mobility in Energy Sector Market Revenue (Million), by Deployment 2024 & 2032
- Figure 35: Latin America Enterprise Mobility in Energy Sector Market Revenue Share (%), by Deployment 2024 & 2032
- Figure 36: Latin America Enterprise Mobility in Energy Sector Market Revenue (Million), by Country 2024 & 2032
- Figure 37: Latin America Enterprise Mobility in Energy Sector Market Revenue Share (%), by Country 2024 & 2032
- Figure 38: Middle East Enterprise Mobility in Energy Sector Market Revenue (Million), by Device 2024 & 2032
- Figure 39: Middle East Enterprise Mobility in Energy Sector Market Revenue Share (%), by Device 2024 & 2032
- Figure 40: Middle East Enterprise Mobility in Energy Sector Market Revenue (Million), by Deployment 2024 & 2032
- Figure 41: Middle East Enterprise Mobility in Energy Sector Market Revenue Share (%), by Deployment 2024 & 2032
- Figure 42: Middle East Enterprise Mobility in Energy Sector Market Revenue (Million), by Country 2024 & 2032
- Figure 43: Middle East Enterprise Mobility in Energy Sector Market Revenue Share (%), by Country 2024 & 2032
List of Tables
- Table 1: Global Enterprise Mobility in Energy Sector Market Revenue Million Forecast, by Region 2019 & 2032
- Table 2: Global Enterprise Mobility in Energy Sector Market Revenue Million Forecast, by Device 2019 & 2032
- Table 3: Global Enterprise Mobility in Energy Sector Market Revenue Million Forecast, by Deployment 2019 & 2032
- Table 4: Global Enterprise Mobility in Energy Sector Market Revenue Million Forecast, by Region 2019 & 2032
- Table 5: Global Enterprise Mobility in Energy Sector Market Revenue Million Forecast, by Country 2019 & 2032
- Table 6: United States Enterprise Mobility in Energy Sector Market Revenue (Million) Forecast, by Application 2019 & 2032
- Table 7: Canada Enterprise Mobility in Energy Sector Market Revenue (Million) Forecast, by Application 2019 & 2032
- Table 8: Mexico Enterprise Mobility in Energy Sector Market Revenue (Million) Forecast, by Application 2019 & 2032
- Table 9: Global Enterprise Mobility in Energy Sector Market Revenue Million Forecast, by Country 2019 & 2032
- Table 10: Germany Enterprise Mobility in Energy Sector Market Revenue (Million) Forecast, by Application 2019 & 2032
- Table 11: United Kingdom Enterprise Mobility in Energy Sector Market Revenue (Million) Forecast, by Application 2019 & 2032
- Table 12: France Enterprise Mobility in Energy Sector Market Revenue (Million) Forecast, by Application 2019 & 2032
- Table 13: Spain Enterprise Mobility in Energy Sector Market Revenue (Million) Forecast, by Application 2019 & 2032
- Table 14: Italy Enterprise Mobility in Energy Sector Market Revenue (Million) Forecast, by Application 2019 & 2032
- Table 15: Spain Enterprise Mobility in Energy Sector Market Revenue (Million) Forecast, by Application 2019 & 2032
- Table 16: Belgium Enterprise Mobility in Energy Sector Market Revenue (Million) Forecast, by Application 2019 & 2032
- Table 17: Netherland Enterprise Mobility in Energy Sector Market Revenue (Million) Forecast, by Application 2019 & 2032
- Table 18: Nordics Enterprise Mobility in Energy Sector Market Revenue (Million) Forecast, by Application 2019 & 2032
- Table 19: Rest of Europe Enterprise Mobility in Energy Sector Market Revenue (Million) Forecast, by Application 2019 & 2032
- Table 20: Global Enterprise Mobility in Energy Sector Market Revenue Million Forecast, by Country 2019 & 2032
- Table 21: China Enterprise Mobility in Energy Sector Market Revenue (Million) Forecast, by Application 2019 & 2032
- Table 22: Japan Enterprise Mobility in Energy Sector Market Revenue (Million) Forecast, by Application 2019 & 2032
- Table 23: India Enterprise Mobility in Energy Sector Market Revenue (Million) Forecast, by Application 2019 & 2032
- Table 24: South Korea Enterprise Mobility in Energy Sector Market Revenue (Million) Forecast, by Application 2019 & 2032
- Table 25: Southeast Asia Enterprise Mobility in Energy Sector Market Revenue (Million) Forecast, by Application 2019 & 2032
- Table 26: Australia Enterprise Mobility in Energy Sector Market Revenue (Million) Forecast, by Application 2019 & 2032
- Table 27: Indonesia Enterprise Mobility in Energy Sector Market Revenue (Million) Forecast, by Application 2019 & 2032
- Table 28: Phillipes Enterprise Mobility in Energy Sector Market Revenue (Million) Forecast, by Application 2019 & 2032
- Table 29: Singapore Enterprise Mobility in Energy Sector Market Revenue (Million) Forecast, by Application 2019 & 2032
- Table 30: Thailandc Enterprise Mobility in Energy Sector Market Revenue (Million) Forecast, by Application 2019 & 2032
- Table 31: Rest of Asia Pacific Enterprise Mobility in Energy Sector Market Revenue (Million) Forecast, by Application 2019 & 2032
- Table 32: Global Enterprise Mobility in Energy Sector Market Revenue Million Forecast, by Country 2019 & 2032
- Table 33: Brazil Enterprise Mobility in Energy Sector Market Revenue (Million) Forecast, by Application 2019 & 2032
- Table 34: Argentina Enterprise Mobility in Energy Sector Market Revenue (Million) Forecast, by Application 2019 & 2032
- Table 35: Peru Enterprise Mobility in Energy Sector Market Revenue (Million) Forecast, by Application 2019 & 2032
- Table 36: Chile Enterprise Mobility in Energy Sector Market Revenue (Million) Forecast, by Application 2019 & 2032
- Table 37: Colombia Enterprise Mobility in Energy Sector Market Revenue (Million) Forecast, by Application 2019 & 2032
- Table 38: Ecuador Enterprise Mobility in Energy Sector Market Revenue (Million) Forecast, by Application 2019 & 2032
- Table 39: Venezuela Enterprise Mobility in Energy Sector Market Revenue (Million) Forecast, by Application 2019 & 2032
- Table 40: Rest of South America Enterprise Mobility in Energy Sector Market Revenue (Million) Forecast, by Application 2019 & 2032
- Table 41: Global Enterprise Mobility in Energy Sector Market Revenue Million Forecast, by Country 2019 & 2032
- Table 42: United States Enterprise Mobility in Energy Sector Market Revenue (Million) Forecast, by Application 2019 & 2032
- Table 43: Canada Enterprise Mobility in Energy Sector Market Revenue (Million) Forecast, by Application 2019 & 2032
- Table 44: Mexico Enterprise Mobility in Energy Sector Market Revenue (Million) Forecast, by Application 2019 & 2032
- Table 45: Global Enterprise Mobility in Energy Sector Market Revenue Million Forecast, by Country 2019 & 2032
- Table 46: United Arab Emirates Enterprise Mobility in Energy Sector Market Revenue (Million) Forecast, by Application 2019 & 2032
- Table 47: Saudi Arabia Enterprise Mobility in Energy Sector Market Revenue (Million) Forecast, by Application 2019 & 2032
- Table 48: South Africa Enterprise Mobility in Energy Sector Market Revenue (Million) Forecast, by Application 2019 & 2032
- Table 49: Rest of Middle East and Africa Enterprise Mobility in Energy Sector Market Revenue (Million) Forecast, by Application 2019 & 2032
- Table 50: Global Enterprise Mobility in Energy Sector Market Revenue Million Forecast, by Device 2019 & 2032
- Table 51: Global Enterprise Mobility in Energy Sector Market Revenue Million Forecast, by Deployment 2019 & 2032
- Table 52: Global Enterprise Mobility in Energy Sector Market Revenue Million Forecast, by Country 2019 & 2032
- Table 53: Global Enterprise Mobility in Energy Sector Market Revenue Million Forecast, by Device 2019 & 2032
- Table 54: Global Enterprise Mobility in Energy Sector Market Revenue Million Forecast, by Deployment 2019 & 2032
- Table 55: Global Enterprise Mobility in Energy Sector Market Revenue Million Forecast, by Country 2019 & 2032
- Table 56: Global Enterprise Mobility in Energy Sector Market Revenue Million Forecast, by Device 2019 & 2032
- Table 57: Global Enterprise Mobility in Energy Sector Market Revenue Million Forecast, by Deployment 2019 & 2032
- Table 58: Global Enterprise Mobility in Energy Sector Market Revenue Million Forecast, by Country 2019 & 2032
- Table 59: Global Enterprise Mobility in Energy Sector Market Revenue Million Forecast, by Device 2019 & 2032
- Table 60: Global Enterprise Mobility in Energy Sector Market Revenue Million Forecast, by Deployment 2019 & 2032
- Table 61: Global Enterprise Mobility in Energy Sector Market Revenue Million Forecast, by Country 2019 & 2032
- Table 62: Global Enterprise Mobility in Energy Sector Market Revenue Million Forecast, by Device 2019 & 2032
- Table 63: Global Enterprise Mobility in Energy Sector Market Revenue Million Forecast, by Deployment 2019 & 2032
- Table 64: Global Enterprise Mobility in Energy Sector Market Revenue Million Forecast, by Country 2019 & 2032
Frequently Asked Questions
1. What is the projected Compound Annual Growth Rate (CAGR) of the Enterprise Mobility in Energy Sector Market?
The projected CAGR is approximately 18.50%.
2. Which companies are prominent players in the Enterprise Mobility in Energy Sector Market?
Key companies in the market include Tech Mahindra, Workspot Inc, Apteligent, Blackberry Ltd, MobileIron Inc, TCS Private Limited, McAfee Inc, Cisco Systems Inc, Microsoft Corporation, Tylr Mobile Inc, Oracle Corporation, VMware Inc, Broadcom Inc (Symantec Corporation), Citrix Systems Inc, SAP SE.
3. What are the main segments of the Enterprise Mobility in Energy Sector Market?
The market segments include Device, Deployment.
4. Can you provide details about the market size?
The market size is estimated to be USD XX Million as of 2022.
5. What are some drivers contributing to market growth?
; Advancements in Energy Revolution is the Major Driving Factor.
6. What are the notable trends driving market growth?
Smartphones to Dominate the Market.
7. Are there any restraints impacting market growth?
; Security Vulnerability is the Major Discouraging Factor.
8. Can you provide examples of recent developments in the market?
N/A
9. What pricing options are available for accessing the report?
Pricing options include single-user, multi-user, and enterprise licenses priced at USD 4750, USD 5250, and USD 8750 respectively.
10. Is the market size provided in terms of value or volume?
The market size is provided in terms of value, measured in Million.
11. Are there any specific market keywords associated with the report?
Yes, the market keyword associated with the report is "Enterprise Mobility in Energy Sector Market," which aids in identifying and referencing the specific market segment covered.
12. How do I determine which pricing option suits my needs best?
The pricing options vary based on user requirements and access needs. Individual users may opt for single-user licenses, while businesses requiring broader access may choose multi-user or enterprise licenses for cost-effective access to the report.
13. Are there any additional resources or data provided in the Enterprise Mobility in Energy Sector Market report?
While the report offers comprehensive insights, it's advisable to review the specific contents or supplementary materials provided to ascertain if additional resources or data are available.
14. How can I stay updated on further developments or reports in the Enterprise Mobility in Energy Sector Market?
To stay informed about further developments, trends, and reports in the Enterprise Mobility in Energy Sector Market, consider subscribing to industry newsletters, following relevant companies and organizations, or regularly checking reputable industry news sources and publications.
Methodology
Step 1 - Identification of Relevant Samples Size from Population Database


Step 2 - Approaches for Defining Global Market Size (Value, Volume* & Price*)

Note*: In applicable scenarios
Step 3 - Data Sources
Primary Research
- Web Analytics
- Survey Reports
- Research Institute
- Latest Research Reports
- Opinion Leaders
Secondary Research
- Annual Reports
- White Paper
- Latest Press Release
- Industry Association
- Paid Database
- Investor Presentations

Step 4 - Data Triangulation
Involves using different sources of information in order to increase the validity of a study
These sources are likely to be stakeholders in a program - participants, other researchers, program staff, other community members, and so on.
Then we put all data in single framework & apply various statistical tools to find out the dynamic on the market.
During the analysis stage, feedback from the stakeholder groups would be compared to determine areas of agreement as well as areas of divergence


