
Key Insights
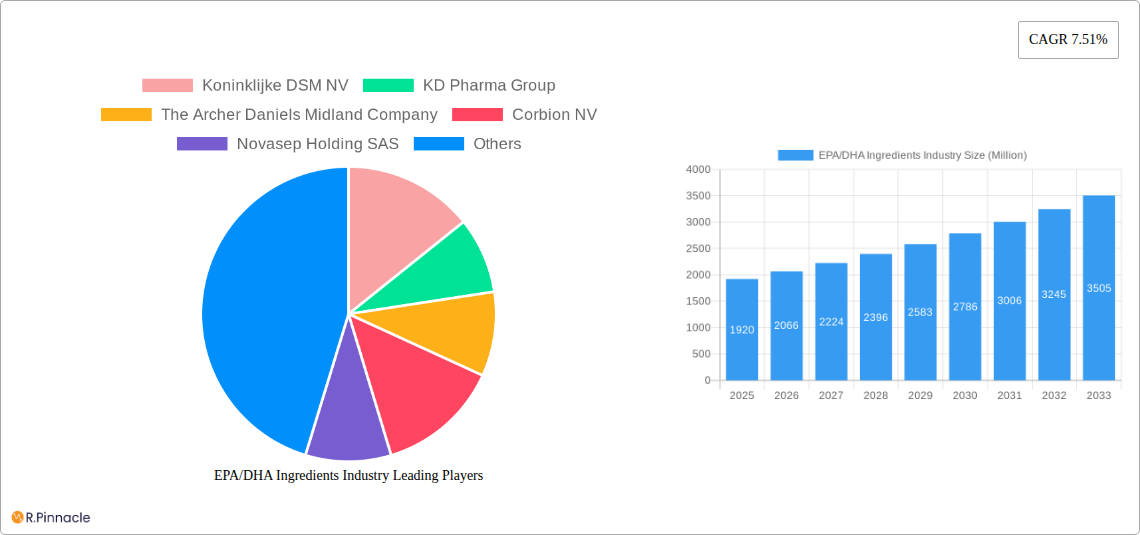
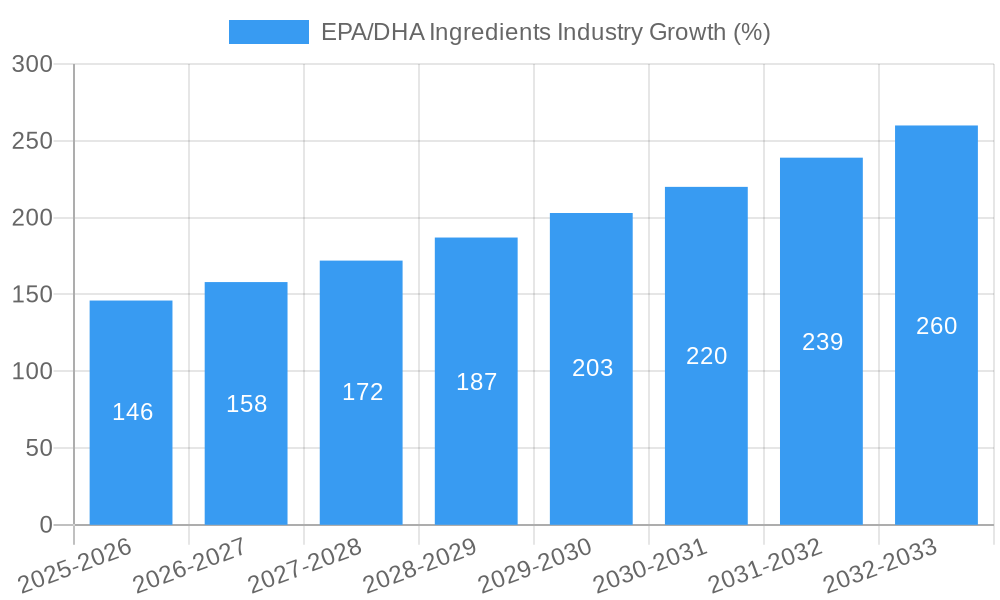
The EPA/DHA ingredients market, valued at $1.92 billion in 2025, is projected to experience robust growth, driven by increasing consumer awareness of the health benefits associated with omega-3 fatty acids. The rising prevalence of cardiovascular diseases, cognitive decline, and inflammatory conditions fuels demand for EPA and DHA supplements, significantly impacting market expansion. The functional food and beverage industry's incorporation of EPA/DHA further contributes to market growth, as consumers seek convenient ways to incorporate these essential fatty acids into their diets. Key market drivers include the growing demand for fortified foods and beverages, the increasing adoption of preventative healthcare measures, and the expanding research highlighting the efficacy of EPA/DHA in various health conditions. The market is segmented by source (fish oil, algae oil, krill oil), application (dietary supplements, functional foods, pharmaceuticals), and geography, with variations in growth rates across regions influenced by factors like dietary habits, health consciousness, and regulatory frameworks. While potential supply chain challenges and price fluctuations in raw materials pose certain restraints, the long-term outlook for the EPA/DHA ingredients market remains positive, anticipating a sustained CAGR of 7.51% from 2025 to 2033. Technological advancements in extraction and purification methods are expected to enhance product quality and efficiency, further boosting market expansion.
This market growth is fueled by several factors, including the rising adoption of personalized nutrition strategies, a growing emphasis on preventive healthcare, and the increasing availability of high-quality, sustainable EPA/DHA sources. Major players in the market are constantly innovating to improve product efficacy, address sustainability concerns, and meet the growing demand for customized solutions. Strategic partnerships, acquisitions, and investments in research and development are further shaping the competitive landscape. The market is witnessing a trend toward more transparent and traceable supply chains, alongside the development of novel delivery systems and formulations to enhance bioavailability and consumer acceptance. This ongoing development ensures the long-term sustainability and growth potential of the EPA/DHA ingredients market.
EPA/DHA Ingredients Industry Report: 2019-2033 Forecast
This comprehensive report provides an in-depth analysis of the EPA/DHA Ingredients market, offering invaluable insights for industry professionals, investors, and stakeholders. Covering the period 2019-2033, with a focus on 2025, this report details market dynamics, competitive landscapes, and future growth projections. The global market size is projected to reach xx Million by 2033.
Study Period: 2019-2033 | Base Year: 2025 | Estimated Year: 2025 | Forecast Period: 2025-2033 | Historical Period: 2019-2024
EPA/DHA Ingredients Industry Market Structure & Innovation Trends
This section analyzes the market structure, highlighting key players, their market share, and the prevalent innovation drivers shaping the industry. The report examines the competitive landscape, including mergers and acquisitions (M&A) activities, and assesses the impact of regulatory frameworks on market growth. Product substitutes and end-user demographics are also comprehensively analyzed.
- Market Concentration: The EPA/DHA ingredients market exhibits a moderately concentrated structure, with several major players holding significant market share. Koninklijke DSM NV, KD Pharma Group, and The Archer Daniels Midland Company are among the leading players. Precise market share data is available within the full report.
- Innovation Drivers: Increasing consumer demand for health and wellness products, coupled with scientific advancements in extraction and purification technologies, are driving significant innovation within the industry.
- Regulatory Frameworks: Stringent regulatory requirements regarding product purity and safety influence manufacturing practices and market access.
- M&A Activities: The report details recent M&A activity, including deal values, and analyzes their impact on market consolidation and competition. For example, several deals totaling xx Million were recorded during the historical period.
- Product Substitutes: The emergence of alternative sources of omega-3 fatty acids, such as plant-based alternatives, presents a competitive challenge. However, the report analyzes the market viability of such substitutes compared to traditional EPA/DHA sources.
EPA/DHA Ingredients Industry Market Dynamics & Trends
This section delves into market dynamics, exploring growth drivers, technological advancements, consumer preferences, and competitive forces. The report quantifies market growth with a CAGR (Compound Annual Growth Rate) and analyzes market penetration across key segments.
The market is driven by growing health consciousness among consumers, an increase in the prevalence of chronic diseases, and the rising adoption of dietary supplements. Technological advancements in extraction and purification are enhancing product quality and efficiency, leading to increased market penetration. Changing consumer preferences towards functional foods and fortified products further contribute to growth. Competitive dynamics are shaped by product innovation, pricing strategies, and distribution channels. The report projects a CAGR of xx% during the forecast period.
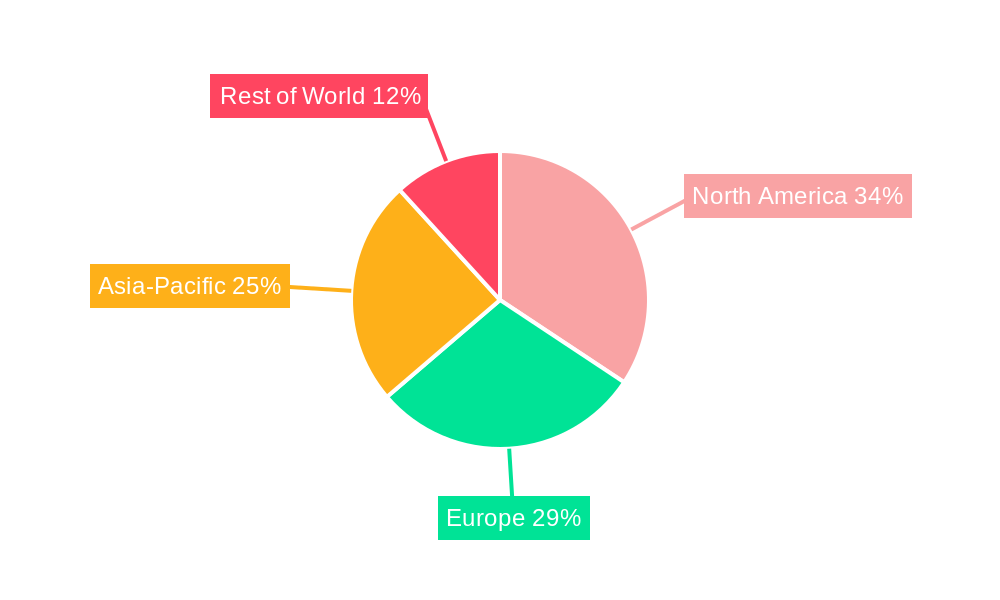
Dominant Regions & Segments in EPA/DHA Ingredients Industry
This section identifies leading regions and segments within the EPA/DHA ingredients market. Key drivers contributing to regional dominance are analyzed, encompassing economic policies, infrastructure, and consumer behavior.
- Leading Region: [Insert Leading Region, e.g., North America] - detailed analysis within the full report.
- Key Drivers for Leading Region:
- Strong consumer demand for health and wellness products.
- Well-established distribution networks for dietary supplements.
- Favorable regulatory environment.
- High per capita disposable income.
[Detailed analysis of leading region and other regions would follow, using paragraphs to elaborate on dominance factors.]
EPA/DHA Ingredients Industry Product Innovations
The EPA/DHA ingredients industry is witnessing continuous innovation, with new products entering the market regularly. Recent trends include the development of more stable and bioavailable forms of EPA and DHA, and the incorporation of these ingredients into various food and beverage products, driving the expanding application beyond dietary supplements. Companies are focusing on improving the bioavailability and taste profiles of EPA/DHA products to enhance consumer acceptability.
Report Scope & Segmentation Analysis
This report segments the market based on [insert segmentation criteria, e.g., product type, application, and region]. Each segment's growth projections, market size, and competitive dynamics are analyzed individually. For example, the dietary supplements segment is anticipated to exhibit strong growth due to rising health awareness and increased demand for functional foods and beverages.
Key Drivers of EPA/DHA Ingredients Industry Growth
Several factors contribute to the growth of the EPA/DHA ingredients market. Technological advancements in extraction methods and purification techniques are improving product quality and reducing production costs. The increasing prevalence of chronic diseases is driving demand for omega-3 supplements, while favorable government regulations and supportive health campaigns are further stimulating market expansion.
Challenges in the EPA/DHA Ingredients Industry Sector
The EPA/DHA ingredients industry faces challenges such as fluctuating raw material prices, stringent regulatory compliance requirements, and intense competition. Supply chain disruptions can also impact production and availability. These challenges are thoroughly analyzed within the report, with quantifiable impacts on market growth assessed.
Emerging Opportunities in EPA/DHA Ingredients Industry
Several emerging opportunities are transforming the EPA/DHA ingredients market. Growing demand for sustainable and ethically sourced ingredients presents opportunities for companies focusing on responsible sourcing practices. The expansion into new markets, particularly in developing economies with rising disposable incomes, offers significant growth potential. Innovations in product formats and delivery systems are also creating exciting opportunities.
Leading Players in the EPA/DHA Ingredients Industry Market
- Koninklijke DSM NV
- KD Pharma Group
- The Archer Daniels Midland Company
- Corbion NV
- Novasep Holding SAS
- Neptune Wellness Solutions
- BASF SE
- Omega Protein Corporation
- Croda International PLC
- Novotech Nutraceuticals
- List Not Exhaustive
Key Developments in EPA/DHA Ingredients Industry
- March 2024: DSM-Firmenich partnered with SCN BestCo to launch omega-3 gummies with EPA and DHA ingredients, expanding product offerings in the growing functional food sector.
- March 2024: Epax invested USD 40 Million in a state-of-the-art distillation facility, significantly boosting its capacity for ultra-concentrated omega-3 production and reinforcing its position as a leading supplier.
- February 2024: Epax launched EPAX Omega 3-9-11, a full-spectrum oil with potential applications in skin health supplements, diversifying product portfolios and tapping into new market segments.
Future Outlook for EPA/DHA Ingredients Industry Market
The EPA/DHA ingredients market is poised for continued growth, driven by the increasing prevalence of chronic diseases, rising health awareness, and the growing popularity of functional foods and dietary supplements. Strategic investments in research and development, coupled with innovative product launches and expansion into new markets, will further enhance market growth in the coming years. Opportunities lie in sustainable sourcing, technological advancements, and expanding applications in various health and wellness products.
EPA/DHA Ingredients Industry Segmentation
-
1. Type
- 1.1. Eicosapentaenoic Acid (EPA)
- 1.2. Docosahexaenoic Acid (DHA)
-
2. Source
- 2.1. Fish Oil
- 2.2. Algae Oil
- 2.3. Krill Oil
- 2.4. Other Sources
-
3. Application
- 3.1. Infant Formulae
- 3.2. Dietary Supplements
- 3.3. Fortified Food and Beverages
- 3.4. Pharmaceuticals
- 3.5. Other Applications
EPA/DHA Ingredients Industry Segmentation By Geography
-
1. North America
- 1.1. United States
- 1.2. Mexico
- 1.3. Canada
- 1.4. Rest of North America
-
2. Europe
- 2.1. Spain
- 2.2. United Kingdom
- 2.3. Germany
- 2.4. France
- 2.5. Russia
- 2.6. Italy
- 2.7. Rest of Europe
-
3. Asia Pacific
- 3.1. China
- 3.2. Japan
- 3.3. India
- 3.4. Australia
- 3.5. Rest of Asia Pacific
-
4. South America
- 4.1. Brazil
- 4.2. Argentina
- 4.3. Rest of South America
-
5. Middle East and Africa
- 5.1. United Arab Emirates
- 5.2. South Africa
- 5.3. Rest of Middle East and Africa
EPA/DHA Ingredients Industry REPORT HIGHLIGHTS
| Aspects | Details |
|---|---|
| Study Period | 2019-2033 |
| Base Year | 2024 |
| Estimated Year | 2025 |
| Forecast Period | 2025-2033 |
| Historical Period | 2019-2024 |
| Growth Rate | CAGR of 7.51% from 2019-2033 |
| Segmentation |
|
Table of Contents
- 1. Introduction
- 1.1. Research Scope
- 1.2. Market Segmentation
- 1.3. Research Methodology
- 1.4. Definitions and Assumptions
- 2. Executive Summary
- 2.1. Introduction
- 3. Market Dynamics
- 3.1. Introduction
- 3.2. Market Drivers
- 3.2.1. Increasing Awareness Of Health Benefits Associated With EPA And DHA; Demand for Concentrated Forms of Omega 3
- 3.3. Market Restrains
- 3.3.1. Increasing Awareness Of Health Benefits Associated With EPA And DHA; Demand for Concentrated Forms of Omega 3
- 3.4. Market Trends
- 3.4.1. Increasing Awareness Of Health Benefits Associated With EPA And DHA
- 4. Market Factor Analysis
- 4.1. Porters Five Forces
- 4.2. Supply/Value Chain
- 4.3. PESTEL analysis
- 4.4. Market Entropy
- 4.5. Patent/Trademark Analysis
- 5. Global EPA/DHA Ingredients Industry Analysis, Insights and Forecast, 2019-2031
- 5.1. Market Analysis, Insights and Forecast - by Type
- 5.1.1. Eicosapentaenoic Acid (EPA)
- 5.1.2. Docosahexaenoic Acid (DHA)
- 5.2. Market Analysis, Insights and Forecast - by Source
- 5.2.1. Fish Oil
- 5.2.2. Algae Oil
- 5.2.3. Krill Oil
- 5.2.4. Other Sources
- 5.3. Market Analysis, Insights and Forecast - by Application
- 5.3.1. Infant Formulae
- 5.3.2. Dietary Supplements
- 5.3.3. Fortified Food and Beverages
- 5.3.4. Pharmaceuticals
- 5.3.5. Other Applications
- 5.4. Market Analysis, Insights and Forecast - by Region
- 5.4.1. North America
- 5.4.2. Europe
- 5.4.3. Asia Pacific
- 5.4.4. South America
- 5.4.5. Middle East and Africa
- 5.1. Market Analysis, Insights and Forecast - by Type
- 6. North America EPA/DHA Ingredients Industry Analysis, Insights and Forecast, 2019-2031
- 6.1. Market Analysis, Insights and Forecast - by Type
- 6.1.1. Eicosapentaenoic Acid (EPA)
- 6.1.2. Docosahexaenoic Acid (DHA)
- 6.2. Market Analysis, Insights and Forecast - by Source
- 6.2.1. Fish Oil
- 6.2.2. Algae Oil
- 6.2.3. Krill Oil
- 6.2.4. Other Sources
- 6.3. Market Analysis, Insights and Forecast - by Application
- 6.3.1. Infant Formulae
- 6.3.2. Dietary Supplements
- 6.3.3. Fortified Food and Beverages
- 6.3.4. Pharmaceuticals
- 6.3.5. Other Applications
- 6.1. Market Analysis, Insights and Forecast - by Type
- 7. Europe EPA/DHA Ingredients Industry Analysis, Insights and Forecast, 2019-2031
- 7.1. Market Analysis, Insights and Forecast - by Type
- 7.1.1. Eicosapentaenoic Acid (EPA)
- 7.1.2. Docosahexaenoic Acid (DHA)
- 7.2. Market Analysis, Insights and Forecast - by Source
- 7.2.1. Fish Oil
- 7.2.2. Algae Oil
- 7.2.3. Krill Oil
- 7.2.4. Other Sources
- 7.3. Market Analysis, Insights and Forecast - by Application
- 7.3.1. Infant Formulae
- 7.3.2. Dietary Supplements
- 7.3.3. Fortified Food and Beverages
- 7.3.4. Pharmaceuticals
- 7.3.5. Other Applications
- 7.1. Market Analysis, Insights and Forecast - by Type
- 8. Asia Pacific EPA/DHA Ingredients Industry Analysis, Insights and Forecast, 2019-2031
- 8.1. Market Analysis, Insights and Forecast - by Type
- 8.1.1. Eicosapentaenoic Acid (EPA)
- 8.1.2. Docosahexaenoic Acid (DHA)
- 8.2. Market Analysis, Insights and Forecast - by Source
- 8.2.1. Fish Oil
- 8.2.2. Algae Oil
- 8.2.3. Krill Oil
- 8.2.4. Other Sources
- 8.3. Market Analysis, Insights and Forecast - by Application
- 8.3.1. Infant Formulae
- 8.3.2. Dietary Supplements
- 8.3.3. Fortified Food and Beverages
- 8.3.4. Pharmaceuticals
- 8.3.5. Other Applications
- 8.1. Market Analysis, Insights and Forecast - by Type
- 9. South America EPA/DHA Ingredients Industry Analysis, Insights and Forecast, 2019-2031
- 9.1. Market Analysis, Insights and Forecast - by Type
- 9.1.1. Eicosapentaenoic Acid (EPA)
- 9.1.2. Docosahexaenoic Acid (DHA)
- 9.2. Market Analysis, Insights and Forecast - by Source
- 9.2.1. Fish Oil
- 9.2.2. Algae Oil
- 9.2.3. Krill Oil
- 9.2.4. Other Sources
- 9.3. Market Analysis, Insights and Forecast - by Application
- 9.3.1. Infant Formulae
- 9.3.2. Dietary Supplements
- 9.3.3. Fortified Food and Beverages
- 9.3.4. Pharmaceuticals
- 9.3.5. Other Applications
- 9.1. Market Analysis, Insights and Forecast - by Type
- 10. Middle East and Africa EPA/DHA Ingredients Industry Analysis, Insights and Forecast, 2019-2031
- 10.1. Market Analysis, Insights and Forecast - by Type
- 10.1.1. Eicosapentaenoic Acid (EPA)
- 10.1.2. Docosahexaenoic Acid (DHA)
- 10.2. Market Analysis, Insights and Forecast - by Source
- 10.2.1. Fish Oil
- 10.2.2. Algae Oil
- 10.2.3. Krill Oil
- 10.2.4. Other Sources
- 10.3. Market Analysis, Insights and Forecast - by Application
- 10.3.1. Infant Formulae
- 10.3.2. Dietary Supplements
- 10.3.3. Fortified Food and Beverages
- 10.3.4. Pharmaceuticals
- 10.3.5. Other Applications
- 10.1. Market Analysis, Insights and Forecast - by Type
- 11. Competitive Analysis
- 11.1. Global Market Share Analysis 2024
- 11.2. Company Profiles
- 11.2.1 Koninklijke DSM NV
- 11.2.1.1. Overview
- 11.2.1.2. Products
- 11.2.1.3. SWOT Analysis
- 11.2.1.4. Recent Developments
- 11.2.1.5. Financials (Based on Availability)
- 11.2.2 KD Pharma Group
- 11.2.2.1. Overview
- 11.2.2.2. Products
- 11.2.2.3. SWOT Analysis
- 11.2.2.4. Recent Developments
- 11.2.2.5. Financials (Based on Availability)
- 11.2.3 The Archer Daniels Midland Company
- 11.2.3.1. Overview
- 11.2.3.2. Products
- 11.2.3.3. SWOT Analysis
- 11.2.3.4. Recent Developments
- 11.2.3.5. Financials (Based on Availability)
- 11.2.4 Corbion NV
- 11.2.4.1. Overview
- 11.2.4.2. Products
- 11.2.4.3. SWOT Analysis
- 11.2.4.4. Recent Developments
- 11.2.4.5. Financials (Based on Availability)
- 11.2.5 Novasep Holding SAS
- 11.2.5.1. Overview
- 11.2.5.2. Products
- 11.2.5.3. SWOT Analysis
- 11.2.5.4. Recent Developments
- 11.2.5.5. Financials (Based on Availability)
- 11.2.6 Neptune Wellness Solutions
- 11.2.6.1. Overview
- 11.2.6.2. Products
- 11.2.6.3. SWOT Analysis
- 11.2.6.4. Recent Developments
- 11.2.6.5. Financials (Based on Availability)
- 11.2.7 BASF SE
- 11.2.7.1. Overview
- 11.2.7.2. Products
- 11.2.7.3. SWOT Analysis
- 11.2.7.4. Recent Developments
- 11.2.7.5. Financials (Based on Availability)
- 11.2.8 Omega Protein Corporation
- 11.2.8.1. Overview
- 11.2.8.2. Products
- 11.2.8.3. SWOT Analysis
- 11.2.8.4. Recent Developments
- 11.2.8.5. Financials (Based on Availability)
- 11.2.9 Croda International PLC
- 11.2.9.1. Overview
- 11.2.9.2. Products
- 11.2.9.3. SWOT Analysis
- 11.2.9.4. Recent Developments
- 11.2.9.5. Financials (Based on Availability)
- 11.2.10 Novotech Nutraceuticals*List Not Exhaustive
- 11.2.10.1. Overview
- 11.2.10.2. Products
- 11.2.10.3. SWOT Analysis
- 11.2.10.4. Recent Developments
- 11.2.10.5. Financials (Based on Availability)
- 11.2.1 Koninklijke DSM NV
List of Figures
- Figure 1: Global EPA/DHA Ingredients Industry Revenue Breakdown (Million, %) by Region 2024 & 2032
- Figure 2: Global EPA/DHA Ingredients Industry Volume Breakdown (Billion, %) by Region 2024 & 2032
- Figure 3: North America EPA/DHA Ingredients Industry Revenue (Million), by Type 2024 & 2032
- Figure 4: North America EPA/DHA Ingredients Industry Volume (Billion), by Type 2024 & 2032
- Figure 5: North America EPA/DHA Ingredients Industry Revenue Share (%), by Type 2024 & 2032
- Figure 6: North America EPA/DHA Ingredients Industry Volume Share (%), by Type 2024 & 2032
- Figure 7: North America EPA/DHA Ingredients Industry Revenue (Million), by Source 2024 & 2032
- Figure 8: North America EPA/DHA Ingredients Industry Volume (Billion), by Source 2024 & 2032
- Figure 9: North America EPA/DHA Ingredients Industry Revenue Share (%), by Source 2024 & 2032
- Figure 10: North America EPA/DHA Ingredients Industry Volume Share (%), by Source 2024 & 2032
- Figure 11: North America EPA/DHA Ingredients Industry Revenue (Million), by Application 2024 & 2032
- Figure 12: North America EPA/DHA Ingredients Industry Volume (Billion), by Application 2024 & 2032
- Figure 13: North America EPA/DHA Ingredients Industry Revenue Share (%), by Application 2024 & 2032
- Figure 14: North America EPA/DHA Ingredients Industry Volume Share (%), by Application 2024 & 2032
- Figure 15: North America EPA/DHA Ingredients Industry Revenue (Million), by Country 2024 & 2032
- Figure 16: North America EPA/DHA Ingredients Industry Volume (Billion), by Country 2024 & 2032
- Figure 17: North America EPA/DHA Ingredients Industry Revenue Share (%), by Country 2024 & 2032
- Figure 18: North America EPA/DHA Ingredients Industry Volume Share (%), by Country 2024 & 2032
- Figure 19: Europe EPA/DHA Ingredients Industry Revenue (Million), by Type 2024 & 2032
- Figure 20: Europe EPA/DHA Ingredients Industry Volume (Billion), by Type 2024 & 2032
- Figure 21: Europe EPA/DHA Ingredients Industry Revenue Share (%), by Type 2024 & 2032
- Figure 22: Europe EPA/DHA Ingredients Industry Volume Share (%), by Type 2024 & 2032
- Figure 23: Europe EPA/DHA Ingredients Industry Revenue (Million), by Source 2024 & 2032
- Figure 24: Europe EPA/DHA Ingredients Industry Volume (Billion), by Source 2024 & 2032
- Figure 25: Europe EPA/DHA Ingredients Industry Revenue Share (%), by Source 2024 & 2032
- Figure 26: Europe EPA/DHA Ingredients Industry Volume Share (%), by Source 2024 & 2032
- Figure 27: Europe EPA/DHA Ingredients Industry Revenue (Million), by Application 2024 & 2032
- Figure 28: Europe EPA/DHA Ingredients Industry Volume (Billion), by Application 2024 & 2032
- Figure 29: Europe EPA/DHA Ingredients Industry Revenue Share (%), by Application 2024 & 2032
- Figure 30: Europe EPA/DHA Ingredients Industry Volume Share (%), by Application 2024 & 2032
- Figure 31: Europe EPA/DHA Ingredients Industry Revenue (Million), by Country 2024 & 2032
- Figure 32: Europe EPA/DHA Ingredients Industry Volume (Billion), by Country 2024 & 2032
- Figure 33: Europe EPA/DHA Ingredients Industry Revenue Share (%), by Country 2024 & 2032
- Figure 34: Europe EPA/DHA Ingredients Industry Volume Share (%), by Country 2024 & 2032
- Figure 35: Asia Pacific EPA/DHA Ingredients Industry Revenue (Million), by Type 2024 & 2032
- Figure 36: Asia Pacific EPA/DHA Ingredients Industry Volume (Billion), by Type 2024 & 2032
- Figure 37: Asia Pacific EPA/DHA Ingredients Industry Revenue Share (%), by Type 2024 & 2032
- Figure 38: Asia Pacific EPA/DHA Ingredients Industry Volume Share (%), by Type 2024 & 2032
- Figure 39: Asia Pacific EPA/DHA Ingredients Industry Revenue (Million), by Source 2024 & 2032
- Figure 40: Asia Pacific EPA/DHA Ingredients Industry Volume (Billion), by Source 2024 & 2032
- Figure 41: Asia Pacific EPA/DHA Ingredients Industry Revenue Share (%), by Source 2024 & 2032
- Figure 42: Asia Pacific EPA/DHA Ingredients Industry Volume Share (%), by Source 2024 & 2032
- Figure 43: Asia Pacific EPA/DHA Ingredients Industry Revenue (Million), by Application 2024 & 2032
- Figure 44: Asia Pacific EPA/DHA Ingredients Industry Volume (Billion), by Application 2024 & 2032
- Figure 45: Asia Pacific EPA/DHA Ingredients Industry Revenue Share (%), by Application 2024 & 2032
- Figure 46: Asia Pacific EPA/DHA Ingredients Industry Volume Share (%), by Application 2024 & 2032
- Figure 47: Asia Pacific EPA/DHA Ingredients Industry Revenue (Million), by Country 2024 & 2032
- Figure 48: Asia Pacific EPA/DHA Ingredients Industry Volume (Billion), by Country 2024 & 2032
- Figure 49: Asia Pacific EPA/DHA Ingredients Industry Revenue Share (%), by Country 2024 & 2032
- Figure 50: Asia Pacific EPA/DHA Ingredients Industry Volume Share (%), by Country 2024 & 2032
- Figure 51: South America EPA/DHA Ingredients Industry Revenue (Million), by Type 2024 & 2032
- Figure 52: South America EPA/DHA Ingredients Industry Volume (Billion), by Type 2024 & 2032
- Figure 53: South America EPA/DHA Ingredients Industry Revenue Share (%), by Type 2024 & 2032
- Figure 54: South America EPA/DHA Ingredients Industry Volume Share (%), by Type 2024 & 2032
- Figure 55: South America EPA/DHA Ingredients Industry Revenue (Million), by Source 2024 & 2032
- Figure 56: South America EPA/DHA Ingredients Industry Volume (Billion), by Source 2024 & 2032
- Figure 57: South America EPA/DHA Ingredients Industry Revenue Share (%), by Source 2024 & 2032
- Figure 58: South America EPA/DHA Ingredients Industry Volume Share (%), by Source 2024 & 2032
- Figure 59: South America EPA/DHA Ingredients Industry Revenue (Million), by Application 2024 & 2032
- Figure 60: South America EPA/DHA Ingredients Industry Volume (Billion), by Application 2024 & 2032
- Figure 61: South America EPA/DHA Ingredients Industry Revenue Share (%), by Application 2024 & 2032
- Figure 62: South America EPA/DHA Ingredients Industry Volume Share (%), by Application 2024 & 2032
- Figure 63: South America EPA/DHA Ingredients Industry Revenue (Million), by Country 2024 & 2032
- Figure 64: South America EPA/DHA Ingredients Industry Volume (Billion), by Country 2024 & 2032
- Figure 65: South America EPA/DHA Ingredients Industry Revenue Share (%), by Country 2024 & 2032
- Figure 66: South America EPA/DHA Ingredients Industry Volume Share (%), by Country 2024 & 2032
- Figure 67: Middle East and Africa EPA/DHA Ingredients Industry Revenue (Million), by Type 2024 & 2032
- Figure 68: Middle East and Africa EPA/DHA Ingredients Industry Volume (Billion), by Type 2024 & 2032
- Figure 69: Middle East and Africa EPA/DHA Ingredients Industry Revenue Share (%), by Type 2024 & 2032
- Figure 70: Middle East and Africa EPA/DHA Ingredients Industry Volume Share (%), by Type 2024 & 2032
- Figure 71: Middle East and Africa EPA/DHA Ingredients Industry Revenue (Million), by Source 2024 & 2032
- Figure 72: Middle East and Africa EPA/DHA Ingredients Industry Volume (Billion), by Source 2024 & 2032
- Figure 73: Middle East and Africa EPA/DHA Ingredients Industry Revenue Share (%), by Source 2024 & 2032
- Figure 74: Middle East and Africa EPA/DHA Ingredients Industry Volume Share (%), by Source 2024 & 2032
- Figure 75: Middle East and Africa EPA/DHA Ingredients Industry Revenue (Million), by Application 2024 & 2032
- Figure 76: Middle East and Africa EPA/DHA Ingredients Industry Volume (Billion), by Application 2024 & 2032
- Figure 77: Middle East and Africa EPA/DHA Ingredients Industry Revenue Share (%), by Application 2024 & 2032
- Figure 78: Middle East and Africa EPA/DHA Ingredients Industry Volume Share (%), by Application 2024 & 2032
- Figure 79: Middle East and Africa EPA/DHA Ingredients Industry Revenue (Million), by Country 2024 & 2032
- Figure 80: Middle East and Africa EPA/DHA Ingredients Industry Volume (Billion), by Country 2024 & 2032
- Figure 81: Middle East and Africa EPA/DHA Ingredients Industry Revenue Share (%), by Country 2024 & 2032
- Figure 82: Middle East and Africa EPA/DHA Ingredients Industry Volume Share (%), by Country 2024 & 2032
List of Tables
- Table 1: Global EPA/DHA Ingredients Industry Revenue Million Forecast, by Region 2019 & 2032
- Table 2: Global EPA/DHA Ingredients Industry Volume Billion Forecast, by Region 2019 & 2032
- Table 3: Global EPA/DHA Ingredients Industry Revenue Million Forecast, by Type 2019 & 2032
- Table 4: Global EPA/DHA Ingredients Industry Volume Billion Forecast, by Type 2019 & 2032
- Table 5: Global EPA/DHA Ingredients Industry Revenue Million Forecast, by Source 2019 & 2032
- Table 6: Global EPA/DHA Ingredients Industry Volume Billion Forecast, by Source 2019 & 2032
- Table 7: Global EPA/DHA Ingredients Industry Revenue Million Forecast, by Application 2019 & 2032
- Table 8: Global EPA/DHA Ingredients Industry Volume Billion Forecast, by Application 2019 & 2032
- Table 9: Global EPA/DHA Ingredients Industry Revenue Million Forecast, by Region 2019 & 2032
- Table 10: Global EPA/DHA Ingredients Industry Volume Billion Forecast, by Region 2019 & 2032
- Table 11: Global EPA/DHA Ingredients Industry Revenue Million Forecast, by Type 2019 & 2032
- Table 12: Global EPA/DHA Ingredients Industry Volume Billion Forecast, by Type 2019 & 2032
- Table 13: Global EPA/DHA Ingredients Industry Revenue Million Forecast, by Source 2019 & 2032
- Table 14: Global EPA/DHA Ingredients Industry Volume Billion Forecast, by Source 2019 & 2032
- Table 15: Global EPA/DHA Ingredients Industry Revenue Million Forecast, by Application 2019 & 2032
- Table 16: Global EPA/DHA Ingredients Industry Volume Billion Forecast, by Application 2019 & 2032
- Table 17: Global EPA/DHA Ingredients Industry Revenue Million Forecast, by Country 2019 & 2032
- Table 18: Global EPA/DHA Ingredients Industry Volume Billion Forecast, by Country 2019 & 2032
- Table 19: United States EPA/DHA Ingredients Industry Revenue (Million) Forecast, by Application 2019 & 2032
- Table 20: United States EPA/DHA Ingredients Industry Volume (Billion) Forecast, by Application 2019 & 2032
- Table 21: Mexico EPA/DHA Ingredients Industry Revenue (Million) Forecast, by Application 2019 & 2032
- Table 22: Mexico EPA/DHA Ingredients Industry Volume (Billion) Forecast, by Application 2019 & 2032
- Table 23: Canada EPA/DHA Ingredients Industry Revenue (Million) Forecast, by Application 2019 & 2032
- Table 24: Canada EPA/DHA Ingredients Industry Volume (Billion) Forecast, by Application 2019 & 2032
- Table 25: Rest of North America EPA/DHA Ingredients Industry Revenue (Million) Forecast, by Application 2019 & 2032
- Table 26: Rest of North America EPA/DHA Ingredients Industry Volume (Billion) Forecast, by Application 2019 & 2032
- Table 27: Global EPA/DHA Ingredients Industry Revenue Million Forecast, by Type 2019 & 2032
- Table 28: Global EPA/DHA Ingredients Industry Volume Billion Forecast, by Type 2019 & 2032
- Table 29: Global EPA/DHA Ingredients Industry Revenue Million Forecast, by Source 2019 & 2032
- Table 30: Global EPA/DHA Ingredients Industry Volume Billion Forecast, by Source 2019 & 2032
- Table 31: Global EPA/DHA Ingredients Industry Revenue Million Forecast, by Application 2019 & 2032
- Table 32: Global EPA/DHA Ingredients Industry Volume Billion Forecast, by Application 2019 & 2032
- Table 33: Global EPA/DHA Ingredients Industry Revenue Million Forecast, by Country 2019 & 2032
- Table 34: Global EPA/DHA Ingredients Industry Volume Billion Forecast, by Country 2019 & 2032
- Table 35: Spain EPA/DHA Ingredients Industry Revenue (Million) Forecast, by Application 2019 & 2032
- Table 36: Spain EPA/DHA Ingredients Industry Volume (Billion) Forecast, by Application 2019 & 2032
- Table 37: United Kingdom EPA/DHA Ingredients Industry Revenue (Million) Forecast, by Application 2019 & 2032
- Table 38: United Kingdom EPA/DHA Ingredients Industry Volume (Billion) Forecast, by Application 2019 & 2032
- Table 39: Germany EPA/DHA Ingredients Industry Revenue (Million) Forecast, by Application 2019 & 2032
- Table 40: Germany EPA/DHA Ingredients Industry Volume (Billion) Forecast, by Application 2019 & 2032
- Table 41: France EPA/DHA Ingredients Industry Revenue (Million) Forecast, by Application 2019 & 2032
- Table 42: France EPA/DHA Ingredients Industry Volume (Billion) Forecast, by Application 2019 & 2032
- Table 43: Russia EPA/DHA Ingredients Industry Revenue (Million) Forecast, by Application 2019 & 2032
- Table 44: Russia EPA/DHA Ingredients Industry Volume (Billion) Forecast, by Application 2019 & 2032
- Table 45: Italy EPA/DHA Ingredients Industry Revenue (Million) Forecast, by Application 2019 & 2032
- Table 46: Italy EPA/DHA Ingredients Industry Volume (Billion) Forecast, by Application 2019 & 2032
- Table 47: Rest of Europe EPA/DHA Ingredients Industry Revenue (Million) Forecast, by Application 2019 & 2032
- Table 48: Rest of Europe EPA/DHA Ingredients Industry Volume (Billion) Forecast, by Application 2019 & 2032
- Table 49: Global EPA/DHA Ingredients Industry Revenue Million Forecast, by Type 2019 & 2032
- Table 50: Global EPA/DHA Ingredients Industry Volume Billion Forecast, by Type 2019 & 2032
- Table 51: Global EPA/DHA Ingredients Industry Revenue Million Forecast, by Source 2019 & 2032
- Table 52: Global EPA/DHA Ingredients Industry Volume Billion Forecast, by Source 2019 & 2032
- Table 53: Global EPA/DHA Ingredients Industry Revenue Million Forecast, by Application 2019 & 2032
- Table 54: Global EPA/DHA Ingredients Industry Volume Billion Forecast, by Application 2019 & 2032
- Table 55: Global EPA/DHA Ingredients Industry Revenue Million Forecast, by Country 2019 & 2032
- Table 56: Global EPA/DHA Ingredients Industry Volume Billion Forecast, by Country 2019 & 2032
- Table 57: China EPA/DHA Ingredients Industry Revenue (Million) Forecast, by Application 2019 & 2032
- Table 58: China EPA/DHA Ingredients Industry Volume (Billion) Forecast, by Application 2019 & 2032
- Table 59: Japan EPA/DHA Ingredients Industry Revenue (Million) Forecast, by Application 2019 & 2032
- Table 60: Japan EPA/DHA Ingredients Industry Volume (Billion) Forecast, by Application 2019 & 2032
- Table 61: India EPA/DHA Ingredients Industry Revenue (Million) Forecast, by Application 2019 & 2032
- Table 62: India EPA/DHA Ingredients Industry Volume (Billion) Forecast, by Application 2019 & 2032
- Table 63: Australia EPA/DHA Ingredients Industry Revenue (Million) Forecast, by Application 2019 & 2032
- Table 64: Australia EPA/DHA Ingredients Industry Volume (Billion) Forecast, by Application 2019 & 2032
- Table 65: Rest of Asia Pacific EPA/DHA Ingredients Industry Revenue (Million) Forecast, by Application 2019 & 2032
- Table 66: Rest of Asia Pacific EPA/DHA Ingredients Industry Volume (Billion) Forecast, by Application 2019 & 2032
- Table 67: Global EPA/DHA Ingredients Industry Revenue Million Forecast, by Type 2019 & 2032
- Table 68: Global EPA/DHA Ingredients Industry Volume Billion Forecast, by Type 2019 & 2032
- Table 69: Global EPA/DHA Ingredients Industry Revenue Million Forecast, by Source 2019 & 2032
- Table 70: Global EPA/DHA Ingredients Industry Volume Billion Forecast, by Source 2019 & 2032
- Table 71: Global EPA/DHA Ingredients Industry Revenue Million Forecast, by Application 2019 & 2032
- Table 72: Global EPA/DHA Ingredients Industry Volume Billion Forecast, by Application 2019 & 2032
- Table 73: Global EPA/DHA Ingredients Industry Revenue Million Forecast, by Country 2019 & 2032
- Table 74: Global EPA/DHA Ingredients Industry Volume Billion Forecast, by Country 2019 & 2032
- Table 75: Brazil EPA/DHA Ingredients Industry Revenue (Million) Forecast, by Application 2019 & 2032
- Table 76: Brazil EPA/DHA Ingredients Industry Volume (Billion) Forecast, by Application 2019 & 2032
- Table 77: Argentina EPA/DHA Ingredients Industry Revenue (Million) Forecast, by Application 2019 & 2032
- Table 78: Argentina EPA/DHA Ingredients Industry Volume (Billion) Forecast, by Application 2019 & 2032
- Table 79: Rest of South America EPA/DHA Ingredients Industry Revenue (Million) Forecast, by Application 2019 & 2032
- Table 80: Rest of South America EPA/DHA Ingredients Industry Volume (Billion) Forecast, by Application 2019 & 2032
- Table 81: Global EPA/DHA Ingredients Industry Revenue Million Forecast, by Type 2019 & 2032
- Table 82: Global EPA/DHA Ingredients Industry Volume Billion Forecast, by Type 2019 & 2032
- Table 83: Global EPA/DHA Ingredients Industry Revenue Million Forecast, by Source 2019 & 2032
- Table 84: Global EPA/DHA Ingredients Industry Volume Billion Forecast, by Source 2019 & 2032
- Table 85: Global EPA/DHA Ingredients Industry Revenue Million Forecast, by Application 2019 & 2032
- Table 86: Global EPA/DHA Ingredients Industry Volume Billion Forecast, by Application 2019 & 2032
- Table 87: Global EPA/DHA Ingredients Industry Revenue Million Forecast, by Country 2019 & 2032
- Table 88: Global EPA/DHA Ingredients Industry Volume Billion Forecast, by Country 2019 & 2032
- Table 89: United Arab Emirates EPA/DHA Ingredients Industry Revenue (Million) Forecast, by Application 2019 & 2032
- Table 90: United Arab Emirates EPA/DHA Ingredients Industry Volume (Billion) Forecast, by Application 2019 & 2032
- Table 91: South Africa EPA/DHA Ingredients Industry Revenue (Million) Forecast, by Application 2019 & 2032
- Table 92: South Africa EPA/DHA Ingredients Industry Volume (Billion) Forecast, by Application 2019 & 2032
- Table 93: Rest of Middle East and Africa EPA/DHA Ingredients Industry Revenue (Million) Forecast, by Application 2019 & 2032
- Table 94: Rest of Middle East and Africa EPA/DHA Ingredients Industry Volume (Billion) Forecast, by Application 2019 & 2032
Frequently Asked Questions
1. What is the projected Compound Annual Growth Rate (CAGR) of the EPA/DHA Ingredients Industry?
The projected CAGR is approximately 7.51%.
2. Which companies are prominent players in the EPA/DHA Ingredients Industry?
Key companies in the market include Koninklijke DSM NV, KD Pharma Group, The Archer Daniels Midland Company, Corbion NV, Novasep Holding SAS, Neptune Wellness Solutions, BASF SE, Omega Protein Corporation, Croda International PLC, Novotech Nutraceuticals*List Not Exhaustive.
3. What are the main segments of the EPA/DHA Ingredients Industry?
The market segments include Type, Source, Application.
4. Can you provide details about the market size?
The market size is estimated to be USD 1.92 Million as of 2022.
5. What are some drivers contributing to market growth?
Increasing Awareness Of Health Benefits Associated With EPA And DHA; Demand for Concentrated Forms of Omega 3.
6. What are the notable trends driving market growth?
Increasing Awareness Of Health Benefits Associated With EPA And DHA.
7. Are there any restraints impacting market growth?
Increasing Awareness Of Health Benefits Associated With EPA And DHA; Demand for Concentrated Forms of Omega 3.
8. Can you provide examples of recent developments in the market?
March 2024: DSM-Firmenich partnered with SCN BestCo to launch omega-3 gummies with EPA and DHA ingredients.
9. What pricing options are available for accessing the report?
Pricing options include single-user, multi-user, and enterprise licenses priced at USD 4750, USD 5250, and USD 8750 respectively.
10. Is the market size provided in terms of value or volume?
The market size is provided in terms of value, measured in Million and volume, measured in Billion.
11. Are there any specific market keywords associated with the report?
Yes, the market keyword associated with the report is "EPA/DHA Ingredients Industry," which aids in identifying and referencing the specific market segment covered.
12. How do I determine which pricing option suits my needs best?
The pricing options vary based on user requirements and access needs. Individual users may opt for single-user licenses, while businesses requiring broader access may choose multi-user or enterprise licenses for cost-effective access to the report.
13. Are there any additional resources or data provided in the EPA/DHA Ingredients Industry report?
While the report offers comprehensive insights, it's advisable to review the specific contents or supplementary materials provided to ascertain if additional resources or data are available.
14. How can I stay updated on further developments or reports in the EPA/DHA Ingredients Industry?
To stay informed about further developments, trends, and reports in the EPA/DHA Ingredients Industry, consider subscribing to industry newsletters, following relevant companies and organizations, or regularly checking reputable industry news sources and publications.
Methodology
Step 1 - Identification of Relevant Samples Size from Population Database


Step 2 - Approaches for Defining Global Market Size (Value, Volume* & Price*)

Note*: In applicable scenarios
Step 3 - Data Sources
Primary Research
- Web Analytics
- Survey Reports
- Research Institute
- Latest Research Reports
- Opinion Leaders
Secondary Research
- Annual Reports
- White Paper
- Latest Press Release
- Industry Association
- Paid Database
- Investor Presentations

Step 4 - Data Triangulation
Involves using different sources of information in order to increase the validity of a study
These sources are likely to be stakeholders in a program - participants, other researchers, program staff, other community members, and so on.
Then we put all data in single framework & apply various statistical tools to find out the dynamic on the market.
During the analysis stage, feedback from the stakeholder groups would be compared to determine areas of agreement as well as areas of divergence


