
Key Insights
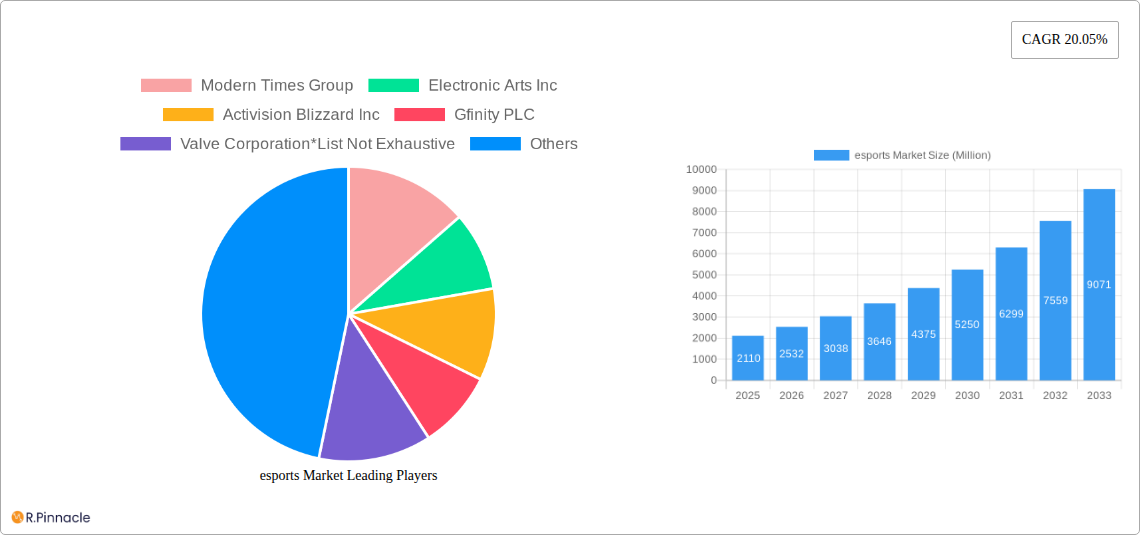
The global esports market is experiencing explosive growth, projected to reach $2.11 billion in 2025 and maintain a robust Compound Annual Growth Rate (CAGR) of 20.05% from 2025 to 2033. This expansion is driven by several key factors. Increasing viewership and engagement across platforms like Twitch and YouTube are fueling substantial revenue generation through media rights, advertising, sponsorships, merchandise sales, and ticket sales. The rise of mobile gaming and the broadening appeal of esports to a diverse audience contribute to this expansion. Furthermore, strategic investments from major players like Tencent Holdings Ltd (through Riot Games), Electronic Arts, and Activision Blizzard are solidifying the industry's infrastructure and broadening its reach. The increasing professionalism of esports, with the formation of leagues and franchises mirroring traditional sports, also contributes significantly to market growth. Geographic expansion, particularly in rapidly developing Asian markets like India and South Korea, presents immense untapped potential.
However, the market faces certain challenges. Competition among streaming platforms and game publishers is fierce, requiring continuous innovation and investment to maintain a competitive edge. Regulatory uncertainties in various regions and the need to address concerns about player welfare and game addiction require proactive measures from stakeholders. Despite these restraints, the overall trajectory indicates a highly promising future for the esports industry, with significant opportunities for growth across different segments and geographic regions. The consistent influx of investment and the increasing mainstream acceptance of esports suggest continued expansion in the coming decade. We can anticipate the diversification of revenue streams and the exploration of new technologies, such as virtual reality and augmented reality, to further enhance the viewing experience and overall industry value.
Esports Market Report: 2019-2033
This comprehensive report provides an in-depth analysis of the global esports market, covering historical data (2019-2024), the base year (2025), and a detailed forecast (2025-2033). The report meticulously examines market structure, innovation trends, dynamics, dominant regions, and key players, offering actionable insights for industry professionals and investors. With a focus on revenue models, streaming platforms, and technological advancements, this report is essential for anyone seeking to understand and capitalize on the rapidly growing esports landscape. The market is projected to reach xx Million by 2033.
Esports Market Market Structure & Innovation Trends
This section analyzes the competitive landscape of the esports market, exploring market concentration, key innovation drivers, regulatory frameworks, product substitutes, end-user demographics, and mergers and acquisitions (M&A) activities. The report utilizes a combination of qualitative and quantitative data to provide a holistic view of the market structure.
Market Concentration: The esports market exhibits a moderately concentrated structure, with a few major players commanding significant market share. While precise market share figures vary by segment, companies like Tencent Holdings Ltd (through Riot Games), Activision Blizzard, and Electronic Arts hold substantial influence. The report details the market share of key players and assesses the level of competition.
Innovation Drivers: Technological advancements, including improved game engines, virtual reality (VR), and augmented reality (AR) integration, are driving innovation. The increasing sophistication of streaming technology and the rise of mobile esports are also contributing factors.
Regulatory Frameworks: The report analyzes the evolving regulatory landscape concerning esports, including data privacy, gambling regulations, and intellectual property rights. Variations across different jurisdictions are highlighted.
Product Substitutes: Traditional sports and other forms of entertainment represent potential substitutes for esports. However, esports’ unique interactive and engaging nature provides a strong competitive advantage.
End-User Demographics: The report segments the end-user base by age, gender, geographic location, and engagement level. This demographic analysis provides valuable insights into market potential and future growth trends.
M&A Activities: The report reviews significant M&A activities within the esports industry during the study period (2019-2024), providing deal values and an analysis of their impact on market consolidation and competitive dynamics. xx Million in M&A deals were recorded during the historical period, indicative of consolidation within the sector.

Esports Market Market Dynamics & Trends
This section delves into the key factors driving market growth, encompassing technological disruptions, evolving consumer preferences, and competitive dynamics. The report uses a combination of qualitative and quantitative data, including compound annual growth rates (CAGR) and market penetration rates, to provide a comprehensive understanding of the market's dynamics. The global esports market is experiencing significant growth fueled by several key factors: increased investment from traditional sports and media companies, technological advancements, expanding viewership and participation, and the rise of mobile gaming. The market’s CAGR during the forecast period is estimated to be xx%. Market penetration within key demographics continues to rise, indicating further growth potential.
Dominant Regions & Segments in esports Market
This section identifies the leading regions and segments within the esports market. The analysis considers both geographical distribution and revenue models and streaming platforms.
By Revenue Model:
Media Rights: The media rights segment is a significant revenue generator, with substantial growth projected for the forecast period. Key drivers include increasing broadcasting deals and the rising popularity of esports tournaments.
Advertising and Sponsorships: This segment is experiencing substantial growth due to the increasing viewership and engagement of esports events. Major brands are increasingly recognizing the value of sponsoring esports teams and events.
Merchandise and Tickets: The merchandise and ticketing segment is growing, driven by the increased popularity of esports events and the growing fanbase of esports teams.
Other Revenue Models: This category includes revenue from merchandise, subscriptions and other streams, which are exhibiting moderate to strong growth driven by increased brand engagement and investment.
By Streaming Platform:
Twitch: Twitch remains the dominant streaming platform for esports, benefiting from its established user base and robust features. Twitch's market share is expected to remain significant.
YouTube: YouTube is a major competitor, attracting significant viewership through its diverse content offering. It holds a substantial but slightly smaller share compared to Twitch.
Other Streaming Platforms (DouYu and Huya): Other platforms, particularly in the Asian market, contribute to the overall streaming landscape, while experiencing varying levels of market penetration depending on region and game.
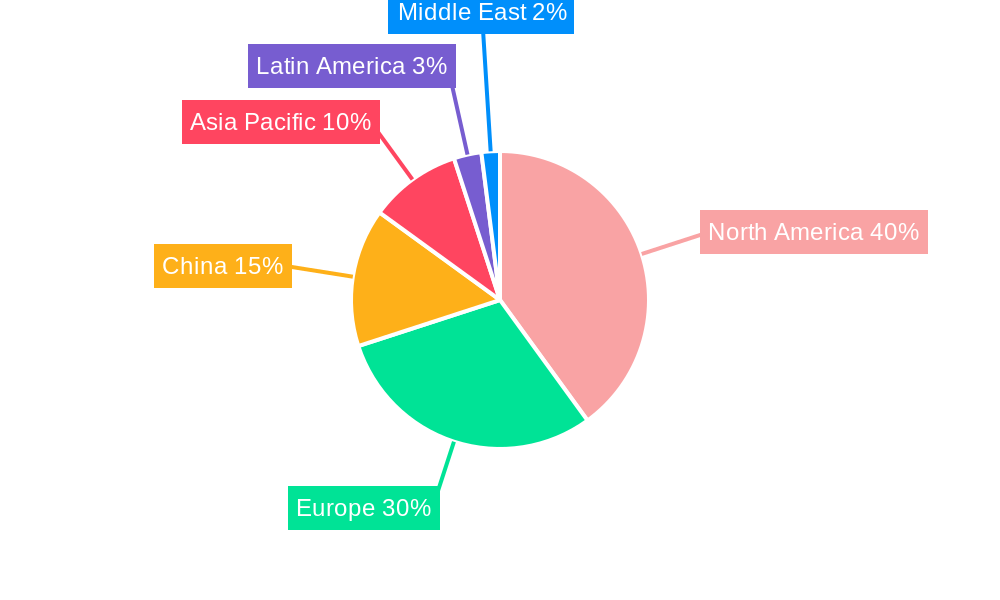
Dominant Regions: Asia, specifically regions like China, South Korea, and Japan, currently represent the dominant regions in the esports market, driven by factors such as high internet penetration, large gaming populations, and strong government support for the industry. North America and Europe also represent significant markets with strong growth potential.
Esports Market Product Innovations
The esports market is characterized by continuous product innovation, driven by advancements in game technology, hardware, and software. New game releases, enhanced streaming capabilities, and the development of more immersive VR/AR experiences are key drivers of innovation. The integration of technologies like NVIDIA Reflex, which significantly reduces system latency, demonstrates the industry's commitment to optimizing the gaming experience. This directly impacts competitive performance and further enhances audience engagement.
Report Scope & Segmentation Analysis
This report comprehensively segments the esports market by revenue model (Media Rights, Advertising and Sponsorships, Merchandise and Tickets, Other Revenue Models) and streaming platform (Twitch, YouTube, Other Streaming Platforms). Each segment is analyzed in detail, providing market size estimations, growth projections, and competitive dynamics for both the historical period (2019-2024) and the forecast period (2025-2033).
Key Drivers of esports Market Growth
Several key factors are driving the growth of the esports market: the rising popularity of esports among younger generations, increasing investment from major corporations and venture capitalists, technological advancements in gaming hardware and software, the expansion of streaming platforms, and the growing recognition of esports as a legitimate sporting discipline. The increasing professionalization of esports, with established leagues and tournaments, also contributes to market expansion.
Challenges in the esports Market Sector
The esports market faces several challenges, including regulatory uncertainties concerning gambling, potential market saturation in certain segments, the need for sustainable business models for smaller esports organizations, and concerns around player burnout and well-being. Maintaining player interest and attracting new audiences requires constant innovation and adaptation.
Emerging Opportunities in esports Market
Emerging opportunities in the esports market include the expansion into new geographic regions, the increasing integration of esports into mainstream media and entertainment, the growth of mobile esports, and the development of new revenue streams through NFTs and metaverse integration. The continued development of VR/AR technology presents significant growth potential.
Leading Players in the esports Market Market
- Modern Times Group
- Electronic Arts Inc
- Activision Blizzard Inc
- Gfinity PLC
- Valve Corporation
- Riot Games Inc (Tencent Holdings Ltd)
- Faceit
- Epic Games Inc
- Capcom Co Ltd
Key Developments in esports Market Industry
January 2022: Launch of 1440p NVIDIA G-SYNC esports screens and NVIDIA Reflex low latency technology integration into multiple top-tier games. This significantly enhanced the gaming experience and is expected to boost market growth.
February 2022: Nintendo's Direct event announced several new and remastered games for the Switch, boosting the market with anticipation for new titles and increased player participation.
Future Outlook for esports Market Market
The future of the esports market is bright, with continued growth expected across all segments. Technological advancements, increasing media coverage, and the growing professionalization of the industry will drive further expansion. Strategic partnerships and collaborations between traditional sports organizations and esports companies will play a key role in shaping the future of this dynamic market. The global esports market is projected to experience significant growth in the coming years, driven by factors such as increasing viewership, higher investments, and the expansion of new games and platforms.
esports Market Segmentation
-
1. Revenue Model
- 1.1. Media Rights
- 1.2. Advertising and Sponsorships
- 1.3. Merchandise and Tickets
- 1.4. Other Revenue Models
-
2. Streaming Platform
- 2.1. Twitch
- 2.2. YouTube
- 2.3. Other Streaming Platforms ( DouYu and Hayu )
esports Market Segmentation By Geography
-
1. North America
- 1.1. United States
- 1.2. Canada
- 1.3. Rest of North America
-
2. Europe
- 2.1. Germany
- 2.2. United Kingdom
- 2.3. France
- 2.4. Rest of Europe
- 3. China
- 4. Asia Pacific
-
5. Japan
- 5.1. India
- 5.2. South Korea
- 5.3. Rest of Asia Pacific
- 6. Latin America
- 7. Middle East
esports Market REPORT HIGHLIGHTS
| Aspects | Details |
|---|---|
| Study Period | 2019-2033 |
| Base Year | 2024 |
| Estimated Year | 2025 |
| Forecast Period | 2025-2033 |
| Historical Period | 2019-2024 |
| Growth Rate | CAGR of 20.05% from 2019-2033 |
| Segmentation |
|
Table of Contents
- 1. Introduction
- 1.1. Research Scope
- 1.2. Market Segmentation
- 1.3. Research Methodology
- 1.4. Definitions and Assumptions
- 2. Executive Summary
- 2.1. Introduction
- 3. Market Dynamics
- 3.1. Introduction
- 3.2. Market Drivers
- 3.2.1. Increasing Popularity of Video Games; Growing Awareness about eSports
- 3.3. Market Restrains
- 3.3.1 Issues Such as Piracy
- 3.3.2 Laws and Regulations
- 3.3.3 and Concerns Relating to Fraud During Gaming Transactions
- 3.4. Market Trends
- 3.4.1. Advertising to be the Largest Sources of eSports Revenue
- 4. Market Factor Analysis
- 4.1. Porters Five Forces
- 4.2. Supply/Value Chain
- 4.3. PESTEL analysis
- 4.4. Market Entropy
- 4.5. Patent/Trademark Analysis
- 5. Global esports Market Analysis, Insights and Forecast, 2019-2031
- 5.1. Market Analysis, Insights and Forecast - by Revenue Model
- 5.1.1. Media Rights
- 5.1.2. Advertising and Sponsorships
- 5.1.3. Merchandise and Tickets
- 5.1.4. Other Revenue Models
- 5.2. Market Analysis, Insights and Forecast - by Streaming Platform
- 5.2.1. Twitch
- 5.2.2. YouTube
- 5.2.3. Other Streaming Platforms ( DouYu and Hayu )
- 5.3. Market Analysis, Insights and Forecast - by Region
- 5.3.1. North America
- 5.3.2. Europe
- 5.3.3. China
- 5.3.4. Asia Pacific
- 5.3.5. Japan
- 5.3.6. Latin America
- 5.3.7. Middle East
- 5.1. Market Analysis, Insights and Forecast - by Revenue Model
- 6. North America esports Market Analysis, Insights and Forecast, 2019-2031
- 6.1. Market Analysis, Insights and Forecast - by Revenue Model
- 6.1.1. Media Rights
- 6.1.2. Advertising and Sponsorships
- 6.1.3. Merchandise and Tickets
- 6.1.4. Other Revenue Models
- 6.2. Market Analysis, Insights and Forecast - by Streaming Platform
- 6.2.1. Twitch
- 6.2.2. YouTube
- 6.2.3. Other Streaming Platforms ( DouYu and Hayu )
- 6.1. Market Analysis, Insights and Forecast - by Revenue Model
- 7. Europe esports Market Analysis, Insights and Forecast, 2019-2031
- 7.1. Market Analysis, Insights and Forecast - by Revenue Model
- 7.1.1. Media Rights
- 7.1.2. Advertising and Sponsorships
- 7.1.3. Merchandise and Tickets
- 7.1.4. Other Revenue Models
- 7.2. Market Analysis, Insights and Forecast - by Streaming Platform
- 7.2.1. Twitch
- 7.2.2. YouTube
- 7.2.3. Other Streaming Platforms ( DouYu and Hayu )
- 7.1. Market Analysis, Insights and Forecast - by Revenue Model
- 8. China esports Market Analysis, Insights and Forecast, 2019-2031
- 8.1. Market Analysis, Insights and Forecast - by Revenue Model
- 8.1.1. Media Rights
- 8.1.2. Advertising and Sponsorships
- 8.1.3. Merchandise and Tickets
- 8.1.4. Other Revenue Models
- 8.2. Market Analysis, Insights and Forecast - by Streaming Platform
- 8.2.1. Twitch
- 8.2.2. YouTube
- 8.2.3. Other Streaming Platforms ( DouYu and Hayu )
- 8.1. Market Analysis, Insights and Forecast - by Revenue Model
- 9. Asia Pacific esports Market Analysis, Insights and Forecast, 2019-2031
- 9.1. Market Analysis, Insights and Forecast - by Revenue Model
- 9.1.1. Media Rights
- 9.1.2. Advertising and Sponsorships
- 9.1.3. Merchandise and Tickets
- 9.1.4. Other Revenue Models
- 9.2. Market Analysis, Insights and Forecast - by Streaming Platform
- 9.2.1. Twitch
- 9.2.2. YouTube
- 9.2.3. Other Streaming Platforms ( DouYu and Hayu )
- 9.1. Market Analysis, Insights and Forecast - by Revenue Model
- 10. Japan esports Market Analysis, Insights and Forecast, 2019-2031
- 10.1. Market Analysis, Insights and Forecast - by Revenue Model
- 10.1.1. Media Rights
- 10.1.2. Advertising and Sponsorships
- 10.1.3. Merchandise and Tickets
- 10.1.4. Other Revenue Models
- 10.2. Market Analysis, Insights and Forecast - by Streaming Platform
- 10.2.1. Twitch
- 10.2.2. YouTube
- 10.2.3. Other Streaming Platforms ( DouYu and Hayu )
- 10.1. Market Analysis, Insights and Forecast - by Revenue Model
- 11. Latin America esports Market Analysis, Insights and Forecast, 2019-2031
- 11.1. Market Analysis, Insights and Forecast - by Revenue Model
- 11.1.1. Media Rights
- 11.1.2. Advertising and Sponsorships
- 11.1.3. Merchandise and Tickets
- 11.1.4. Other Revenue Models
- 11.2. Market Analysis, Insights and Forecast - by Streaming Platform
- 11.2.1. Twitch
- 11.2.2. YouTube
- 11.2.3. Other Streaming Platforms ( DouYu and Hayu )
- 11.1. Market Analysis, Insights and Forecast - by Revenue Model
- 12. Middle East esports Market Analysis, Insights and Forecast, 2019-2031
- 12.1. Market Analysis, Insights and Forecast - by Revenue Model
- 12.1.1. Media Rights
- 12.1.2. Advertising and Sponsorships
- 12.1.3. Merchandise and Tickets
- 12.1.4. Other Revenue Models
- 12.2. Market Analysis, Insights and Forecast - by Streaming Platform
- 12.2.1. Twitch
- 12.2.2. YouTube
- 12.2.3. Other Streaming Platforms ( DouYu and Hayu )
- 12.1. Market Analysis, Insights and Forecast - by Revenue Model
- 13. North America esports Market Analysis, Insights and Forecast, 2019-2031
- 13.1. Market Analysis, Insights and Forecast - By Country/Sub-region
- 13.1.1 United States
- 13.1.2 Canada
- 13.1.3 Rest of North America
- 14. Europe esports Market Analysis, Insights and Forecast, 2019-2031
- 14.1. Market Analysis, Insights and Forecast - By Country/Sub-region
- 14.1.1 Germany
- 14.1.2 United Kingdom
- 14.1.3 France
- 14.1.4 Rest of Europe
- 15. China esports Market Analysis, Insights and Forecast, 2019-2031
- 15.1. Market Analysis, Insights and Forecast - By Country/Sub-region
- 15.1.1.
- 16. Asia Pacific esports Market Analysis, Insights and Forecast, 2019-2031
- 16.1. Market Analysis, Insights and Forecast - By Country/Sub-region
- 16.1.1.
- 17. Japan esports Market Analysis, Insights and Forecast, 2019-2031
- 17.1. Market Analysis, Insights and Forecast - By Country/Sub-region
- 17.1.1 India
- 17.1.2 South Korea
- 17.1.3 Rest of Asia Pacific
- 18. Latin America esports Market Analysis, Insights and Forecast, 2019-2031
- 18.1. Market Analysis, Insights and Forecast - By Country/Sub-region
- 18.1.1.
- 19. Middle East esports Market Analysis, Insights and Forecast, 2019-2031
- 19.1. Market Analysis, Insights and Forecast - By Country/Sub-region
- 19.1.1.
- 20. Competitive Analysis
- 20.1. Global Market Share Analysis 2024
- 20.2. Company Profiles
- 20.2.1 Modern Times Group
- 20.2.1.1. Overview
- 20.2.1.2. Products
- 20.2.1.3. SWOT Analysis
- 20.2.1.4. Recent Developments
- 20.2.1.5. Financials (Based on Availability)
- 20.2.2 Electronic Arts Inc
- 20.2.2.1. Overview
- 20.2.2.2. Products
- 20.2.2.3. SWOT Analysis
- 20.2.2.4. Recent Developments
- 20.2.2.5. Financials (Based on Availability)
- 20.2.3 Activision Blizzard Inc
- 20.2.3.1. Overview
- 20.2.3.2. Products
- 20.2.3.3. SWOT Analysis
- 20.2.3.4. Recent Developments
- 20.2.3.5. Financials (Based on Availability)
- 20.2.4 Gfinity PLC
- 20.2.4.1. Overview
- 20.2.4.2. Products
- 20.2.4.3. SWOT Analysis
- 20.2.4.4. Recent Developments
- 20.2.4.5. Financials (Based on Availability)
- 20.2.5 Valve Corporation*List Not Exhaustive
- 20.2.5.1. Overview
- 20.2.5.2. Products
- 20.2.5.3. SWOT Analysis
- 20.2.5.4. Recent Developments
- 20.2.5.5. Financials (Based on Availability)
- 20.2.6 Riot Games Inc ( Tencent Holdings Ltd)
- 20.2.6.1. Overview
- 20.2.6.2. Products
- 20.2.6.3. SWOT Analysis
- 20.2.6.4. Recent Developments
- 20.2.6.5. Financials (Based on Availability)
- 20.2.7 Faceit
- 20.2.7.1. Overview
- 20.2.7.2. Products
- 20.2.7.3. SWOT Analysis
- 20.2.7.4. Recent Developments
- 20.2.7.5. Financials (Based on Availability)
- 20.2.8 Epic Games Inc
- 20.2.8.1. Overview
- 20.2.8.2. Products
- 20.2.8.3. SWOT Analysis
- 20.2.8.4. Recent Developments
- 20.2.8.5. Financials (Based on Availability)
- 20.2.9 Capcom Co Ltd
- 20.2.9.1. Overview
- 20.2.9.2. Products
- 20.2.9.3. SWOT Analysis
- 20.2.9.4. Recent Developments
- 20.2.9.5. Financials (Based on Availability)
- 20.2.1 Modern Times Group
List of Figures
- Figure 1: Global esports Market Revenue Breakdown (Million, %) by Region 2024 & 2032
- Figure 2: North America esports Market Revenue (Million), by Country 2024 & 2032
- Figure 3: North America esports Market Revenue Share (%), by Country 2024 & 2032
- Figure 4: Europe esports Market Revenue (Million), by Country 2024 & 2032
- Figure 5: Europe esports Market Revenue Share (%), by Country 2024 & 2032
- Figure 6: China esports Market Revenue (Million), by Country 2024 & 2032
- Figure 7: China esports Market Revenue Share (%), by Country 2024 & 2032
- Figure 8: Asia Pacific esports Market Revenue (Million), by Country 2024 & 2032
- Figure 9: Asia Pacific esports Market Revenue Share (%), by Country 2024 & 2032
- Figure 10: Japan esports Market Revenue (Million), by Country 2024 & 2032
- Figure 11: Japan esports Market Revenue Share (%), by Country 2024 & 2032
- Figure 12: Latin America esports Market Revenue (Million), by Country 2024 & 2032
- Figure 13: Latin America esports Market Revenue Share (%), by Country 2024 & 2032
- Figure 14: Middle East esports Market Revenue (Million), by Country 2024 & 2032
- Figure 15: Middle East esports Market Revenue Share (%), by Country 2024 & 2032
- Figure 16: North America esports Market Revenue (Million), by Revenue Model 2024 & 2032
- Figure 17: North America esports Market Revenue Share (%), by Revenue Model 2024 & 2032
- Figure 18: North America esports Market Revenue (Million), by Streaming Platform 2024 & 2032
- Figure 19: North America esports Market Revenue Share (%), by Streaming Platform 2024 & 2032
- Figure 20: North America esports Market Revenue (Million), by Country 2024 & 2032
- Figure 21: North America esports Market Revenue Share (%), by Country 2024 & 2032
- Figure 22: Europe esports Market Revenue (Million), by Revenue Model 2024 & 2032
- Figure 23: Europe esports Market Revenue Share (%), by Revenue Model 2024 & 2032
- Figure 24: Europe esports Market Revenue (Million), by Streaming Platform 2024 & 2032
- Figure 25: Europe esports Market Revenue Share (%), by Streaming Platform 2024 & 2032
- Figure 26: Europe esports Market Revenue (Million), by Country 2024 & 2032
- Figure 27: Europe esports Market Revenue Share (%), by Country 2024 & 2032
- Figure 28: China esports Market Revenue (Million), by Revenue Model 2024 & 2032
- Figure 29: China esports Market Revenue Share (%), by Revenue Model 2024 & 2032
- Figure 30: China esports Market Revenue (Million), by Streaming Platform 2024 & 2032
- Figure 31: China esports Market Revenue Share (%), by Streaming Platform 2024 & 2032
- Figure 32: China esports Market Revenue (Million), by Country 2024 & 2032
- Figure 33: China esports Market Revenue Share (%), by Country 2024 & 2032
- Figure 34: Asia Pacific esports Market Revenue (Million), by Revenue Model 2024 & 2032
- Figure 35: Asia Pacific esports Market Revenue Share (%), by Revenue Model 2024 & 2032
- Figure 36: Asia Pacific esports Market Revenue (Million), by Streaming Platform 2024 & 2032
- Figure 37: Asia Pacific esports Market Revenue Share (%), by Streaming Platform 2024 & 2032
- Figure 38: Asia Pacific esports Market Revenue (Million), by Country 2024 & 2032
- Figure 39: Asia Pacific esports Market Revenue Share (%), by Country 2024 & 2032
- Figure 40: Japan esports Market Revenue (Million), by Revenue Model 2024 & 2032
- Figure 41: Japan esports Market Revenue Share (%), by Revenue Model 2024 & 2032
- Figure 42: Japan esports Market Revenue (Million), by Streaming Platform 2024 & 2032
- Figure 43: Japan esports Market Revenue Share (%), by Streaming Platform 2024 & 2032
- Figure 44: Japan esports Market Revenue (Million), by Country 2024 & 2032
- Figure 45: Japan esports Market Revenue Share (%), by Country 2024 & 2032
- Figure 46: Latin America esports Market Revenue (Million), by Revenue Model 2024 & 2032
- Figure 47: Latin America esports Market Revenue Share (%), by Revenue Model 2024 & 2032
- Figure 48: Latin America esports Market Revenue (Million), by Streaming Platform 2024 & 2032
- Figure 49: Latin America esports Market Revenue Share (%), by Streaming Platform 2024 & 2032
- Figure 50: Latin America esports Market Revenue (Million), by Country 2024 & 2032
- Figure 51: Latin America esports Market Revenue Share (%), by Country 2024 & 2032
- Figure 52: Middle East esports Market Revenue (Million), by Revenue Model 2024 & 2032
- Figure 53: Middle East esports Market Revenue Share (%), by Revenue Model 2024 & 2032
- Figure 54: Middle East esports Market Revenue (Million), by Streaming Platform 2024 & 2032
- Figure 55: Middle East esports Market Revenue Share (%), by Streaming Platform 2024 & 2032
- Figure 56: Middle East esports Market Revenue (Million), by Country 2024 & 2032
- Figure 57: Middle East esports Market Revenue Share (%), by Country 2024 & 2032
List of Tables
- Table 1: Global esports Market Revenue Million Forecast, by Region 2019 & 2032
- Table 2: Global esports Market Revenue Million Forecast, by Revenue Model 2019 & 2032
- Table 3: Global esports Market Revenue Million Forecast, by Streaming Platform 2019 & 2032
- Table 4: Global esports Market Revenue Million Forecast, by Region 2019 & 2032
- Table 5: Global esports Market Revenue Million Forecast, by Country 2019 & 2032
- Table 6: United States esports Market Revenue (Million) Forecast, by Application 2019 & 2032
- Table 7: Canada esports Market Revenue (Million) Forecast, by Application 2019 & 2032
- Table 8: Rest of North America esports Market Revenue (Million) Forecast, by Application 2019 & 2032
- Table 9: Global esports Market Revenue Million Forecast, by Country 2019 & 2032
- Table 10: Germany esports Market Revenue (Million) Forecast, by Application 2019 & 2032
- Table 11: United Kingdom esports Market Revenue (Million) Forecast, by Application 2019 & 2032
- Table 12: France esports Market Revenue (Million) Forecast, by Application 2019 & 2032
- Table 13: Rest of Europe esports Market Revenue (Million) Forecast, by Application 2019 & 2032
- Table 14: Global esports Market Revenue Million Forecast, by Country 2019 & 2032
- Table 15: esports Market Revenue (Million) Forecast, by Application 2019 & 2032
- Table 16: Global esports Market Revenue Million Forecast, by Country 2019 & 2032
- Table 17: esports Market Revenue (Million) Forecast, by Application 2019 & 2032
- Table 18: Global esports Market Revenue Million Forecast, by Country 2019 & 2032
- Table 19: India esports Market Revenue (Million) Forecast, by Application 2019 & 2032
- Table 20: South Korea esports Market Revenue (Million) Forecast, by Application 2019 & 2032
- Table 21: Rest of Asia Pacific esports Market Revenue (Million) Forecast, by Application 2019 & 2032
- Table 22: Global esports Market Revenue Million Forecast, by Country 2019 & 2032
- Table 23: esports Market Revenue (Million) Forecast, by Application 2019 & 2032
- Table 24: Global esports Market Revenue Million Forecast, by Country 2019 & 2032
- Table 25: esports Market Revenue (Million) Forecast, by Application 2019 & 2032
- Table 26: Global esports Market Revenue Million Forecast, by Revenue Model 2019 & 2032
- Table 27: Global esports Market Revenue Million Forecast, by Streaming Platform 2019 & 2032
- Table 28: Global esports Market Revenue Million Forecast, by Country 2019 & 2032
- Table 29: United States esports Market Revenue (Million) Forecast, by Application 2019 & 2032
- Table 30: Canada esports Market Revenue (Million) Forecast, by Application 2019 & 2032
- Table 31: Rest of North America esports Market Revenue (Million) Forecast, by Application 2019 & 2032
- Table 32: Global esports Market Revenue Million Forecast, by Revenue Model 2019 & 2032
- Table 33: Global esports Market Revenue Million Forecast, by Streaming Platform 2019 & 2032
- Table 34: Global esports Market Revenue Million Forecast, by Country 2019 & 2032
- Table 35: Germany esports Market Revenue (Million) Forecast, by Application 2019 & 2032
- Table 36: United Kingdom esports Market Revenue (Million) Forecast, by Application 2019 & 2032
- Table 37: France esports Market Revenue (Million) Forecast, by Application 2019 & 2032
- Table 38: Rest of Europe esports Market Revenue (Million) Forecast, by Application 2019 & 2032
- Table 39: Global esports Market Revenue Million Forecast, by Revenue Model 2019 & 2032
- Table 40: Global esports Market Revenue Million Forecast, by Streaming Platform 2019 & 2032
- Table 41: Global esports Market Revenue Million Forecast, by Country 2019 & 2032
- Table 42: Global esports Market Revenue Million Forecast, by Revenue Model 2019 & 2032
- Table 43: Global esports Market Revenue Million Forecast, by Streaming Platform 2019 & 2032
- Table 44: Global esports Market Revenue Million Forecast, by Country 2019 & 2032
- Table 45: Global esports Market Revenue Million Forecast, by Revenue Model 2019 & 2032
- Table 46: Global esports Market Revenue Million Forecast, by Streaming Platform 2019 & 2032
- Table 47: Global esports Market Revenue Million Forecast, by Country 2019 & 2032
- Table 48: India esports Market Revenue (Million) Forecast, by Application 2019 & 2032
- Table 49: South Korea esports Market Revenue (Million) Forecast, by Application 2019 & 2032
- Table 50: Rest of Asia Pacific esports Market Revenue (Million) Forecast, by Application 2019 & 2032
- Table 51: Global esports Market Revenue Million Forecast, by Revenue Model 2019 & 2032
- Table 52: Global esports Market Revenue Million Forecast, by Streaming Platform 2019 & 2032
- Table 53: Global esports Market Revenue Million Forecast, by Country 2019 & 2032
- Table 54: Global esports Market Revenue Million Forecast, by Revenue Model 2019 & 2032
- Table 55: Global esports Market Revenue Million Forecast, by Streaming Platform 2019 & 2032
- Table 56: Global esports Market Revenue Million Forecast, by Country 2019 & 2032
Frequently Asked Questions
1. What is the projected Compound Annual Growth Rate (CAGR) of the esports Market?
The projected CAGR is approximately 20.05%.
2. Which companies are prominent players in the esports Market?
Key companies in the market include Modern Times Group, Electronic Arts Inc, Activision Blizzard Inc, Gfinity PLC, Valve Corporation*List Not Exhaustive, Riot Games Inc ( Tencent Holdings Ltd), Faceit, Epic Games Inc, Capcom Co Ltd.
3. What are the main segments of the esports Market?
The market segments include Revenue Model, Streaming Platform.
4. Can you provide details about the market size?
The market size is estimated to be USD 2.11 Million as of 2022.
5. What are some drivers contributing to market growth?
Increasing Popularity of Video Games; Growing Awareness about eSports.
6. What are the notable trends driving market growth?
Advertising to be the Largest Sources of eSports Revenue.
7. Are there any restraints impacting market growth?
Issues Such as Piracy. Laws and Regulations. and Concerns Relating to Fraud During Gaming Transactions.
8. Can you provide examples of recent developments in the market?
January 2022 - A new category of 1440p NVIDIA G-SYNC esports screens and seven new games benefit from low latency thanks to NVIDIA Reflex. Since reducing system latency is recognized by gamers and game developers as essential to a quality gaming experience, the NVIDIA Reflex low latency ecosystem has grown significantly over the past year. Eight top-ten competitive shooters, including Apex Legends, Valorant, and Fortnite, support Reflex. Each month, more than 20 million GeForce gamers battle with Reflex ON. More than 50 mouse and screens support their Reflex Analyzer, enabling players to assess system latency quickly. Such developments are expected to flourish the esports market in the forecast period.
9. What pricing options are available for accessing the report?
Pricing options include single-user, multi-user, and enterprise licenses priced at USD 4750, USD 5250, and USD 8750 respectively.
10. Is the market size provided in terms of value or volume?
The market size is provided in terms of value, measured in Million.
11. Are there any specific market keywords associated with the report?
Yes, the market keyword associated with the report is "esports Market," which aids in identifying and referencing the specific market segment covered.
12. How do I determine which pricing option suits my needs best?
The pricing options vary based on user requirements and access needs. Individual users may opt for single-user licenses, while businesses requiring broader access may choose multi-user or enterprise licenses for cost-effective access to the report.
13. Are there any additional resources or data provided in the esports Market report?
While the report offers comprehensive insights, it's advisable to review the specific contents or supplementary materials provided to ascertain if additional resources or data are available.
14. How can I stay updated on further developments or reports in the esports Market?
To stay informed about further developments, trends, and reports in the esports Market, consider subscribing to industry newsletters, following relevant companies and organizations, or regularly checking reputable industry news sources and publications.
Methodology
Step 1 - Identification of Relevant Samples Size from Population Database


Step 2 - Approaches for Defining Global Market Size (Value, Volume* & Price*)

Note*: In applicable scenarios
Step 3 - Data Sources
Primary Research
- Web Analytics
- Survey Reports
- Research Institute
- Latest Research Reports
- Opinion Leaders
Secondary Research
- Annual Reports
- White Paper
- Latest Press Release
- Industry Association
- Paid Database
- Investor Presentations

Step 4 - Data Triangulation
Involves using different sources of information in order to increase the validity of a study
These sources are likely to be stakeholders in a program - participants, other researchers, program staff, other community members, and so on.
Then we put all data in single framework & apply various statistical tools to find out the dynamic on the market.
During the analysis stage, feedback from the stakeholder groups would be compared to determine areas of agreement as well as areas of divergence


