
Key Insights
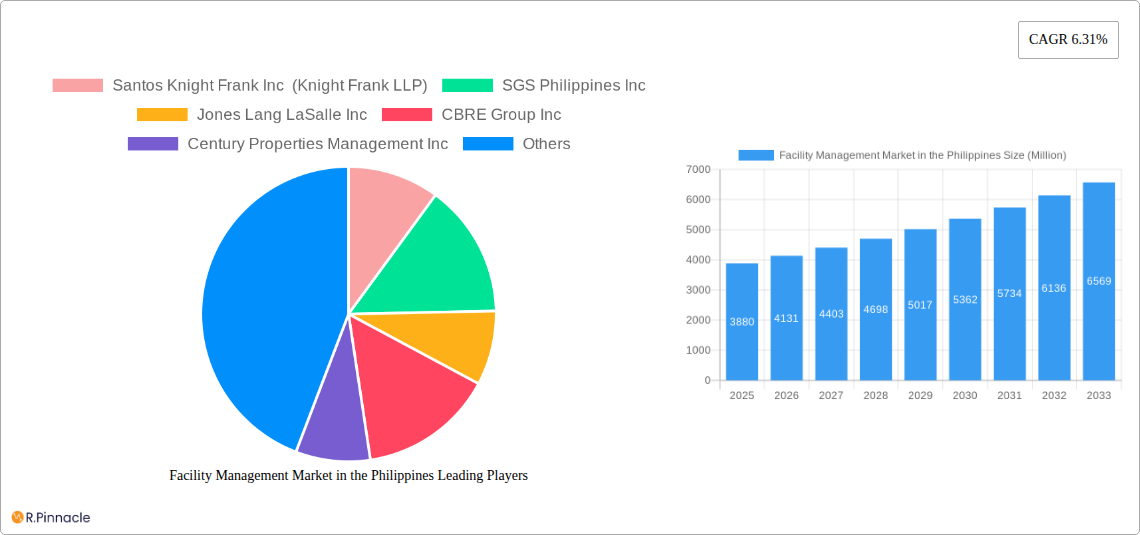
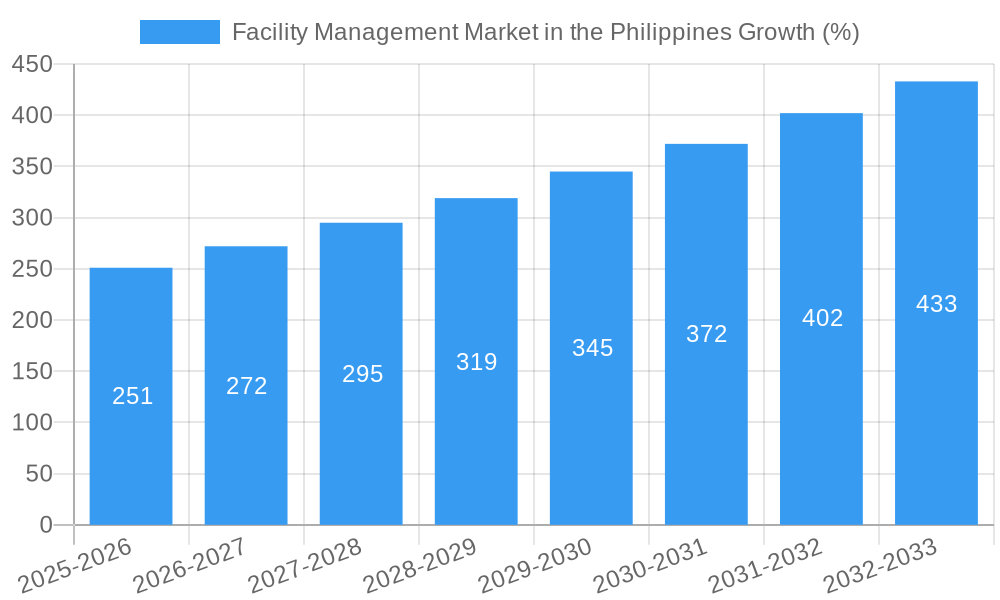
The Philippines' facility management (FM) market, valued at $3.88 billion in 2025, is experiencing robust growth, projected to expand at a compound annual growth rate (CAGR) of 6.31% from 2025 to 2033. This growth is fueled by several key factors. The burgeoning commercial real estate sector, driven by increasing foreign direct investment and a growing middle class, demands sophisticated FM services. Furthermore, a rising awareness of sustainability and operational efficiency is pushing organizations to outsource FM functions, leading to increased demand for both hard (technical) and soft (administrative) services. The significant presence of Business Process Outsourcing (BPO) companies in the Philippines also contributes substantially to the market's expansion, as these firms require extensive FM support for their large office spaces. Growth in the institutional and public/infrastructure sectors further bolsters market expansion. Key players like Santos Knight Frank, CBRE Group, and Jones Lang LaSalle are capitalizing on this growth, offering comprehensive solutions tailored to diverse client needs. Competition is expected to intensify as smaller, specialized FM providers emerge, focusing on niche sectors like sustainable FM practices or specialized technological solutions.
The market segmentation highlights significant opportunities. While outsourced facility management currently holds a larger market share, the in-house segment is expected to see growth due to increasing capabilities within larger organizations. The soft FM segment, encompassing services like cleaning, security, and catering, is experiencing faster growth than hard FM (building maintenance, engineering), reflecting a broader focus on enhancing the employee experience and workplace productivity. The commercial sector currently dominates, but growth is anticipated in the industrial and public/infrastructure sectors due to government initiatives focusing on infrastructure development and modernization. The market's trajectory is expected to be shaped by technological advancements, such as smart building technologies and data analytics in FM operations, coupled with growing demand for integrated and sustainable solutions. Despite potential economic fluctuations, the long-term outlook for the Philippine FM market remains positive.
Facility Management Market in the Philippines: A Comprehensive Report (2019-2033)
This comprehensive report provides a detailed analysis of the Facility Management Market in the Philippines, covering the period 2019-2033. It offers invaluable insights into market dynamics, key players, emerging trends, and future growth opportunities, enabling industry professionals to make informed strategic decisions. The report leverages extensive research, incorporating data from the historical period (2019-2024), the base year (2025), and projects growth until the estimated year (2025) and the forecast period (2025-2033).
Facility Management Market in the Philippines Market Structure & Innovation Trends
The Philippine facility management market exhibits a moderately concentrated structure, with a few large multinational corporations and several local players dominating various segments. Market share is dynamic, with ongoing competition and strategic alliances influencing the landscape. While precise market share figures for each player are proprietary and unavailable for public release, Santos Knight Frank Inc (Knight Frank LLP), SGS Philippines Inc, Jones Lang LaSalle Inc, and CBRE Group Inc are prominent players, commanding significant portions of the market.
Innovation in the Philippine facility management sector is driven by:
- Technological advancements: The integration of smart building technologies, IoT devices, and data analytics for predictive maintenance and optimized resource allocation.
- Sustainability concerns: Growing demand for environmentally friendly solutions, including energy-efficient systems and waste management strategies.
- Regulatory changes: Government initiatives promoting building codes and safety standards influencing market practices.
The market is also influenced by factors like:
- Product substitutes: Limited direct substitutes, but competition exists through alternative service providers offering similar solutions.
- End-user demographics: Shifting preferences towards outsourced facility management, particularly in large commercial and institutional settings.
- M&A activities: Although precise M&A deal values are confidential, recent activity indicates consolidation is a potential trend as larger firms seek to expand their market share.
Facility Management Market in the Philippines Market Dynamics & Trends
The Philippine facility management market is experiencing robust growth, driven by several key factors. The compound annual growth rate (CAGR) during the forecast period (2025-2033) is estimated at xx%. Market penetration is increasing across various sectors, particularly in the commercial real estate sector. Expansion of infrastructure projects, particularly in major cities like Manila, is another key driver. Technological disruptions, such as the adoption of Building Information Modeling (BIM) and facility management software, are boosting efficiency and creating new service offerings.
Consumer preferences are leaning toward integrated facility management solutions that address both hard and soft services, as clients seek optimized cost efficiency and streamlined management. Competitive dynamics involve ongoing competition among both multinational corporations and local players, with pricing, service quality, and technological capabilities as key differentiators.
Dominant Regions & Segments in Facility Management Market in the Philippines
The National Capital Region (NCR) including Manila, remains the dominant region for facility management services due to its high concentration of commercial, institutional, and industrial facilities. Other major cities are also showing significant growth.
Segment Dominance:
- By Type: Outsourced facility management is the dominant segment, fueled by cost-effectiveness and access to specialized expertise. In-house facility management remains relevant for organizations with significant internal resources and specific needs.
- By Offering Type: Both hard and soft facility management services are essential, with a balanced demand depending on the specific needs of end-users.
- By End User: The commercial sector (including offices, retail, and hospitality) constitutes the largest share, followed by the institutional (education, healthcare) and industrial sectors. Public/Infrastructure projects are a significant growth area, as the government undertakes large-scale infrastructure development.
Key Drivers:
- Economic Growth: Sustained economic growth in the Philippines drives investment in infrastructure and commercial real estate, boosting demand for facility management services.
- Infrastructure Development: Government initiatives promoting infrastructure projects are generating significant demand, especially in the public/infrastructure segment.
- Urbanization: Rapid urbanization leads to the construction of new buildings and increased demand for property maintenance.
Facility Management Market in the Philippines Product Innovations
Recent product innovations focus on integrating smart technologies into facility management solutions. This includes using IoT sensors for real-time monitoring, predictive maintenance algorithms, and data analytics dashboards for improved decision-making. These advancements offer competitive advantages in terms of cost optimization, improved efficiency, and enhanced sustainability. The market sees increasing demand for integrated platforms that provide comprehensive facility management capabilities through a single interface.
Report Scope & Segmentation Analysis
This report segments the Philippine facility management market across various parameters:
By Type: In-house facility management and outsourced facility management, with growth projections indicating a faster rate for outsourced services.
By Offering Type: Hard facility management (e.g., maintenance, repairs) and soft facility management (e.g., cleaning, security) show comparable growth, highlighting the demand for integrated services.
By End User: Commercial, institutional, public/infrastructure, industrial, and other end users exhibit varying growth rates based on investment trends and government policies. Market sizes for each segment are detailed within the full report. Competitive dynamics are complex and vary across segments, with both large and specialized firms competing.
Key Drivers of Facility Management Market in the Philippines Growth
Several factors drive the growth of the Philippine facility management market. These include sustained economic growth, investments in infrastructure projects (like the ongoing "Build, Build, Build" program), increasing urbanization leading to higher demand for commercial and residential properties, and a rising preference for outsourced facility management services among businesses. Technological advancements, such as smart building technologies and data analytics, also contribute to market expansion. Finally, stricter building codes and regulations encourage adoption of more efficient and sustainable facility management practices.
Challenges in the Facility Management Market in the Philippines Sector
Challenges include a shortage of skilled labor, particularly in specialized areas like green building technologies. Supply chain disruptions and fluctuations in material costs affect project timelines and budgets. Competitive pressure and price sensitivity from clients can also impact profitability. Finally, navigating regulatory requirements related to safety and environmental compliance adds complexity to operations.
Emerging Opportunities in Facility Management Market in the Philippines
Growth opportunities exist in expanding into underserved regions beyond major cities, targeting smaller businesses, and developing specialized service offerings for niche sectors like healthcare and data centers. The integration of emerging technologies, including AI-powered predictive maintenance and sustainable facility management practices, presents significant opportunities. Moreover, focusing on delivering comprehensive, integrated solutions that address the needs of clients across multiple areas creates competitive differentiation.
Leading Players in the Facility Management Market in the Philippines Market
- Santos Knight Frank Inc (Knight Frank LLP)
- SGS Philippines Inc
- Jones Lang LaSalle Inc
- CBRE Group Inc
- Century Properties Management Inc
- Cushman & Wakefield LLC
- Sodexo Group
- Hydron Corporation
- Meralco Industrial Engineering Services Corporation
- Artelia Group
- Servicio Filipino Inc
- Mansion Maintenance Co Inc
- Kontrac Facilities Management Services Inc
- WeCare Facility Management Services Inc
- Atalian Global Services Philippines Inc
Key Developments in Facility Management Market in the Philippines Industry
- July 2023: The Philippine government bundled the operations and maintenance contracts for MRT Line 3 and LRT Line 2, creating a significant opportunity for facility management firms specializing in large-scale infrastructure projects.
- February 2023: Manila Water's investment in Anflo Industrial Estate's water facilities demonstrates the growing demand for specialized facility management services in industrial sectors.
Future Outlook for Facility Management Market in the Philippines Market
The Philippine facility management market is poised for significant growth, fueled by ongoing infrastructure development, economic expansion, and the increasing adoption of smart building technologies. Strategic opportunities exist for companies focusing on integrated solutions, sustainability, and the development of specialized expertise in emerging sectors. The market's future growth trajectory is directly linked to the country's overall economic progress and continued investment in both public and private infrastructure.
Facility Management Market in the Philippines Segmentation
-
1. Type
- 1.1. In-house Facility Management
-
1.2. Outsourced Facility Management
- 1.2.1. Single Facility Management
- 1.2.2. Bundled Facility Management
- 1.2.3. Integrated Facility Management
-
2. Offering Type
- 2.1. Hard Facility Management
- 2.2. Soft Facility Management
-
3. End-user Industry
- 3.1. Commercial
- 3.2. Institutional
- 3.3. Public/Infrastructure
- 3.4. Industrial
- 3.5. Other End-user Industries
Facility Management Market in the Philippines Segmentation By Geography
-
1. North America
- 1.1. United States
- 1.2. Canada
- 1.3. Mexico
-
2. South America
- 2.1. Brazil
- 2.2. Argentina
- 2.3. Rest of South America
-
3. Europe
- 3.1. United Kingdom
- 3.2. Germany
- 3.3. France
- 3.4. Italy
- 3.5. Spain
- 3.6. Russia
- 3.7. Benelux
- 3.8. Nordics
- 3.9. Rest of Europe
-
4. Middle East & Africa
- 4.1. Turkey
- 4.2. Israel
- 4.3. GCC
- 4.4. North Africa
- 4.5. South Africa
- 4.6. Rest of Middle East & Africa
-
5. Asia Pacific
- 5.1. China
- 5.2. India
- 5.3. Japan
- 5.4. South Korea
- 5.5. ASEAN
- 5.6. Oceania
- 5.7. Rest of Asia Pacific
Facility Management Market in the Philippines REPORT HIGHLIGHTS
| Aspects | Details |
|---|---|
| Study Period | 2019-2033 |
| Base Year | 2024 |
| Estimated Year | 2025 |
| Forecast Period | 2025-2033 |
| Historical Period | 2019-2024 |
| Growth Rate | CAGR of 6.31% from 2019-2033 |
| Segmentation |
|
Table of Contents
- 1. Introduction
- 1.1. Research Scope
- 1.2. Market Segmentation
- 1.3. Research Methodology
- 1.4. Definitions and Assumptions
- 2. Executive Summary
- 2.1. Introduction
- 3. Market Dynamics
- 3.1. Introduction
- 3.2. Market Drivers
- 3.2.1. Growing Demand for Office Space from the BPO Sector; Increasing Investment in Public and Private Infrastructure Development
- 3.3. Market Restrains
- 3.3.1. Lower Awareness of Facility Management Services
- 3.4. Market Trends
- 3.4.1. In-house Facility Management Segment is Expected to Hold Significant Market Share
- 4. Market Factor Analysis
- 4.1. Porters Five Forces
- 4.2. Supply/Value Chain
- 4.3. PESTEL analysis
- 4.4. Market Entropy
- 4.5. Patent/Trademark Analysis
- 5. Global Facility Management Market in the Philippines Analysis, Insights and Forecast, 2019-2031
- 5.1. Market Analysis, Insights and Forecast - by Type
- 5.1.1. In-house Facility Management
- 5.1.2. Outsourced Facility Management
- 5.1.2.1. Single Facility Management
- 5.1.2.2. Bundled Facility Management
- 5.1.2.3. Integrated Facility Management
- 5.2. Market Analysis, Insights and Forecast - by Offering Type
- 5.2.1. Hard Facility Management
- 5.2.2. Soft Facility Management
- 5.3. Market Analysis, Insights and Forecast - by End-user Industry
- 5.3.1. Commercial
- 5.3.2. Institutional
- 5.3.3. Public/Infrastructure
- 5.3.4. Industrial
- 5.3.5. Other End-user Industries
- 5.4. Market Analysis, Insights and Forecast - by Region
- 5.4.1. North America
- 5.4.2. South America
- 5.4.3. Europe
- 5.4.4. Middle East & Africa
- 5.4.5. Asia Pacific
- 5.1. Market Analysis, Insights and Forecast - by Type
- 6. North America Facility Management Market in the Philippines Analysis, Insights and Forecast, 2019-2031
- 6.1. Market Analysis, Insights and Forecast - by Type
- 6.1.1. In-house Facility Management
- 6.1.2. Outsourced Facility Management
- 6.1.2.1. Single Facility Management
- 6.1.2.2. Bundled Facility Management
- 6.1.2.3. Integrated Facility Management
- 6.2. Market Analysis, Insights and Forecast - by Offering Type
- 6.2.1. Hard Facility Management
- 6.2.2. Soft Facility Management
- 6.3. Market Analysis, Insights and Forecast - by End-user Industry
- 6.3.1. Commercial
- 6.3.2. Institutional
- 6.3.3. Public/Infrastructure
- 6.3.4. Industrial
- 6.3.5. Other End-user Industries
- 6.1. Market Analysis, Insights and Forecast - by Type
- 7. South America Facility Management Market in the Philippines Analysis, Insights and Forecast, 2019-2031
- 7.1. Market Analysis, Insights and Forecast - by Type
- 7.1.1. In-house Facility Management
- 7.1.2. Outsourced Facility Management
- 7.1.2.1. Single Facility Management
- 7.1.2.2. Bundled Facility Management
- 7.1.2.3. Integrated Facility Management
- 7.2. Market Analysis, Insights and Forecast - by Offering Type
- 7.2.1. Hard Facility Management
- 7.2.2. Soft Facility Management
- 7.3. Market Analysis, Insights and Forecast - by End-user Industry
- 7.3.1. Commercial
- 7.3.2. Institutional
- 7.3.3. Public/Infrastructure
- 7.3.4. Industrial
- 7.3.5. Other End-user Industries
- 7.1. Market Analysis, Insights and Forecast - by Type
- 8. Europe Facility Management Market in the Philippines Analysis, Insights and Forecast, 2019-2031
- 8.1. Market Analysis, Insights and Forecast - by Type
- 8.1.1. In-house Facility Management
- 8.1.2. Outsourced Facility Management
- 8.1.2.1. Single Facility Management
- 8.1.2.2. Bundled Facility Management
- 8.1.2.3. Integrated Facility Management
- 8.2. Market Analysis, Insights and Forecast - by Offering Type
- 8.2.1. Hard Facility Management
- 8.2.2. Soft Facility Management
- 8.3. Market Analysis, Insights and Forecast - by End-user Industry
- 8.3.1. Commercial
- 8.3.2. Institutional
- 8.3.3. Public/Infrastructure
- 8.3.4. Industrial
- 8.3.5. Other End-user Industries
- 8.1. Market Analysis, Insights and Forecast - by Type
- 9. Middle East & Africa Facility Management Market in the Philippines Analysis, Insights and Forecast, 2019-2031
- 9.1. Market Analysis, Insights and Forecast - by Type
- 9.1.1. In-house Facility Management
- 9.1.2. Outsourced Facility Management
- 9.1.2.1. Single Facility Management
- 9.1.2.2. Bundled Facility Management
- 9.1.2.3. Integrated Facility Management
- 9.2. Market Analysis, Insights and Forecast - by Offering Type
- 9.2.1. Hard Facility Management
- 9.2.2. Soft Facility Management
- 9.3. Market Analysis, Insights and Forecast - by End-user Industry
- 9.3.1. Commercial
- 9.3.2. Institutional
- 9.3.3. Public/Infrastructure
- 9.3.4. Industrial
- 9.3.5. Other End-user Industries
- 9.1. Market Analysis, Insights and Forecast - by Type
- 10. Asia Pacific Facility Management Market in the Philippines Analysis, Insights and Forecast, 2019-2031
- 10.1. Market Analysis, Insights and Forecast - by Type
- 10.1.1. In-house Facility Management
- 10.1.2. Outsourced Facility Management
- 10.1.2.1. Single Facility Management
- 10.1.2.2. Bundled Facility Management
- 10.1.2.3. Integrated Facility Management
- 10.2. Market Analysis, Insights and Forecast - by Offering Type
- 10.2.1. Hard Facility Management
- 10.2.2. Soft Facility Management
- 10.3. Market Analysis, Insights and Forecast - by End-user Industry
- 10.3.1. Commercial
- 10.3.2. Institutional
- 10.3.3. Public/Infrastructure
- 10.3.4. Industrial
- 10.3.5. Other End-user Industries
- 10.1. Market Analysis, Insights and Forecast - by Type
- 11. Competitive Analysis
- 11.1. Global Market Share Analysis 2024
- 11.2. Company Profiles
- 11.2.1 Santos Knight Frank Inc (Knight Frank LLP)
- 11.2.1.1. Overview
- 11.2.1.2. Products
- 11.2.1.3. SWOT Analysis
- 11.2.1.4. Recent Developments
- 11.2.1.5. Financials (Based on Availability)
- 11.2.2 SGS Philippines Inc
- 11.2.2.1. Overview
- 11.2.2.2. Products
- 11.2.2.3. SWOT Analysis
- 11.2.2.4. Recent Developments
- 11.2.2.5. Financials (Based on Availability)
- 11.2.3 Jones Lang LaSalle Inc
- 11.2.3.1. Overview
- 11.2.3.2. Products
- 11.2.3.3. SWOT Analysis
- 11.2.3.4. Recent Developments
- 11.2.3.5. Financials (Based on Availability)
- 11.2.4 CBRE Group Inc
- 11.2.4.1. Overview
- 11.2.4.2. Products
- 11.2.4.3. SWOT Analysis
- 11.2.4.4. Recent Developments
- 11.2.4.5. Financials (Based on Availability)
- 11.2.5 Century Properties Management Inc
- 11.2.5.1. Overview
- 11.2.5.2. Products
- 11.2.5.3. SWOT Analysis
- 11.2.5.4. Recent Developments
- 11.2.5.5. Financials (Based on Availability)
- 11.2.6 Cushman & Wakefield LLC
- 11.2.6.1. Overview
- 11.2.6.2. Products
- 11.2.6.3. SWOT Analysis
- 11.2.6.4. Recent Developments
- 11.2.6.5. Financials (Based on Availability)
- 11.2.7 Sodexo Group
- 11.2.7.1. Overview
- 11.2.7.2. Products
- 11.2.7.3. SWOT Analysis
- 11.2.7.4. Recent Developments
- 11.2.7.5. Financials (Based on Availability)
- 11.2.8 Hydron Corporation
- 11.2.8.1. Overview
- 11.2.8.2. Products
- 11.2.8.3. SWOT Analysis
- 11.2.8.4. Recent Developments
- 11.2.8.5. Financials (Based on Availability)
- 11.2.9 Meralco Industrial Engineering Services Corporation
- 11.2.9.1. Overview
- 11.2.9.2. Products
- 11.2.9.3. SWOT Analysis
- 11.2.9.4. Recent Developments
- 11.2.9.5. Financials (Based on Availability)
- 11.2.10 Artelia Group
- 11.2.10.1. Overview
- 11.2.10.2. Products
- 11.2.10.3. SWOT Analysis
- 11.2.10.4. Recent Developments
- 11.2.10.5. Financials (Based on Availability)
- 11.2.11 Servicio Filipino Inc
- 11.2.11.1. Overview
- 11.2.11.2. Products
- 11.2.11.3. SWOT Analysis
- 11.2.11.4. Recent Developments
- 11.2.11.5. Financials (Based on Availability)
- 11.2.12 Mansion Maintenance Co Inc
- 11.2.12.1. Overview
- 11.2.12.2. Products
- 11.2.12.3. SWOT Analysis
- 11.2.12.4. Recent Developments
- 11.2.12.5. Financials (Based on Availability)
- 11.2.13 Kontrac Facilities Management Services Inc
- 11.2.13.1. Overview
- 11.2.13.2. Products
- 11.2.13.3. SWOT Analysis
- 11.2.13.4. Recent Developments
- 11.2.13.5. Financials (Based on Availability)
- 11.2.14 WeCare Facility Management Services Inc
- 11.2.14.1. Overview
- 11.2.14.2. Products
- 11.2.14.3. SWOT Analysis
- 11.2.14.4. Recent Developments
- 11.2.14.5. Financials (Based on Availability)
- 11.2.15 Atalian Global Services Philippines Inc
- 11.2.15.1. Overview
- 11.2.15.2. Products
- 11.2.15.3. SWOT Analysis
- 11.2.15.4. Recent Developments
- 11.2.15.5. Financials (Based on Availability)
- 11.2.1 Santos Knight Frank Inc (Knight Frank LLP)
List of Figures
- Figure 1: Global Facility Management Market in the Philippines Revenue Breakdown (Million, %) by Region 2024 & 2032
- Figure 2: Global Facility Management Market in the Philippines Volume Breakdown (K Unit, %) by Region 2024 & 2032
- Figure 3: Philippines Facility Management Market in the Philippines Revenue (Million), by Country 2024 & 2032
- Figure 4: Philippines Facility Management Market in the Philippines Volume (K Unit), by Country 2024 & 2032
- Figure 5: Philippines Facility Management Market in the Philippines Revenue Share (%), by Country 2024 & 2032
- Figure 6: Philippines Facility Management Market in the Philippines Volume Share (%), by Country 2024 & 2032
- Figure 7: North America Facility Management Market in the Philippines Revenue (Million), by Type 2024 & 2032
- Figure 8: North America Facility Management Market in the Philippines Volume (K Unit), by Type 2024 & 2032
- Figure 9: North America Facility Management Market in the Philippines Revenue Share (%), by Type 2024 & 2032
- Figure 10: North America Facility Management Market in the Philippines Volume Share (%), by Type 2024 & 2032
- Figure 11: North America Facility Management Market in the Philippines Revenue (Million), by Offering Type 2024 & 2032
- Figure 12: North America Facility Management Market in the Philippines Volume (K Unit), by Offering Type 2024 & 2032
- Figure 13: North America Facility Management Market in the Philippines Revenue Share (%), by Offering Type 2024 & 2032
- Figure 14: North America Facility Management Market in the Philippines Volume Share (%), by Offering Type 2024 & 2032
- Figure 15: North America Facility Management Market in the Philippines Revenue (Million), by End-user Industry 2024 & 2032
- Figure 16: North America Facility Management Market in the Philippines Volume (K Unit), by End-user Industry 2024 & 2032
- Figure 17: North America Facility Management Market in the Philippines Revenue Share (%), by End-user Industry 2024 & 2032
- Figure 18: North America Facility Management Market in the Philippines Volume Share (%), by End-user Industry 2024 & 2032
- Figure 19: North America Facility Management Market in the Philippines Revenue (Million), by Country 2024 & 2032
- Figure 20: North America Facility Management Market in the Philippines Volume (K Unit), by Country 2024 & 2032
- Figure 21: North America Facility Management Market in the Philippines Revenue Share (%), by Country 2024 & 2032
- Figure 22: North America Facility Management Market in the Philippines Volume Share (%), by Country 2024 & 2032
- Figure 23: South America Facility Management Market in the Philippines Revenue (Million), by Type 2024 & 2032
- Figure 24: South America Facility Management Market in the Philippines Volume (K Unit), by Type 2024 & 2032
- Figure 25: South America Facility Management Market in the Philippines Revenue Share (%), by Type 2024 & 2032
- Figure 26: South America Facility Management Market in the Philippines Volume Share (%), by Type 2024 & 2032
- Figure 27: South America Facility Management Market in the Philippines Revenue (Million), by Offering Type 2024 & 2032
- Figure 28: South America Facility Management Market in the Philippines Volume (K Unit), by Offering Type 2024 & 2032
- Figure 29: South America Facility Management Market in the Philippines Revenue Share (%), by Offering Type 2024 & 2032
- Figure 30: South America Facility Management Market in the Philippines Volume Share (%), by Offering Type 2024 & 2032
- Figure 31: South America Facility Management Market in the Philippines Revenue (Million), by End-user Industry 2024 & 2032
- Figure 32: South America Facility Management Market in the Philippines Volume (K Unit), by End-user Industry 2024 & 2032
- Figure 33: South America Facility Management Market in the Philippines Revenue Share (%), by End-user Industry 2024 & 2032
- Figure 34: South America Facility Management Market in the Philippines Volume Share (%), by End-user Industry 2024 & 2032
- Figure 35: South America Facility Management Market in the Philippines Revenue (Million), by Country 2024 & 2032
- Figure 36: South America Facility Management Market in the Philippines Volume (K Unit), by Country 2024 & 2032
- Figure 37: South America Facility Management Market in the Philippines Revenue Share (%), by Country 2024 & 2032
- Figure 38: South America Facility Management Market in the Philippines Volume Share (%), by Country 2024 & 2032
- Figure 39: Europe Facility Management Market in the Philippines Revenue (Million), by Type 2024 & 2032
- Figure 40: Europe Facility Management Market in the Philippines Volume (K Unit), by Type 2024 & 2032
- Figure 41: Europe Facility Management Market in the Philippines Revenue Share (%), by Type 2024 & 2032
- Figure 42: Europe Facility Management Market in the Philippines Volume Share (%), by Type 2024 & 2032
- Figure 43: Europe Facility Management Market in the Philippines Revenue (Million), by Offering Type 2024 & 2032
- Figure 44: Europe Facility Management Market in the Philippines Volume (K Unit), by Offering Type 2024 & 2032
- Figure 45: Europe Facility Management Market in the Philippines Revenue Share (%), by Offering Type 2024 & 2032
- Figure 46: Europe Facility Management Market in the Philippines Volume Share (%), by Offering Type 2024 & 2032
- Figure 47: Europe Facility Management Market in the Philippines Revenue (Million), by End-user Industry 2024 & 2032
- Figure 48: Europe Facility Management Market in the Philippines Volume (K Unit), by End-user Industry 2024 & 2032
- Figure 49: Europe Facility Management Market in the Philippines Revenue Share (%), by End-user Industry 2024 & 2032
- Figure 50: Europe Facility Management Market in the Philippines Volume Share (%), by End-user Industry 2024 & 2032
- Figure 51: Europe Facility Management Market in the Philippines Revenue (Million), by Country 2024 & 2032
- Figure 52: Europe Facility Management Market in the Philippines Volume (K Unit), by Country 2024 & 2032
- Figure 53: Europe Facility Management Market in the Philippines Revenue Share (%), by Country 2024 & 2032
- Figure 54: Europe Facility Management Market in the Philippines Volume Share (%), by Country 2024 & 2032
- Figure 55: Middle East & Africa Facility Management Market in the Philippines Revenue (Million), by Type 2024 & 2032
- Figure 56: Middle East & Africa Facility Management Market in the Philippines Volume (K Unit), by Type 2024 & 2032
- Figure 57: Middle East & Africa Facility Management Market in the Philippines Revenue Share (%), by Type 2024 & 2032
- Figure 58: Middle East & Africa Facility Management Market in the Philippines Volume Share (%), by Type 2024 & 2032
- Figure 59: Middle East & Africa Facility Management Market in the Philippines Revenue (Million), by Offering Type 2024 & 2032
- Figure 60: Middle East & Africa Facility Management Market in the Philippines Volume (K Unit), by Offering Type 2024 & 2032
- Figure 61: Middle East & Africa Facility Management Market in the Philippines Revenue Share (%), by Offering Type 2024 & 2032
- Figure 62: Middle East & Africa Facility Management Market in the Philippines Volume Share (%), by Offering Type 2024 & 2032
- Figure 63: Middle East & Africa Facility Management Market in the Philippines Revenue (Million), by End-user Industry 2024 & 2032
- Figure 64: Middle East & Africa Facility Management Market in the Philippines Volume (K Unit), by End-user Industry 2024 & 2032
- Figure 65: Middle East & Africa Facility Management Market in the Philippines Revenue Share (%), by End-user Industry 2024 & 2032
- Figure 66: Middle East & Africa Facility Management Market in the Philippines Volume Share (%), by End-user Industry 2024 & 2032
- Figure 67: Middle East & Africa Facility Management Market in the Philippines Revenue (Million), by Country 2024 & 2032
- Figure 68: Middle East & Africa Facility Management Market in the Philippines Volume (K Unit), by Country 2024 & 2032
- Figure 69: Middle East & Africa Facility Management Market in the Philippines Revenue Share (%), by Country 2024 & 2032
- Figure 70: Middle East & Africa Facility Management Market in the Philippines Volume Share (%), by Country 2024 & 2032
- Figure 71: Asia Pacific Facility Management Market in the Philippines Revenue (Million), by Type 2024 & 2032
- Figure 72: Asia Pacific Facility Management Market in the Philippines Volume (K Unit), by Type 2024 & 2032
- Figure 73: Asia Pacific Facility Management Market in the Philippines Revenue Share (%), by Type 2024 & 2032
- Figure 74: Asia Pacific Facility Management Market in the Philippines Volume Share (%), by Type 2024 & 2032
- Figure 75: Asia Pacific Facility Management Market in the Philippines Revenue (Million), by Offering Type 2024 & 2032
- Figure 76: Asia Pacific Facility Management Market in the Philippines Volume (K Unit), by Offering Type 2024 & 2032
- Figure 77: Asia Pacific Facility Management Market in the Philippines Revenue Share (%), by Offering Type 2024 & 2032
- Figure 78: Asia Pacific Facility Management Market in the Philippines Volume Share (%), by Offering Type 2024 & 2032
- Figure 79: Asia Pacific Facility Management Market in the Philippines Revenue (Million), by End-user Industry 2024 & 2032
- Figure 80: Asia Pacific Facility Management Market in the Philippines Volume (K Unit), by End-user Industry 2024 & 2032
- Figure 81: Asia Pacific Facility Management Market in the Philippines Revenue Share (%), by End-user Industry 2024 & 2032
- Figure 82: Asia Pacific Facility Management Market in the Philippines Volume Share (%), by End-user Industry 2024 & 2032
- Figure 83: Asia Pacific Facility Management Market in the Philippines Revenue (Million), by Country 2024 & 2032
- Figure 84: Asia Pacific Facility Management Market in the Philippines Volume (K Unit), by Country 2024 & 2032
- Figure 85: Asia Pacific Facility Management Market in the Philippines Revenue Share (%), by Country 2024 & 2032
- Figure 86: Asia Pacific Facility Management Market in the Philippines Volume Share (%), by Country 2024 & 2032
List of Tables
- Table 1: Global Facility Management Market in the Philippines Revenue Million Forecast, by Region 2019 & 2032
- Table 2: Global Facility Management Market in the Philippines Volume K Unit Forecast, by Region 2019 & 2032
- Table 3: Global Facility Management Market in the Philippines Revenue Million Forecast, by Type 2019 & 2032
- Table 4: Global Facility Management Market in the Philippines Volume K Unit Forecast, by Type 2019 & 2032
- Table 5: Global Facility Management Market in the Philippines Revenue Million Forecast, by Offering Type 2019 & 2032
- Table 6: Global Facility Management Market in the Philippines Volume K Unit Forecast, by Offering Type 2019 & 2032
- Table 7: Global Facility Management Market in the Philippines Revenue Million Forecast, by End-user Industry 2019 & 2032
- Table 8: Global Facility Management Market in the Philippines Volume K Unit Forecast, by End-user Industry 2019 & 2032
- Table 9: Global Facility Management Market in the Philippines Revenue Million Forecast, by Region 2019 & 2032
- Table 10: Global Facility Management Market in the Philippines Volume K Unit Forecast, by Region 2019 & 2032
- Table 11: Global Facility Management Market in the Philippines Revenue Million Forecast, by Country 2019 & 2032
- Table 12: Global Facility Management Market in the Philippines Volume K Unit Forecast, by Country 2019 & 2032
- Table 13: Global Facility Management Market in the Philippines Revenue Million Forecast, by Type 2019 & 2032
- Table 14: Global Facility Management Market in the Philippines Volume K Unit Forecast, by Type 2019 & 2032
- Table 15: Global Facility Management Market in the Philippines Revenue Million Forecast, by Offering Type 2019 & 2032
- Table 16: Global Facility Management Market in the Philippines Volume K Unit Forecast, by Offering Type 2019 & 2032
- Table 17: Global Facility Management Market in the Philippines Revenue Million Forecast, by End-user Industry 2019 & 2032
- Table 18: Global Facility Management Market in the Philippines Volume K Unit Forecast, by End-user Industry 2019 & 2032
- Table 19: Global Facility Management Market in the Philippines Revenue Million Forecast, by Country 2019 & 2032
- Table 20: Global Facility Management Market in the Philippines Volume K Unit Forecast, by Country 2019 & 2032
- Table 21: United States Facility Management Market in the Philippines Revenue (Million) Forecast, by Application 2019 & 2032
- Table 22: United States Facility Management Market in the Philippines Volume (K Unit) Forecast, by Application 2019 & 2032
- Table 23: Canada Facility Management Market in the Philippines Revenue (Million) Forecast, by Application 2019 & 2032
- Table 24: Canada Facility Management Market in the Philippines Volume (K Unit) Forecast, by Application 2019 & 2032
- Table 25: Mexico Facility Management Market in the Philippines Revenue (Million) Forecast, by Application 2019 & 2032
- Table 26: Mexico Facility Management Market in the Philippines Volume (K Unit) Forecast, by Application 2019 & 2032
- Table 27: Global Facility Management Market in the Philippines Revenue Million Forecast, by Type 2019 & 2032
- Table 28: Global Facility Management Market in the Philippines Volume K Unit Forecast, by Type 2019 & 2032
- Table 29: Global Facility Management Market in the Philippines Revenue Million Forecast, by Offering Type 2019 & 2032
- Table 30: Global Facility Management Market in the Philippines Volume K Unit Forecast, by Offering Type 2019 & 2032
- Table 31: Global Facility Management Market in the Philippines Revenue Million Forecast, by End-user Industry 2019 & 2032
- Table 32: Global Facility Management Market in the Philippines Volume K Unit Forecast, by End-user Industry 2019 & 2032
- Table 33: Global Facility Management Market in the Philippines Revenue Million Forecast, by Country 2019 & 2032
- Table 34: Global Facility Management Market in the Philippines Volume K Unit Forecast, by Country 2019 & 2032
- Table 35: Brazil Facility Management Market in the Philippines Revenue (Million) Forecast, by Application 2019 & 2032
- Table 36: Brazil Facility Management Market in the Philippines Volume (K Unit) Forecast, by Application 2019 & 2032
- Table 37: Argentina Facility Management Market in the Philippines Revenue (Million) Forecast, by Application 2019 & 2032
- Table 38: Argentina Facility Management Market in the Philippines Volume (K Unit) Forecast, by Application 2019 & 2032
- Table 39: Rest of South America Facility Management Market in the Philippines Revenue (Million) Forecast, by Application 2019 & 2032
- Table 40: Rest of South America Facility Management Market in the Philippines Volume (K Unit) Forecast, by Application 2019 & 2032
- Table 41: Global Facility Management Market in the Philippines Revenue Million Forecast, by Type 2019 & 2032
- Table 42: Global Facility Management Market in the Philippines Volume K Unit Forecast, by Type 2019 & 2032
- Table 43: Global Facility Management Market in the Philippines Revenue Million Forecast, by Offering Type 2019 & 2032
- Table 44: Global Facility Management Market in the Philippines Volume K Unit Forecast, by Offering Type 2019 & 2032
- Table 45: Global Facility Management Market in the Philippines Revenue Million Forecast, by End-user Industry 2019 & 2032
- Table 46: Global Facility Management Market in the Philippines Volume K Unit Forecast, by End-user Industry 2019 & 2032
- Table 47: Global Facility Management Market in the Philippines Revenue Million Forecast, by Country 2019 & 2032
- Table 48: Global Facility Management Market in the Philippines Volume K Unit Forecast, by Country 2019 & 2032
- Table 49: United Kingdom Facility Management Market in the Philippines Revenue (Million) Forecast, by Application 2019 & 2032
- Table 50: United Kingdom Facility Management Market in the Philippines Volume (K Unit) Forecast, by Application 2019 & 2032
- Table 51: Germany Facility Management Market in the Philippines Revenue (Million) Forecast, by Application 2019 & 2032
- Table 52: Germany Facility Management Market in the Philippines Volume (K Unit) Forecast, by Application 2019 & 2032
- Table 53: France Facility Management Market in the Philippines Revenue (Million) Forecast, by Application 2019 & 2032
- Table 54: France Facility Management Market in the Philippines Volume (K Unit) Forecast, by Application 2019 & 2032
- Table 55: Italy Facility Management Market in the Philippines Revenue (Million) Forecast, by Application 2019 & 2032
- Table 56: Italy Facility Management Market in the Philippines Volume (K Unit) Forecast, by Application 2019 & 2032
- Table 57: Spain Facility Management Market in the Philippines Revenue (Million) Forecast, by Application 2019 & 2032
- Table 58: Spain Facility Management Market in the Philippines Volume (K Unit) Forecast, by Application 2019 & 2032
- Table 59: Russia Facility Management Market in the Philippines Revenue (Million) Forecast, by Application 2019 & 2032
- Table 60: Russia Facility Management Market in the Philippines Volume (K Unit) Forecast, by Application 2019 & 2032
- Table 61: Benelux Facility Management Market in the Philippines Revenue (Million) Forecast, by Application 2019 & 2032
- Table 62: Benelux Facility Management Market in the Philippines Volume (K Unit) Forecast, by Application 2019 & 2032
- Table 63: Nordics Facility Management Market in the Philippines Revenue (Million) Forecast, by Application 2019 & 2032
- Table 64: Nordics Facility Management Market in the Philippines Volume (K Unit) Forecast, by Application 2019 & 2032
- Table 65: Rest of Europe Facility Management Market in the Philippines Revenue (Million) Forecast, by Application 2019 & 2032
- Table 66: Rest of Europe Facility Management Market in the Philippines Volume (K Unit) Forecast, by Application 2019 & 2032
- Table 67: Global Facility Management Market in the Philippines Revenue Million Forecast, by Type 2019 & 2032
- Table 68: Global Facility Management Market in the Philippines Volume K Unit Forecast, by Type 2019 & 2032
- Table 69: Global Facility Management Market in the Philippines Revenue Million Forecast, by Offering Type 2019 & 2032
- Table 70: Global Facility Management Market in the Philippines Volume K Unit Forecast, by Offering Type 2019 & 2032
- Table 71: Global Facility Management Market in the Philippines Revenue Million Forecast, by End-user Industry 2019 & 2032
- Table 72: Global Facility Management Market in the Philippines Volume K Unit Forecast, by End-user Industry 2019 & 2032
- Table 73: Global Facility Management Market in the Philippines Revenue Million Forecast, by Country 2019 & 2032
- Table 74: Global Facility Management Market in the Philippines Volume K Unit Forecast, by Country 2019 & 2032
- Table 75: Turkey Facility Management Market in the Philippines Revenue (Million) Forecast, by Application 2019 & 2032
- Table 76: Turkey Facility Management Market in the Philippines Volume (K Unit) Forecast, by Application 2019 & 2032
- Table 77: Israel Facility Management Market in the Philippines Revenue (Million) Forecast, by Application 2019 & 2032
- Table 78: Israel Facility Management Market in the Philippines Volume (K Unit) Forecast, by Application 2019 & 2032
- Table 79: GCC Facility Management Market in the Philippines Revenue (Million) Forecast, by Application 2019 & 2032
- Table 80: GCC Facility Management Market in the Philippines Volume (K Unit) Forecast, by Application 2019 & 2032
- Table 81: North Africa Facility Management Market in the Philippines Revenue (Million) Forecast, by Application 2019 & 2032
- Table 82: North Africa Facility Management Market in the Philippines Volume (K Unit) Forecast, by Application 2019 & 2032
- Table 83: South Africa Facility Management Market in the Philippines Revenue (Million) Forecast, by Application 2019 & 2032
- Table 84: South Africa Facility Management Market in the Philippines Volume (K Unit) Forecast, by Application 2019 & 2032
- Table 85: Rest of Middle East & Africa Facility Management Market in the Philippines Revenue (Million) Forecast, by Application 2019 & 2032
- Table 86: Rest of Middle East & Africa Facility Management Market in the Philippines Volume (K Unit) Forecast, by Application 2019 & 2032
- Table 87: Global Facility Management Market in the Philippines Revenue Million Forecast, by Type 2019 & 2032
- Table 88: Global Facility Management Market in the Philippines Volume K Unit Forecast, by Type 2019 & 2032
- Table 89: Global Facility Management Market in the Philippines Revenue Million Forecast, by Offering Type 2019 & 2032
- Table 90: Global Facility Management Market in the Philippines Volume K Unit Forecast, by Offering Type 2019 & 2032
- Table 91: Global Facility Management Market in the Philippines Revenue Million Forecast, by End-user Industry 2019 & 2032
- Table 92: Global Facility Management Market in the Philippines Volume K Unit Forecast, by End-user Industry 2019 & 2032
- Table 93: Global Facility Management Market in the Philippines Revenue Million Forecast, by Country 2019 & 2032
- Table 94: Global Facility Management Market in the Philippines Volume K Unit Forecast, by Country 2019 & 2032
- Table 95: China Facility Management Market in the Philippines Revenue (Million) Forecast, by Application 2019 & 2032
- Table 96: China Facility Management Market in the Philippines Volume (K Unit) Forecast, by Application 2019 & 2032
- Table 97: India Facility Management Market in the Philippines Revenue (Million) Forecast, by Application 2019 & 2032
- Table 98: India Facility Management Market in the Philippines Volume (K Unit) Forecast, by Application 2019 & 2032
- Table 99: Japan Facility Management Market in the Philippines Revenue (Million) Forecast, by Application 2019 & 2032
- Table 100: Japan Facility Management Market in the Philippines Volume (K Unit) Forecast, by Application 2019 & 2032
- Table 101: South Korea Facility Management Market in the Philippines Revenue (Million) Forecast, by Application 2019 & 2032
- Table 102: South Korea Facility Management Market in the Philippines Volume (K Unit) Forecast, by Application 2019 & 2032
- Table 103: ASEAN Facility Management Market in the Philippines Revenue (Million) Forecast, by Application 2019 & 2032
- Table 104: ASEAN Facility Management Market in the Philippines Volume (K Unit) Forecast, by Application 2019 & 2032
- Table 105: Oceania Facility Management Market in the Philippines Revenue (Million) Forecast, by Application 2019 & 2032
- Table 106: Oceania Facility Management Market in the Philippines Volume (K Unit) Forecast, by Application 2019 & 2032
- Table 107: Rest of Asia Pacific Facility Management Market in the Philippines Revenue (Million) Forecast, by Application 2019 & 2032
- Table 108: Rest of Asia Pacific Facility Management Market in the Philippines Volume (K Unit) Forecast, by Application 2019 & 2032
Frequently Asked Questions
1. What is the projected Compound Annual Growth Rate (CAGR) of the Facility Management Market in the Philippines?
The projected CAGR is approximately 6.31%.
2. Which companies are prominent players in the Facility Management Market in the Philippines?
Key companies in the market include Santos Knight Frank Inc (Knight Frank LLP), SGS Philippines Inc, Jones Lang LaSalle Inc, CBRE Group Inc, Century Properties Management Inc, Cushman & Wakefield LLC, Sodexo Group, Hydron Corporation, Meralco Industrial Engineering Services Corporation, Artelia Group, Servicio Filipino Inc, Mansion Maintenance Co Inc, Kontrac Facilities Management Services Inc, WeCare Facility Management Services Inc, Atalian Global Services Philippines Inc.
3. What are the main segments of the Facility Management Market in the Philippines?
The market segments include Type, Offering Type, End-user Industry.
4. Can you provide details about the market size?
The market size is estimated to be USD 3.88 Million as of 2022.
5. What are some drivers contributing to market growth?
Growing Demand for Office Space from the BPO Sector; Increasing Investment in Public and Private Infrastructure Development.
6. What are the notable trends driving market growth?
In-house Facility Management Segment is Expected to Hold Significant Market Share.
7. Are there any restraints impacting market growth?
Lower Awareness of Facility Management Services.
8. Can you provide examples of recent developments in the market?
July 2023: The government of the Philippines bid out the operations and maintenance (O&M) contracts of the Metro Rail Transit (MRT) Line 3 and the Light Rail Transit (LRT) Line 2 as a "bundle." The Department of Transportation (DOTr) announced the bundling of the two contracts. Bundling up the two O&M contracts would require the MRT-3 Management, the current operator of the train line, to be transferred to the Light Rail.
9. What pricing options are available for accessing the report?
Pricing options include single-user, multi-user, and enterprise licenses priced at USD 3800, USD 4500, and USD 5800 respectively.
10. Is the market size provided in terms of value or volume?
The market size is provided in terms of value, measured in Million and volume, measured in K Unit.
11. Are there any specific market keywords associated with the report?
Yes, the market keyword associated with the report is "Facility Management Market in the Philippines," which aids in identifying and referencing the specific market segment covered.
12. How do I determine which pricing option suits my needs best?
The pricing options vary based on user requirements and access needs. Individual users may opt for single-user licenses, while businesses requiring broader access may choose multi-user or enterprise licenses for cost-effective access to the report.
13. Are there any additional resources or data provided in the Facility Management Market in the Philippines report?
While the report offers comprehensive insights, it's advisable to review the specific contents or supplementary materials provided to ascertain if additional resources or data are available.
14. How can I stay updated on further developments or reports in the Facility Management Market in the Philippines?
To stay informed about further developments, trends, and reports in the Facility Management Market in the Philippines, consider subscribing to industry newsletters, following relevant companies and organizations, or regularly checking reputable industry news sources and publications.
Methodology
Step 1 - Identification of Relevant Samples Size from Population Database


Step 2 - Approaches for Defining Global Market Size (Value, Volume* & Price*)

Note*: In applicable scenarios
Step 3 - Data Sources
Primary Research
- Web Analytics
- Survey Reports
- Research Institute
- Latest Research Reports
- Opinion Leaders
Secondary Research
- Annual Reports
- White Paper
- Latest Press Release
- Industry Association
- Paid Database
- Investor Presentations

Step 4 - Data Triangulation
Involves using different sources of information in order to increase the validity of a study
These sources are likely to be stakeholders in a program - participants, other researchers, program staff, other community members, and so on.
Then we put all data in single framework & apply various statistical tools to find out the dynamic on the market.
During the analysis stage, feedback from the stakeholder groups would be compared to determine areas of agreement as well as areas of divergence


