
Key Insights
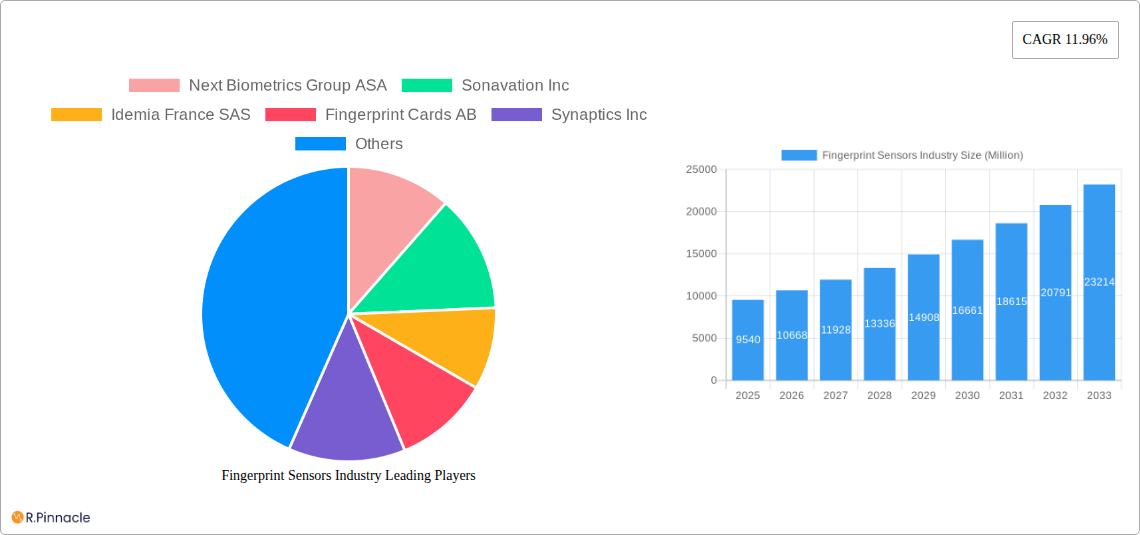
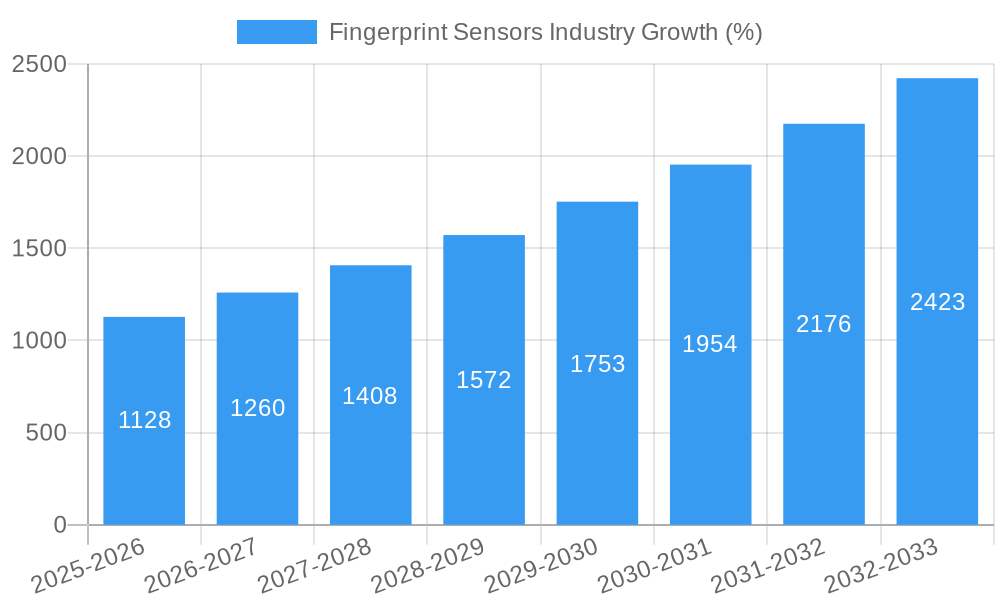
The global fingerprint sensor market, valued at $9.54 billion in 2025, is projected to experience robust growth, driven by the increasing adoption of biometric authentication across diverse applications. A Compound Annual Growth Rate (CAGR) of 11.96% from 2025 to 2033 indicates a significant expansion of this market, fueled by several key factors. The surging demand for secure access in smartphones and tablets remains a primary driver, complemented by the growing penetration of fingerprint sensors in laptops, smartcards, and the burgeoning Internet of Things (IoT) ecosystem. Advancements in sensor technology, such as improved accuracy and speed, alongside decreasing production costs, are further propelling market expansion. Government initiatives promoting digital identity and security are also contributing positively. However, challenges remain, including concerns regarding data privacy and security vulnerabilities, along with the potential for spoofing and limitations in performance under specific conditions (e.g., wet or dry fingers). The market segmentation reveals significant potential within the consumer electronics and BFSI (Banking, Financial Services, and Insurance) sectors, while regional growth is expected to be particularly strong in Asia, driven by expanding smartphone adoption and growing digital infrastructure in emerging economies.
The market is segmented by application (smartphones/tablets, laptops, smartcards, IoT, and other applications), end-user industries (military and defense, consumer electronics, BFSI, government, and others), and sensor type (optical, capacitive, thermal, and ultrasonic). Capacitive sensors currently dominate the market share due to their cost-effectiveness and widespread adoption. However, optical and ultrasonic technologies are gaining traction due to their improved performance characteristics and ability to overcome limitations of capacitive sensors. The competitive landscape is characterized by a mix of established players and emerging companies, reflecting innovation and competition in this dynamic market. Strategic partnerships, mergers, and acquisitions are expected to further shape the industry landscape in the coming years. The forecast period (2025-2033) promises continued growth, with the market poised to capitalize on ongoing technological advancements and increasing demand across various sectors. The long-term prospects for fingerprint sensor technology remain positive, given its crucial role in enhancing security and authentication in an increasingly digital world.
Fingerprint Sensors Industry Market Report: 2019-2033
This comprehensive report provides an in-depth analysis of the Fingerprint Sensors Industry, offering valuable insights for industry professionals, investors, and strategic decision-makers. Covering the period from 2019 to 2033, with a focus on 2025, this report meticulously examines market dynamics, technological advancements, and competitive landscapes to offer a clear picture of future growth potential. The report leverages extensive data analysis and expert insights to provide actionable strategies for navigating this rapidly evolving market.
Fingerprint Sensors Industry Market Structure & Innovation Trends
This section analyzes the competitive landscape of the fingerprint sensor market, encompassing market concentration, innovation drivers, regulatory frameworks, product substitutes, end-user demographics, and merger & acquisition (M&A) activities. The global fingerprint sensors market is characterized by a moderately concentrated structure, with key players holding significant market share. For example, the top 5 companies in 2024 held approximately xx% of the market share, representing a collective market value of $xx Million. However, the market is also witnessing the entry of several innovative startups, increasing competition.
- Market Concentration: High, with top players controlling a significant portion of the market.
- Innovation Drivers: Miniaturization, improved accuracy, enhanced security features, and integration with other technologies.
- Regulatory Frameworks: Data privacy regulations are significantly impacting the market, driving demand for secure and compliant solutions.
- Product Substitutes: Facial recognition, iris scanning, and other biometric technologies represent potential substitutes.
- End-User Demographics: The increasing adoption of smartphones, laptops, and IoT devices is driving market growth across various demographics.
- M&A Activities: The industry has witnessed several M&A activities in recent years, with deal values totaling $xx Million in 2024. These acquisitions have largely focused on enhancing technological capabilities and expanding market reach.
Fingerprint Sensors Industry Market Dynamics & Trends
The fingerprint sensors market is experiencing significant growth driven by the increasing demand for secure authentication in various applications. The market is projected to grow at a Compound Annual Growth Rate (CAGR) of xx% during the forecast period (2025-2033), reaching a market value of $xx Million by 2033. This growth is fueled by factors such as rising smartphone penetration, increasing adoption of biometric authentication in various sectors (BFSI, Government, etc.), and the ongoing development of advanced fingerprint sensor technologies. The market penetration of fingerprint sensors in smartphones is expected to reach xx% by 2033, compared to xx% in 2024. Technological disruptions, such as the development of in-display fingerprint sensors and 3D fingerprint scanners, are further fueling market expansion. Consumer preferences for secure and convenient authentication methods are also significantly impacting market growth. Competitive dynamics are characterized by continuous innovation, strategic partnerships, and product differentiation.
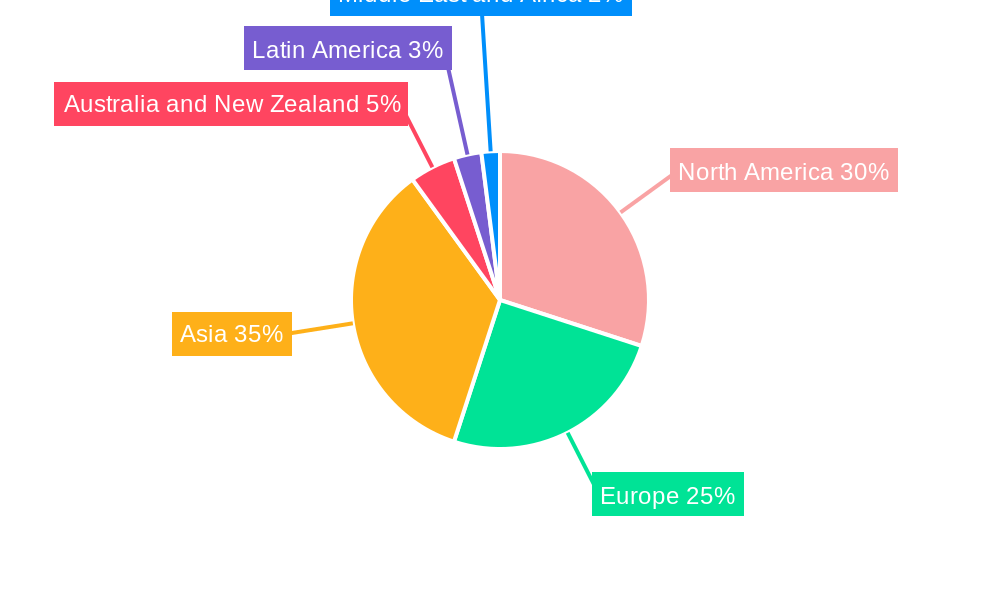
Dominant Regions & Segments in Fingerprint Sensors Industry
This section identifies the leading regions, countries, and segments within the fingerprint sensor market. Asia-Pacific is currently the dominant region, driven by high smartphone adoption and the presence of major manufacturers.
By Application:
- Smartphones/Tablets: This segment holds the largest market share, driven by the increasing demand for secure mobile devices.
- Laptops: Growing adoption of biometric authentication in laptops is fueling growth in this segment.
- Smartcards: This segment is experiencing steady growth due to increasing security concerns in financial transactions and access control.
- IoT and Other Applications: The expanding Internet of Things (IoT) market is driving demand for fingerprint sensors in various applications such as smart home devices and access control systems.
By End-user Industries:
- Consumer Electronics: This is the largest end-user segment, due to the high penetration of smartphones and other consumer electronic devices.
- BFSI (Banking, Financial Services, and Insurance): The BFSI sector is increasingly adopting fingerprint sensors for secure authentication in financial transactions.
- Government: Government agencies are employing fingerprint sensors for identity verification and security purposes.
- Military and Defense: The military and defense sector is utilizing fingerprint sensors for secure access control and identification.
By Type:
- Capacitive: This is the most widely used technology, offering a balance between cost and performance.
- Optical: Optical sensors offer high accuracy and are becoming increasingly popular.
- Ultrasonic: Ultrasonic sensors are gaining traction due to their ability to work through various materials.
- Thermal: This technology is less prevalent compared to others due to certain limitations.
Key drivers for regional dominance include robust economic growth, favorable government policies promoting technological advancements, and the establishment of a well-developed infrastructure.
Fingerprint Sensors Industry Product Innovations
Recent innovations in fingerprint sensors include advancements in in-display fingerprint technology, improved image processing algorithms for enhanced accuracy, and the development of 3D fingerprint scanners that offer increased security. These advancements are improving the user experience, enhancing security features, and enabling integration into a wider range of applications. The market is witnessing a shift towards more secure and user-friendly solutions, leading to the development of multi-modal biometric systems that combine fingerprint sensors with other authentication technologies.
Report Scope & Segmentation Analysis
This report provides a detailed analysis of the fingerprint sensors market across various segments:
By Application: Smartphones/Tablets, Laptops, Smartcards, IoT and Other Applications. Each segment's growth projection, market size, and competitive dynamics are analyzed. Smartphones/Tablets dominate, followed by IoT applications which are rapidly expanding.
By End-user Industries: Military and Defense, Consumer Electronics, BFSI, Government, Other End-user Industries. This segmentation explores market size and growth potential within each sector, highlighting the dominant consumer electronics sector.
By Type: Optical, Capacitive, Thermal, Ultrasonic. This section analyzes the market share and growth prospects of different sensor types. Capacitive sensors currently hold the largest share, while optical and ultrasonic technologies are showing significant growth.
Key Drivers of Fingerprint Sensors Industry Growth
The fingerprint sensors market is experiencing robust growth driven by several key factors: the increasing adoption of smartphones and other mobile devices; the rising demand for secure authentication in various sectors, including BFSI and government; advancements in sensor technology leading to improved accuracy, reliability, and user experience; and supportive government regulations and initiatives promoting the use of biometric technologies. The rising concerns over data security and privacy further bolster market growth.
Challenges in the Fingerprint Sensors Industry Sector
The fingerprint sensors industry faces challenges such as the high cost of advanced sensor technologies, stringent regulatory requirements regarding data privacy and security, and potential supply chain disruptions. Furthermore, the industry is experiencing intense competition from other biometric technologies, such as facial recognition and iris scanning, which presents a significant challenge to market growth. Counterfeit fingerprint issues also pose a threat to the sector's expansion.
Emerging Opportunities in Fingerprint Sensors Industry
Emerging opportunities include the expansion into new applications such as automotive, healthcare, and access control systems; the development of more advanced sensor technologies such as 3D fingerprint scanners and in-display fingerprint sensors; and the integration of fingerprint sensors with other biometric technologies to create more secure and reliable authentication solutions. The growing adoption of the Internet of Things (IoT) also presents significant opportunities for the industry.
Leading Players in the Fingerprint Sensors Industry Market
- Next Biometrics Group ASA
- Sonavation Inc
- Idemia France SAS
- Fingerprint Cards AB
- Synaptics Inc
- Qualcomm Technologies Inc
- NEC Corporation
- Thales Group (Gemalto NV)
- TDK Corporation
- Shenzhen Goodix Technology Co Ltd
- Idex Biometrics ASA
- Vkansee Technology Inc
- Crucialtec Co Ltd
- Egis Technology Inc
Key Developments in Fingerprint Sensors Industry
September 2023: Mastercard launched an in-car payment partnership with Mercedes, enabling fingerprint-based payments at German service stations. This partnership significantly expands the application of fingerprint sensors in the automotive sector, highlighting the market’s expansion beyond traditional mobile devices.
May 2023: Samsung Display unveiled a Sensor OLED Display with an embedded light-sensing organic photodiode, eliminating the need for separate sensor modules. This innovation signifies a major step towards more seamless and aesthetically pleasing integration of fingerprint sensors into mobile devices.
Future Outlook for Fingerprint Sensors Industry Market
The fingerprint sensors market is poised for continued growth, driven by technological advancements, expanding applications, and increasing demand for secure authentication. Future market potential is significant, with opportunities in emerging markets and new applications such as automotive and healthcare. Strategic partnerships and collaborations among industry players will play a key role in shaping the future of the market. The integration of AI and machine learning will further enhance the accuracy and security of fingerprint sensors.
Fingerprint Sensors Industry Segmentation
-
1. Type
- 1.1. Optical
- 1.2. Capacitive
- 1.3. Thermal
- 1.4. Ultrasonic
-
2. Application
- 2.1. Smartphones/Tablets
- 2.2. Laptops
- 2.3. Smartcards
- 2.4. IoT and Other Applications
-
3. End-user Industries
- 3.1. Military and Defense
- 3.2. Consumer Electronics
- 3.3. BFSI
- 3.4. Government
- 3.5. Other End-user Industries
Fingerprint Sensors Industry Segmentation By Geography
-
1. North America
- 1.1. United States
- 1.2. Canada
-
2. Europe
- 2.1. Germany
- 2.2. United Kingdom
- 2.3. France
-
3. Asia
- 3.1. China
- 3.2. Japan
- 3.3. India
- 3.4. South Korea
- 4. Australia and New Zealand
- 5. Latin America
- 6. Middle East and Africa
Fingerprint Sensors Industry REPORT HIGHLIGHTS
| Aspects | Details |
|---|---|
| Study Period | 2019-2033 |
| Base Year | 2024 |
| Estimated Year | 2025 |
| Forecast Period | 2025-2033 |
| Historical Period | 2019-2024 |
| Growth Rate | CAGR of 11.96% from 2019-2033 |
| Segmentation |
|
Table of Contents
- 1. Introduction
- 1.1. Research Scope
- 1.2. Market Segmentation
- 1.3. Research Methodology
- 1.4. Definitions and Assumptions
- 2. Executive Summary
- 2.1. Introduction
- 3. Market Dynamics
- 3.1. Introduction
- 3.2. Market Drivers
- 3.2.1. Increasing Usage of Fingerprint Sensors for Smart Wearable Devices and Smartphones; Need for Secured Security and Business Applications; Government Initiatives to Adopt Biometrics in Various Fields
- 3.3. Market Restrains
- 3.3.1 Increase in Adoption of Substitute Technologies
- 3.3.2 such as Face and Iris Scanning
- 3.4. Market Trends
- 3.4.1. Smartphones Under the Application Segment is Expected to Hold a Major Share
- 4. Market Factor Analysis
- 4.1. Porters Five Forces
- 4.2. Supply/Value Chain
- 4.3. PESTEL analysis
- 4.4. Market Entropy
- 4.5. Patent/Trademark Analysis
- 5. Global Fingerprint Sensors Industry Analysis, Insights and Forecast, 2019-2031
- 5.1. Market Analysis, Insights and Forecast - by Type
- 5.1.1. Optical
- 5.1.2. Capacitive
- 5.1.3. Thermal
- 5.1.4. Ultrasonic
- 5.2. Market Analysis, Insights and Forecast - by Application
- 5.2.1. Smartphones/Tablets
- 5.2.2. Laptops
- 5.2.3. Smartcards
- 5.2.4. IoT and Other Applications
- 5.3. Market Analysis, Insights and Forecast - by End-user Industries
- 5.3.1. Military and Defense
- 5.3.2. Consumer Electronics
- 5.3.3. BFSI
- 5.3.4. Government
- 5.3.5. Other End-user Industries
- 5.4. Market Analysis, Insights and Forecast - by Region
- 5.4.1. North America
- 5.4.2. Europe
- 5.4.3. Asia
- 5.4.4. Australia and New Zealand
- 5.4.5. Latin America
- 5.4.6. Middle East and Africa
- 5.1. Market Analysis, Insights and Forecast - by Type
- 6. North America Fingerprint Sensors Industry Analysis, Insights and Forecast, 2019-2031
- 6.1. Market Analysis, Insights and Forecast - by Type
- 6.1.1. Optical
- 6.1.2. Capacitive
- 6.1.3. Thermal
- 6.1.4. Ultrasonic
- 6.2. Market Analysis, Insights and Forecast - by Application
- 6.2.1. Smartphones/Tablets
- 6.2.2. Laptops
- 6.2.3. Smartcards
- 6.2.4. IoT and Other Applications
- 6.3. Market Analysis, Insights and Forecast - by End-user Industries
- 6.3.1. Military and Defense
- 6.3.2. Consumer Electronics
- 6.3.3. BFSI
- 6.3.4. Government
- 6.3.5. Other End-user Industries
- 6.1. Market Analysis, Insights and Forecast - by Type
- 7. Europe Fingerprint Sensors Industry Analysis, Insights and Forecast, 2019-2031
- 7.1. Market Analysis, Insights and Forecast - by Type
- 7.1.1. Optical
- 7.1.2. Capacitive
- 7.1.3. Thermal
- 7.1.4. Ultrasonic
- 7.2. Market Analysis, Insights and Forecast - by Application
- 7.2.1. Smartphones/Tablets
- 7.2.2. Laptops
- 7.2.3. Smartcards
- 7.2.4. IoT and Other Applications
- 7.3. Market Analysis, Insights and Forecast - by End-user Industries
- 7.3.1. Military and Defense
- 7.3.2. Consumer Electronics
- 7.3.3. BFSI
- 7.3.4. Government
- 7.3.5. Other End-user Industries
- 7.1. Market Analysis, Insights and Forecast - by Type
- 8. Asia Fingerprint Sensors Industry Analysis, Insights and Forecast, 2019-2031
- 8.1. Market Analysis, Insights and Forecast - by Type
- 8.1.1. Optical
- 8.1.2. Capacitive
- 8.1.3. Thermal
- 8.1.4. Ultrasonic
- 8.2. Market Analysis, Insights and Forecast - by Application
- 8.2.1. Smartphones/Tablets
- 8.2.2. Laptops
- 8.2.3. Smartcards
- 8.2.4. IoT and Other Applications
- 8.3. Market Analysis, Insights and Forecast - by End-user Industries
- 8.3.1. Military and Defense
- 8.3.2. Consumer Electronics
- 8.3.3. BFSI
- 8.3.4. Government
- 8.3.5. Other End-user Industries
- 8.1. Market Analysis, Insights and Forecast - by Type
- 9. Australia and New Zealand Fingerprint Sensors Industry Analysis, Insights and Forecast, 2019-2031
- 9.1. Market Analysis, Insights and Forecast - by Type
- 9.1.1. Optical
- 9.1.2. Capacitive
- 9.1.3. Thermal
- 9.1.4. Ultrasonic
- 9.2. Market Analysis, Insights and Forecast - by Application
- 9.2.1. Smartphones/Tablets
- 9.2.2. Laptops
- 9.2.3. Smartcards
- 9.2.4. IoT and Other Applications
- 9.3. Market Analysis, Insights and Forecast - by End-user Industries
- 9.3.1. Military and Defense
- 9.3.2. Consumer Electronics
- 9.3.3. BFSI
- 9.3.4. Government
- 9.3.5. Other End-user Industries
- 9.1. Market Analysis, Insights and Forecast - by Type
- 10. Latin America Fingerprint Sensors Industry Analysis, Insights and Forecast, 2019-2031
- 10.1. Market Analysis, Insights and Forecast - by Type
- 10.1.1. Optical
- 10.1.2. Capacitive
- 10.1.3. Thermal
- 10.1.4. Ultrasonic
- 10.2. Market Analysis, Insights and Forecast - by Application
- 10.2.1. Smartphones/Tablets
- 10.2.2. Laptops
- 10.2.3. Smartcards
- 10.2.4. IoT and Other Applications
- 10.3. Market Analysis, Insights and Forecast - by End-user Industries
- 10.3.1. Military and Defense
- 10.3.2. Consumer Electronics
- 10.3.3. BFSI
- 10.3.4. Government
- 10.3.5. Other End-user Industries
- 10.1. Market Analysis, Insights and Forecast - by Type
- 11. Middle East and Africa Fingerprint Sensors Industry Analysis, Insights and Forecast, 2019-2031
- 11.1. Market Analysis, Insights and Forecast - by Type
- 11.1.1. Optical
- 11.1.2. Capacitive
- 11.1.3. Thermal
- 11.1.4. Ultrasonic
- 11.2. Market Analysis, Insights and Forecast - by Application
- 11.2.1. Smartphones/Tablets
- 11.2.2. Laptops
- 11.2.3. Smartcards
- 11.2.4. IoT and Other Applications
- 11.3. Market Analysis, Insights and Forecast - by End-user Industries
- 11.3.1. Military and Defense
- 11.3.2. Consumer Electronics
- 11.3.3. BFSI
- 11.3.4. Government
- 11.3.5. Other End-user Industries
- 11.1. Market Analysis, Insights and Forecast - by Type
- 12. North America Fingerprint Sensors Industry Analysis, Insights and Forecast, 2019-2031
- 12.1. Market Analysis, Insights and Forecast - By Country/Sub-region
- 12.1.1 United States
- 12.1.2 Canada
- 13. Europe Fingerprint Sensors Industry Analysis, Insights and Forecast, 2019-2031
- 13.1. Market Analysis, Insights and Forecast - By Country/Sub-region
- 13.1.1 Germany
- 13.1.2 United Kingdom
- 13.1.3 France
- 14. Asia Fingerprint Sensors Industry Analysis, Insights and Forecast, 2019-2031
- 14.1. Market Analysis, Insights and Forecast - By Country/Sub-region
- 14.1.1 China
- 14.1.2 Japan
- 14.1.3 India
- 14.1.4 South Korea
- 15. Australia and New Zealand Fingerprint Sensors Industry Analysis, Insights and Forecast, 2019-2031
- 15.1. Market Analysis, Insights and Forecast - By Country/Sub-region
- 15.1.1.
- 16. Latin America Fingerprint Sensors Industry Analysis, Insights and Forecast, 2019-2031
- 16.1. Market Analysis, Insights and Forecast - By Country/Sub-region
- 16.1.1.
- 17. Middle East and Africa Fingerprint Sensors Industry Analysis, Insights and Forecast, 2019-2031
- 17.1. Market Analysis, Insights and Forecast - By Country/Sub-region
- 17.1.1.
- 18. Competitive Analysis
- 18.1. Global Market Share Analysis 2024
- 18.2. Company Profiles
- 18.2.1 Next Biometrics Group ASA
- 18.2.1.1. Overview
- 18.2.1.2. Products
- 18.2.1.3. SWOT Analysis
- 18.2.1.4. Recent Developments
- 18.2.1.5. Financials (Based on Availability)
- 18.2.2 Sonavation Inc
- 18.2.2.1. Overview
- 18.2.2.2. Products
- 18.2.2.3. SWOT Analysis
- 18.2.2.4. Recent Developments
- 18.2.2.5. Financials (Based on Availability)
- 18.2.3 Idemia France SAS
- 18.2.3.1. Overview
- 18.2.3.2. Products
- 18.2.3.3. SWOT Analysis
- 18.2.3.4. Recent Developments
- 18.2.3.5. Financials (Based on Availability)
- 18.2.4 Fingerprint Cards AB
- 18.2.4.1. Overview
- 18.2.4.2. Products
- 18.2.4.3. SWOT Analysis
- 18.2.4.4. Recent Developments
- 18.2.4.5. Financials (Based on Availability)
- 18.2.5 Synaptics Inc
- 18.2.5.1. Overview
- 18.2.5.2. Products
- 18.2.5.3. SWOT Analysis
- 18.2.5.4. Recent Developments
- 18.2.5.5. Financials (Based on Availability)
- 18.2.6 Qualcomm Technologies Inc
- 18.2.6.1. Overview
- 18.2.6.2. Products
- 18.2.6.3. SWOT Analysis
- 18.2.6.4. Recent Developments
- 18.2.6.5. Financials (Based on Availability)
- 18.2.7 NEC Corporation
- 18.2.7.1. Overview
- 18.2.7.2. Products
- 18.2.7.3. SWOT Analysis
- 18.2.7.4. Recent Developments
- 18.2.7.5. Financials (Based on Availability)
- 18.2.8 Thales Group (Gemalto NV)
- 18.2.8.1. Overview
- 18.2.8.2. Products
- 18.2.8.3. SWOT Analysis
- 18.2.8.4. Recent Developments
- 18.2.8.5. Financials (Based on Availability)
- 18.2.9 TDK Corporation
- 18.2.9.1. Overview
- 18.2.9.2. Products
- 18.2.9.3. SWOT Analysis
- 18.2.9.4. Recent Developments
- 18.2.9.5. Financials (Based on Availability)
- 18.2.10 Shenzhen Goodix Technology Co Ltd
- 18.2.10.1. Overview
- 18.2.10.2. Products
- 18.2.10.3. SWOT Analysis
- 18.2.10.4. Recent Developments
- 18.2.10.5. Financials (Based on Availability)
- 18.2.11 Idex Biometrics ASA
- 18.2.11.1. Overview
- 18.2.11.2. Products
- 18.2.11.3. SWOT Analysis
- 18.2.11.4. Recent Developments
- 18.2.11.5. Financials (Based on Availability)
- 18.2.12 Vkansee Technology Inc
- 18.2.12.1. Overview
- 18.2.12.2. Products
- 18.2.12.3. SWOT Analysis
- 18.2.12.4. Recent Developments
- 18.2.12.5. Financials (Based on Availability)
- 18.2.13 Crucialtec Co Ltd
- 18.2.13.1. Overview
- 18.2.13.2. Products
- 18.2.13.3. SWOT Analysis
- 18.2.13.4. Recent Developments
- 18.2.13.5. Financials (Based on Availability)
- 18.2.14 Egis Technology Inc
- 18.2.14.1. Overview
- 18.2.14.2. Products
- 18.2.14.3. SWOT Analysis
- 18.2.14.4. Recent Developments
- 18.2.14.5. Financials (Based on Availability)
- 18.2.1 Next Biometrics Group ASA
List of Figures
- Figure 1: Global Fingerprint Sensors Industry Revenue Breakdown (Million, %) by Region 2024 & 2032
- Figure 2: North America Fingerprint Sensors Industry Revenue (Million), by Country 2024 & 2032
- Figure 3: North America Fingerprint Sensors Industry Revenue Share (%), by Country 2024 & 2032
- Figure 4: Europe Fingerprint Sensors Industry Revenue (Million), by Country 2024 & 2032
- Figure 5: Europe Fingerprint Sensors Industry Revenue Share (%), by Country 2024 & 2032
- Figure 6: Asia Fingerprint Sensors Industry Revenue (Million), by Country 2024 & 2032
- Figure 7: Asia Fingerprint Sensors Industry Revenue Share (%), by Country 2024 & 2032
- Figure 8: Australia and New Zealand Fingerprint Sensors Industry Revenue (Million), by Country 2024 & 2032
- Figure 9: Australia and New Zealand Fingerprint Sensors Industry Revenue Share (%), by Country 2024 & 2032
- Figure 10: Latin America Fingerprint Sensors Industry Revenue (Million), by Country 2024 & 2032
- Figure 11: Latin America Fingerprint Sensors Industry Revenue Share (%), by Country 2024 & 2032
- Figure 12: Middle East and Africa Fingerprint Sensors Industry Revenue (Million), by Country 2024 & 2032
- Figure 13: Middle East and Africa Fingerprint Sensors Industry Revenue Share (%), by Country 2024 & 2032
- Figure 14: North America Fingerprint Sensors Industry Revenue (Million), by Type 2024 & 2032
- Figure 15: North America Fingerprint Sensors Industry Revenue Share (%), by Type 2024 & 2032
- Figure 16: North America Fingerprint Sensors Industry Revenue (Million), by Application 2024 & 2032
- Figure 17: North America Fingerprint Sensors Industry Revenue Share (%), by Application 2024 & 2032
- Figure 18: North America Fingerprint Sensors Industry Revenue (Million), by End-user Industries 2024 & 2032
- Figure 19: North America Fingerprint Sensors Industry Revenue Share (%), by End-user Industries 2024 & 2032
- Figure 20: North America Fingerprint Sensors Industry Revenue (Million), by Country 2024 & 2032
- Figure 21: North America Fingerprint Sensors Industry Revenue Share (%), by Country 2024 & 2032
- Figure 22: Europe Fingerprint Sensors Industry Revenue (Million), by Type 2024 & 2032
- Figure 23: Europe Fingerprint Sensors Industry Revenue Share (%), by Type 2024 & 2032
- Figure 24: Europe Fingerprint Sensors Industry Revenue (Million), by Application 2024 & 2032
- Figure 25: Europe Fingerprint Sensors Industry Revenue Share (%), by Application 2024 & 2032
- Figure 26: Europe Fingerprint Sensors Industry Revenue (Million), by End-user Industries 2024 & 2032
- Figure 27: Europe Fingerprint Sensors Industry Revenue Share (%), by End-user Industries 2024 & 2032
- Figure 28: Europe Fingerprint Sensors Industry Revenue (Million), by Country 2024 & 2032
- Figure 29: Europe Fingerprint Sensors Industry Revenue Share (%), by Country 2024 & 2032
- Figure 30: Asia Fingerprint Sensors Industry Revenue (Million), by Type 2024 & 2032
- Figure 31: Asia Fingerprint Sensors Industry Revenue Share (%), by Type 2024 & 2032
- Figure 32: Asia Fingerprint Sensors Industry Revenue (Million), by Application 2024 & 2032
- Figure 33: Asia Fingerprint Sensors Industry Revenue Share (%), by Application 2024 & 2032
- Figure 34: Asia Fingerprint Sensors Industry Revenue (Million), by End-user Industries 2024 & 2032
- Figure 35: Asia Fingerprint Sensors Industry Revenue Share (%), by End-user Industries 2024 & 2032
- Figure 36: Asia Fingerprint Sensors Industry Revenue (Million), by Country 2024 & 2032
- Figure 37: Asia Fingerprint Sensors Industry Revenue Share (%), by Country 2024 & 2032
- Figure 38: Australia and New Zealand Fingerprint Sensors Industry Revenue (Million), by Type 2024 & 2032
- Figure 39: Australia and New Zealand Fingerprint Sensors Industry Revenue Share (%), by Type 2024 & 2032
- Figure 40: Australia and New Zealand Fingerprint Sensors Industry Revenue (Million), by Application 2024 & 2032
- Figure 41: Australia and New Zealand Fingerprint Sensors Industry Revenue Share (%), by Application 2024 & 2032
- Figure 42: Australia and New Zealand Fingerprint Sensors Industry Revenue (Million), by End-user Industries 2024 & 2032
- Figure 43: Australia and New Zealand Fingerprint Sensors Industry Revenue Share (%), by End-user Industries 2024 & 2032
- Figure 44: Australia and New Zealand Fingerprint Sensors Industry Revenue (Million), by Country 2024 & 2032
- Figure 45: Australia and New Zealand Fingerprint Sensors Industry Revenue Share (%), by Country 2024 & 2032
- Figure 46: Latin America Fingerprint Sensors Industry Revenue (Million), by Type 2024 & 2032
- Figure 47: Latin America Fingerprint Sensors Industry Revenue Share (%), by Type 2024 & 2032
- Figure 48: Latin America Fingerprint Sensors Industry Revenue (Million), by Application 2024 & 2032
- Figure 49: Latin America Fingerprint Sensors Industry Revenue Share (%), by Application 2024 & 2032
- Figure 50: Latin America Fingerprint Sensors Industry Revenue (Million), by End-user Industries 2024 & 2032
- Figure 51: Latin America Fingerprint Sensors Industry Revenue Share (%), by End-user Industries 2024 & 2032
- Figure 52: Latin America Fingerprint Sensors Industry Revenue (Million), by Country 2024 & 2032
- Figure 53: Latin America Fingerprint Sensors Industry Revenue Share (%), by Country 2024 & 2032
- Figure 54: Middle East and Africa Fingerprint Sensors Industry Revenue (Million), by Type 2024 & 2032
- Figure 55: Middle East and Africa Fingerprint Sensors Industry Revenue Share (%), by Type 2024 & 2032
- Figure 56: Middle East and Africa Fingerprint Sensors Industry Revenue (Million), by Application 2024 & 2032
- Figure 57: Middle East and Africa Fingerprint Sensors Industry Revenue Share (%), by Application 2024 & 2032
- Figure 58: Middle East and Africa Fingerprint Sensors Industry Revenue (Million), by End-user Industries 2024 & 2032
- Figure 59: Middle East and Africa Fingerprint Sensors Industry Revenue Share (%), by End-user Industries 2024 & 2032
- Figure 60: Middle East and Africa Fingerprint Sensors Industry Revenue (Million), by Country 2024 & 2032
- Figure 61: Middle East and Africa Fingerprint Sensors Industry Revenue Share (%), by Country 2024 & 2032
List of Tables
- Table 1: Global Fingerprint Sensors Industry Revenue Million Forecast, by Region 2019 & 2032
- Table 2: Global Fingerprint Sensors Industry Revenue Million Forecast, by Type 2019 & 2032
- Table 3: Global Fingerprint Sensors Industry Revenue Million Forecast, by Application 2019 & 2032
- Table 4: Global Fingerprint Sensors Industry Revenue Million Forecast, by End-user Industries 2019 & 2032
- Table 5: Global Fingerprint Sensors Industry Revenue Million Forecast, by Region 2019 & 2032
- Table 6: Global Fingerprint Sensors Industry Revenue Million Forecast, by Country 2019 & 2032
- Table 7: United States Fingerprint Sensors Industry Revenue (Million) Forecast, by Application 2019 & 2032
- Table 8: Canada Fingerprint Sensors Industry Revenue (Million) Forecast, by Application 2019 & 2032
- Table 9: Global Fingerprint Sensors Industry Revenue Million Forecast, by Country 2019 & 2032
- Table 10: Germany Fingerprint Sensors Industry Revenue (Million) Forecast, by Application 2019 & 2032
- Table 11: United Kingdom Fingerprint Sensors Industry Revenue (Million) Forecast, by Application 2019 & 2032
- Table 12: France Fingerprint Sensors Industry Revenue (Million) Forecast, by Application 2019 & 2032
- Table 13: Global Fingerprint Sensors Industry Revenue Million Forecast, by Country 2019 & 2032
- Table 14: China Fingerprint Sensors Industry Revenue (Million) Forecast, by Application 2019 & 2032
- Table 15: Japan Fingerprint Sensors Industry Revenue (Million) Forecast, by Application 2019 & 2032
- Table 16: India Fingerprint Sensors Industry Revenue (Million) Forecast, by Application 2019 & 2032
- Table 17: South Korea Fingerprint Sensors Industry Revenue (Million) Forecast, by Application 2019 & 2032
- Table 18: Global Fingerprint Sensors Industry Revenue Million Forecast, by Country 2019 & 2032
- Table 19: Fingerprint Sensors Industry Revenue (Million) Forecast, by Application 2019 & 2032
- Table 20: Global Fingerprint Sensors Industry Revenue Million Forecast, by Country 2019 & 2032
- Table 21: Fingerprint Sensors Industry Revenue (Million) Forecast, by Application 2019 & 2032
- Table 22: Global Fingerprint Sensors Industry Revenue Million Forecast, by Country 2019 & 2032
- Table 23: Fingerprint Sensors Industry Revenue (Million) Forecast, by Application 2019 & 2032
- Table 24: Global Fingerprint Sensors Industry Revenue Million Forecast, by Type 2019 & 2032
- Table 25: Global Fingerprint Sensors Industry Revenue Million Forecast, by Application 2019 & 2032
- Table 26: Global Fingerprint Sensors Industry Revenue Million Forecast, by End-user Industries 2019 & 2032
- Table 27: Global Fingerprint Sensors Industry Revenue Million Forecast, by Country 2019 & 2032
- Table 28: United States Fingerprint Sensors Industry Revenue (Million) Forecast, by Application 2019 & 2032
- Table 29: Canada Fingerprint Sensors Industry Revenue (Million) Forecast, by Application 2019 & 2032
- Table 30: Global Fingerprint Sensors Industry Revenue Million Forecast, by Type 2019 & 2032
- Table 31: Global Fingerprint Sensors Industry Revenue Million Forecast, by Application 2019 & 2032
- Table 32: Global Fingerprint Sensors Industry Revenue Million Forecast, by End-user Industries 2019 & 2032
- Table 33: Global Fingerprint Sensors Industry Revenue Million Forecast, by Country 2019 & 2032
- Table 34: Germany Fingerprint Sensors Industry Revenue (Million) Forecast, by Application 2019 & 2032
- Table 35: United Kingdom Fingerprint Sensors Industry Revenue (Million) Forecast, by Application 2019 & 2032
- Table 36: France Fingerprint Sensors Industry Revenue (Million) Forecast, by Application 2019 & 2032
- Table 37: Global Fingerprint Sensors Industry Revenue Million Forecast, by Type 2019 & 2032
- Table 38: Global Fingerprint Sensors Industry Revenue Million Forecast, by Application 2019 & 2032
- Table 39: Global Fingerprint Sensors Industry Revenue Million Forecast, by End-user Industries 2019 & 2032
- Table 40: Global Fingerprint Sensors Industry Revenue Million Forecast, by Country 2019 & 2032
- Table 41: China Fingerprint Sensors Industry Revenue (Million) Forecast, by Application 2019 & 2032
- Table 42: Japan Fingerprint Sensors Industry Revenue (Million) Forecast, by Application 2019 & 2032
- Table 43: India Fingerprint Sensors Industry Revenue (Million) Forecast, by Application 2019 & 2032
- Table 44: South Korea Fingerprint Sensors Industry Revenue (Million) Forecast, by Application 2019 & 2032
- Table 45: Global Fingerprint Sensors Industry Revenue Million Forecast, by Type 2019 & 2032
- Table 46: Global Fingerprint Sensors Industry Revenue Million Forecast, by Application 2019 & 2032
- Table 47: Global Fingerprint Sensors Industry Revenue Million Forecast, by End-user Industries 2019 & 2032
- Table 48: Global Fingerprint Sensors Industry Revenue Million Forecast, by Country 2019 & 2032
- Table 49: Global Fingerprint Sensors Industry Revenue Million Forecast, by Type 2019 & 2032
- Table 50: Global Fingerprint Sensors Industry Revenue Million Forecast, by Application 2019 & 2032
- Table 51: Global Fingerprint Sensors Industry Revenue Million Forecast, by End-user Industries 2019 & 2032
- Table 52: Global Fingerprint Sensors Industry Revenue Million Forecast, by Country 2019 & 2032
- Table 53: Global Fingerprint Sensors Industry Revenue Million Forecast, by Type 2019 & 2032
- Table 54: Global Fingerprint Sensors Industry Revenue Million Forecast, by Application 2019 & 2032
- Table 55: Global Fingerprint Sensors Industry Revenue Million Forecast, by End-user Industries 2019 & 2032
- Table 56: Global Fingerprint Sensors Industry Revenue Million Forecast, by Country 2019 & 2032
Frequently Asked Questions
1. What is the projected Compound Annual Growth Rate (CAGR) of the Fingerprint Sensors Industry?
The projected CAGR is approximately 11.96%.
2. Which companies are prominent players in the Fingerprint Sensors Industry?
Key companies in the market include Next Biometrics Group ASA, Sonavation Inc, Idemia France SAS, Fingerprint Cards AB, Synaptics Inc, Qualcomm Technologies Inc, NEC Corporation, Thales Group (Gemalto NV), TDK Corporation, Shenzhen Goodix Technology Co Ltd, Idex Biometrics ASA, Vkansee Technology Inc, Crucialtec Co Ltd, Egis Technology Inc.
3. What are the main segments of the Fingerprint Sensors Industry?
The market segments include Type, Application, End-user Industries.
4. Can you provide details about the market size?
The market size is estimated to be USD 9.54 Million as of 2022.
5. What are some drivers contributing to market growth?
Increasing Usage of Fingerprint Sensors for Smart Wearable Devices and Smartphones; Need for Secured Security and Business Applications; Government Initiatives to Adopt Biometrics in Various Fields.
6. What are the notable trends driving market growth?
Smartphones Under the Application Segment is Expected to Hold a Major Share.
7. Are there any restraints impacting market growth?
Increase in Adoption of Substitute Technologies. such as Face and Iris Scanning.
8. Can you provide examples of recent developments in the market?
September 2023 - Mastercard launched an in-car payment partnership aimed at Mercedes drivers in Germany. The collaboration will allow customers to use a fingerprint sensor in their car to make digital payments at more than 3,600 service stations in Germany.
9. What pricing options are available for accessing the report?
Pricing options include single-user, multi-user, and enterprise licenses priced at USD 4750, USD 5250, and USD 8750 respectively.
10. Is the market size provided in terms of value or volume?
The market size is provided in terms of value, measured in Million.
11. Are there any specific market keywords associated with the report?
Yes, the market keyword associated with the report is "Fingerprint Sensors Industry," which aids in identifying and referencing the specific market segment covered.
12. How do I determine which pricing option suits my needs best?
The pricing options vary based on user requirements and access needs. Individual users may opt for single-user licenses, while businesses requiring broader access may choose multi-user or enterprise licenses for cost-effective access to the report.
13. Are there any additional resources or data provided in the Fingerprint Sensors Industry report?
While the report offers comprehensive insights, it's advisable to review the specific contents or supplementary materials provided to ascertain if additional resources or data are available.
14. How can I stay updated on further developments or reports in the Fingerprint Sensors Industry?
To stay informed about further developments, trends, and reports in the Fingerprint Sensors Industry, consider subscribing to industry newsletters, following relevant companies and organizations, or regularly checking reputable industry news sources and publications.
Methodology
Step 1 - Identification of Relevant Samples Size from Population Database


Step 2 - Approaches for Defining Global Market Size (Value, Volume* & Price*)

Note*: In applicable scenarios
Step 3 - Data Sources
Primary Research
- Web Analytics
- Survey Reports
- Research Institute
- Latest Research Reports
- Opinion Leaders
Secondary Research
- Annual Reports
- White Paper
- Latest Press Release
- Industry Association
- Paid Database
- Investor Presentations

Step 4 - Data Triangulation
Involves using different sources of information in order to increase the validity of a study
These sources are likely to be stakeholders in a program - participants, other researchers, program staff, other community members, and so on.
Then we put all data in single framework & apply various statistical tools to find out the dynamic on the market.
During the analysis stage, feedback from the stakeholder groups would be compared to determine areas of agreement as well as areas of divergence


