
Key Insights
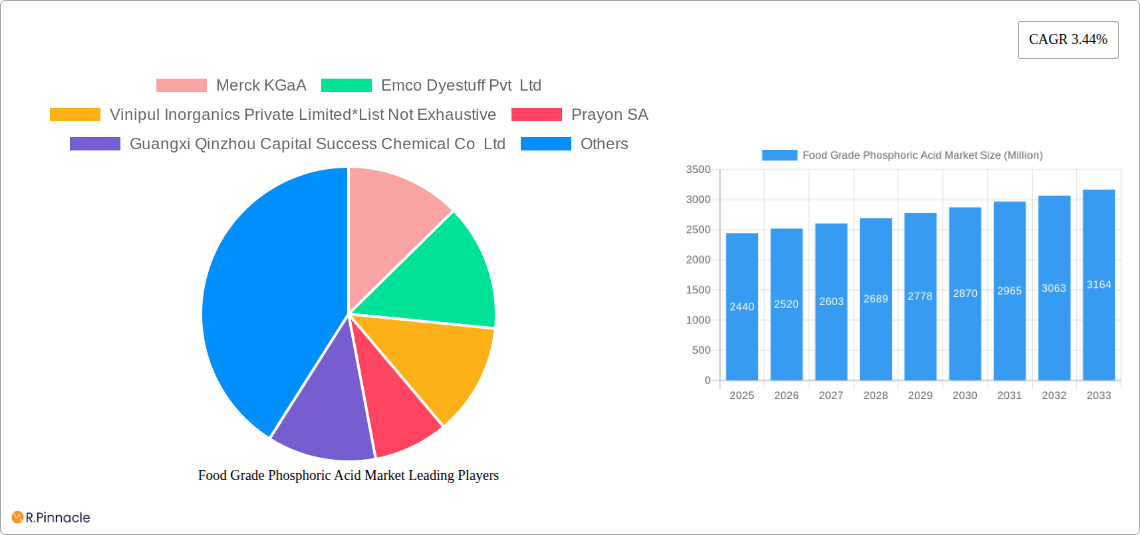
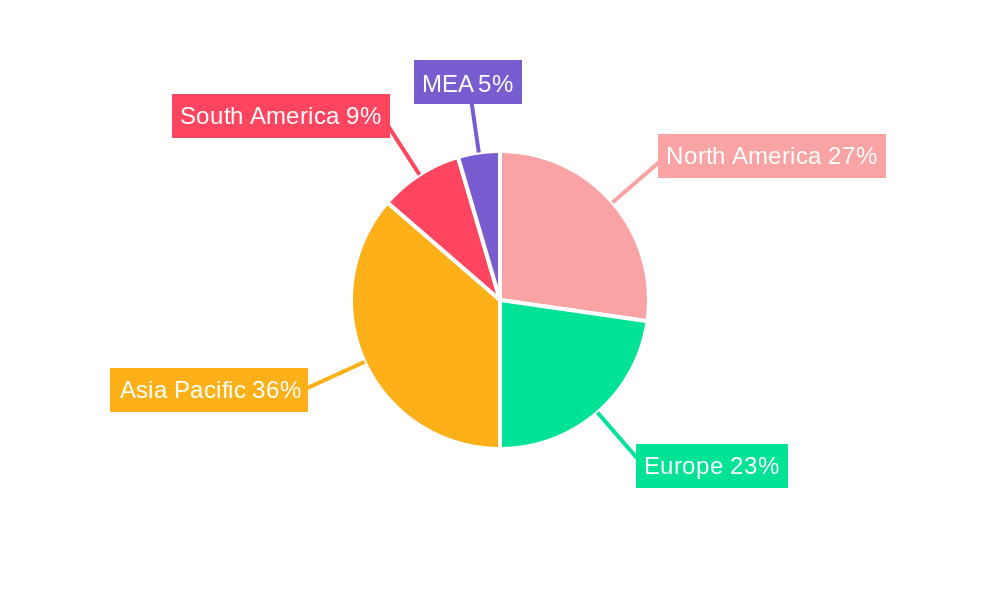
The global food grade phosphoric acid market, valued at $2.44 billion in 2025, is projected to experience steady growth, driven by increasing demand from the food and beverage industry. This growth is fueled by the crucial role phosphoric acid plays as a food additive, particularly in leavening agents, acidulants, and pH regulators for various processed foods and beverages. The rising consumption of processed foods globally, coupled with the expanding food and beverage industry in developing economies, significantly contributes to market expansion. Furthermore, the pharmaceutical industry's utilization of food-grade phosphoric acid in drug formulations and as a processing aid further strengthens market demand. While the market faces some restraints, such as stringent regulations concerning food additives and the availability of alternative acidulants, the overall growth trajectory remains positive. The market segmentation by application (food, beverage, pharmaceutical) allows for targeted strategies by manufacturers, with the food and beverage segments expected to retain the largest share throughout the forecast period. Geographical analysis reveals strong growth in regions like Asia Pacific, driven by rapid industrialization and increasing disposable incomes. North America and Europe are expected to maintain significant market shares due to established food processing industries and a high demand for processed foods. The competitive landscape features a mix of established multinational corporations and regional players, resulting in a dynamic market with opportunities for innovation and expansion.
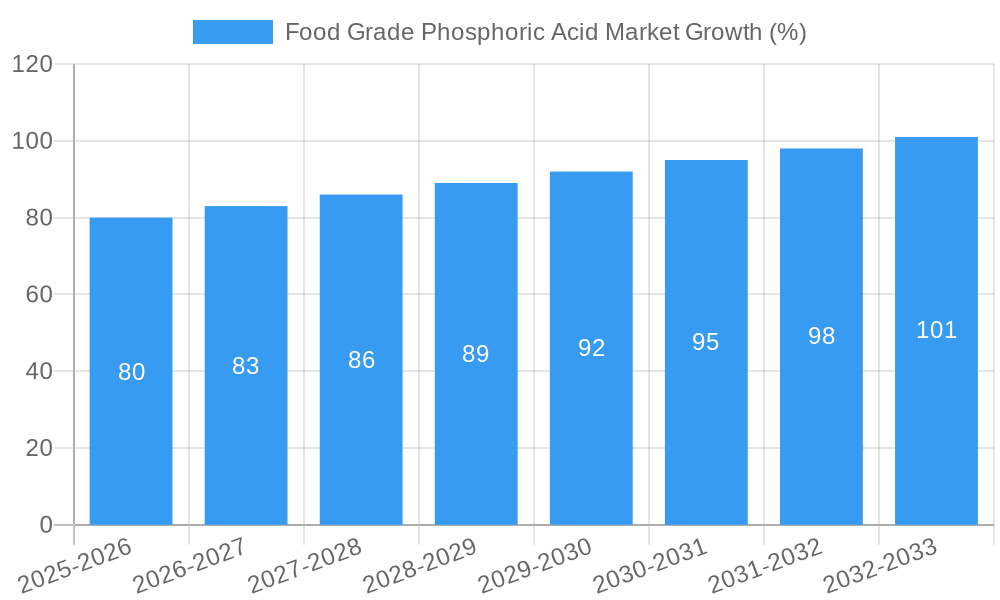
The projected Compound Annual Growth Rate (CAGR) of 3.44% from 2025 to 2033 indicates a consistent yet moderate expansion of the market. This suggests a stable growth environment, though fluctuations may arise due to factors like raw material price volatility and shifts in consumer preferences towards healthier food options. However, the ongoing trend toward convenience foods and processed products suggests a sustained demand for food-grade phosphoric acid as a critical ingredient. The market's success will depend on manufacturers' ability to innovate, comply with evolving regulations, and effectively address the sustainability concerns associated with chemical production and consumption. Strategic partnerships and investments in research and development will play a crucial role in shaping the future of the food-grade phosphoric acid market.
Food Grade Phosphoric Acid Market Report: 2019-2033
This comprehensive report provides an in-depth analysis of the Food Grade Phosphoric Acid market, offering invaluable insights for industry professionals, investors, and strategic decision-makers. Covering the period from 2019 to 2033 (Study Period), with a focus on 2025 (Base Year and Estimated Year), and forecasting to 2033 (Forecast Period), this report leverages historical data (2019-2024) to provide a robust and reliable outlook.
Food Grade Phosphoric Acid Market Market Structure & Innovation Trends
This section analyzes the competitive landscape, innovation drivers, regulatory environment, and market dynamics of the food-grade phosphoric acid market. We examine market concentration, identifying key players and their respective market shares. The report also details significant mergers and acquisitions (M&A) activities, including deal values and their impact on market structure. Innovation drivers are explored, focusing on technological advancements, evolving consumer preferences, and regulatory pressures. The analysis also considers the influence of substitute products and end-user demographics. For instance, the acquisition of Febex by Prayon in January 2023 significantly altered the European market landscape. The report quantifies the market share changes resulting from such transactions and projects future market concentration based on current trends. We will also analyze the regulatory frameworks impacting the market and their effect on innovation and competition.
Food Grade Phosphoric Acid Market Market Dynamics & Trends
This section delves into the key factors driving market growth, including technological advancements, evolving consumer preferences (e.g., demand for healthier food and beverages), and the competitive dynamics among key players. We present a detailed analysis of the Compound Annual Growth Rate (CAGR) during the historical period and project the CAGR for the forecast period (2025-2033). Market penetration rates across different segments and regions will be assessed, highlighting areas of high growth potential. The impact of technological disruptions, such as advancements in production processes and purification techniques, will be thoroughly investigated. The competitive landscape is analyzed, considering factors such as pricing strategies, product differentiation, and market share fluctuations. We will examine the strategies employed by leading players to maintain a competitive edge and anticipate future competitive dynamics. We expect a CAGR of xx% during the forecast period driven by increased demand in the food and beverage sector.
Dominant Regions & Segments in Food Grade Phosphoric Acid Market
This section identifies the leading regions and segments within the food-grade phosphoric acid market, focusing on Application: Food, Beverage, and Pharmaceutical. A detailed analysis of the dominant region(s) will be provided, considering factors such as market size, growth rate, and key drivers. For example, if the North American market dominates, we'll examine factors contributing to its leading position:
- Economic Policies: Government support for the food and beverage industry, trade agreements, and tax incentives.
- Infrastructure: Availability of raw materials, efficient transportation networks, and advanced manufacturing facilities.
- Consumer Preferences: Demand for processed foods and beverages containing phosphoric acid as a food additive.
Similarly, detailed dominance analysis will be presented for each of the leading segments (Food, Beverage, Pharmaceutical). The factors influencing the dominance of each segment will be thoroughly examined. We anticipate xx Million to be the market value of the dominant segment by 2033.
Food Grade Phosphoric Acid Market Product Innovations
This section summarizes recent product developments and their impact on the market. We will analyze innovative applications of food-grade phosphoric acid and highlight the competitive advantages of newly launched products. The focus will be on technological trends that shape product innovation and their alignment with market needs. The analysis will consider factors such as improved purity, enhanced functionality, and cost-effectiveness. For example, the expansion of Spectrum Chemical Mfg Corp.'s bioCERTIFIED™ product line demonstrates the growing demand for high-quality chemicals in biopharmaceutical applications.
Report Scope & Segmentation Analysis
This report segments the food-grade phosphoric acid market primarily by application: Food, Beverage, and Pharmaceutical. Each segment's growth projections, market size (in Million), and competitive dynamics will be analyzed separately.
Food: This segment accounts for a significant portion of the market due to the widespread use of phosphoric acid as an acidity regulator and flavor enhancer in various food products. Growth is projected to be driven by rising demand for processed foods.
Beverage: The beverage industry is a major consumer of food-grade phosphoric acid, primarily in carbonated soft drinks. This segment is expected to exhibit steady growth, driven by increasing global beverage consumption.
Pharmaceutical: This segment utilizes food-grade phosphoric acid as a pharmaceutical ingredient in various formulations. Growth in this segment is projected to be driven by advancements in pharmaceutical manufacturing and increasing demand for pharmaceutical products.
Key Drivers of Food Grade Phosphoric Acid Market Growth
Several factors drive the growth of the food-grade phosphoric acid market. Technological advancements in production processes lead to increased efficiency and reduced costs. Economic factors, such as increasing disposable incomes in developing economies, drive higher demand for processed foods and beverages. Regulatory frameworks related to food safety and quality standards also influence market dynamics. For example, stricter regulations might increase the demand for high-purity food-grade phosphoric acid.
Challenges in the Food Grade Phosphoric Acid Market Sector
The food-grade phosphoric acid market faces challenges, including regulatory hurdles related to food safety and environmental concerns. Supply chain disruptions and price volatility of raw materials can impact production costs. Intense competition among established players and new entrants also pose a challenge. These factors can result in reduced profit margins for market participants and limit overall market growth, potentially affecting the projected xx Million market size by 2033.
Emerging Opportunities in Food Grade Phosphoric Acid Market
Emerging opportunities include the expansion into new markets, especially in developing countries with growing food and beverage sectors. Technological advancements, such as the development of sustainable and eco-friendly production methods, present significant opportunities. Changing consumer preferences towards healthier food products may drive innovation in functional food applications of phosphoric acid. These opportunities could add significantly to the projected xx Million market value by the end of the forecast period.
Leading Players in the Food Grade Phosphoric Acid Market Market
- Merck KGaA
- Emco Dyestuff Pvt Ltd
- Vinipul Inorganics Private Limited
- Prayon SA
- Guangxi Qinzhou Capital Success Chemical Co Ltd
- Grasim Industries Limited
- Brenntag AG
- Spectrum Chemical Manufacturing Corp
- Nutrien Ltd
- OCP SA
Key Developments in Food Grade Phosphoric Acid Market Industry
- January 2023: Prayon's acquisition of Febex significantly reshaped the European market.
- March 2022: Spectrum Chemical Mfg Corp. expanded its bioCERTIFIED™ product line, catering to the growing biopharmaceutical sector.
- December 2021: OCP's investment in a wastewater treatment facility highlights environmental sustainability initiatives.
Future Outlook for Food Grade Phosphoric Acid Market Market
The future outlook for the food-grade phosphoric acid market remains positive, driven by sustained growth in the food and beverage industries and technological advancements enabling sustainable production. Strategic partnerships, investments in research and development, and expansion into new markets will be key factors determining the success of market players in the coming years. The projected xx Million market value by 2033 reflects a strong positive outlook for the market.
Food Grade Phosphoric Acid Market Segmentation
-
1. Application
- 1.1. Food
- 1.2. Beverage
- 1.3. Pharmaceutical
Food Grade Phosphoric Acid Market Segmentation By Geography
-
1. North America
- 1.1. United States
- 1.2. Canada
- 1.3. Mexico
- 1.4. Rest of North America
-
2. Europe
- 2.1. Germany
- 2.2. United Kingdom
- 2.3. Italy
- 2.4. Spain
- 2.5. France
- 2.6. Russia
- 2.7. Rest of Europe
-
3. Asia Pacific
- 3.1. India
- 3.2. China
- 3.3. Japan
- 3.4. Australia
- 3.5. Rest of Asia Pacific
-
4. Rest of the World
- 4.1. South America
- 4.2. Middle East
- 4.3. Africa
Food Grade Phosphoric Acid Market REPORT HIGHLIGHTS
| Aspects | Details |
|---|---|
| Study Period | 2019-2033 |
| Base Year | 2024 |
| Estimated Year | 2025 |
| Forecast Period | 2025-2033 |
| Historical Period | 2019-2024 |
| Growth Rate | CAGR of 3.44% from 2019-2033 |
| Segmentation |
|
Table of Contents
- 1. Introduction
- 1.1. Research Scope
- 1.2. Market Segmentation
- 1.3. Research Methodology
- 1.4. Definitions and Assumptions
- 2. Executive Summary
- 2.1. Introduction
- 3. Market Dynamics
- 3.1. Introduction
- 3.2. Market Drivers
- 3.2.1. Increasing Demand for Supplement Nutrition; Growing Casein Application in Processed Food Products
- 3.3. Market Restrains
- 3.3.1. Competition from Vegan/Plant-based Protein Powders
- 3.4. Market Trends
- 3.4.1. Increasing Demand as a Food Additive
- 4. Market Factor Analysis
- 4.1. Porters Five Forces
- 4.2. Supply/Value Chain
- 4.3. PESTEL analysis
- 4.4. Market Entropy
- 4.5. Patent/Trademark Analysis
- 5. Global Food Grade Phosphoric Acid Market Analysis, Insights and Forecast, 2019-2031
- 5.1. Market Analysis, Insights and Forecast - by Application
- 5.1.1. Food
- 5.1.2. Beverage
- 5.1.3. Pharmaceutical
- 5.2. Market Analysis, Insights and Forecast - by Region
- 5.2.1. North America
- 5.2.2. Europe
- 5.2.3. Asia Pacific
- 5.2.4. Rest of the World
- 5.1. Market Analysis, Insights and Forecast - by Application
- 6. North America Food Grade Phosphoric Acid Market Analysis, Insights and Forecast, 2019-2031
- 6.1. Market Analysis, Insights and Forecast - by Application
- 6.1.1. Food
- 6.1.2. Beverage
- 6.1.3. Pharmaceutical
- 6.1. Market Analysis, Insights and Forecast - by Application
- 7. Europe Food Grade Phosphoric Acid Market Analysis, Insights and Forecast, 2019-2031
- 7.1. Market Analysis, Insights and Forecast - by Application
- 7.1.1. Food
- 7.1.2. Beverage
- 7.1.3. Pharmaceutical
- 7.1. Market Analysis, Insights and Forecast - by Application
- 8. Asia Pacific Food Grade Phosphoric Acid Market Analysis, Insights and Forecast, 2019-2031
- 8.1. Market Analysis, Insights and Forecast - by Application
- 8.1.1. Food
- 8.1.2. Beverage
- 8.1.3. Pharmaceutical
- 8.1. Market Analysis, Insights and Forecast - by Application
- 9. Rest of the World Food Grade Phosphoric Acid Market Analysis, Insights and Forecast, 2019-2031
- 9.1. Market Analysis, Insights and Forecast - by Application
- 9.1.1. Food
- 9.1.2. Beverage
- 9.1.3. Pharmaceutical
- 9.1. Market Analysis, Insights and Forecast - by Application
- 10. North America Food Grade Phosphoric Acid Market Analysis, Insights and Forecast, 2019-2031
- 10.1. Market Analysis, Insights and Forecast - By Country/Sub-region
- 10.1.1 United States
- 10.1.2 Canada
- 10.1.3 Mexico
- 11. Europe Food Grade Phosphoric Acid Market Analysis, Insights and Forecast, 2019-2031
- 11.1. Market Analysis, Insights and Forecast - By Country/Sub-region
- 11.1.1 Germany
- 11.1.2 United Kingdom
- 11.1.3 France
- 11.1.4 Spain
- 11.1.5 Italy
- 11.1.6 Spain
- 11.1.7 Belgium
- 11.1.8 Netherland
- 11.1.9 Nordics
- 11.1.10 Rest of Europe
- 12. Asia Pacific Food Grade Phosphoric Acid Market Analysis, Insights and Forecast, 2019-2031
- 12.1. Market Analysis, Insights and Forecast - By Country/Sub-region
- 12.1.1 China
- 12.1.2 Japan
- 12.1.3 India
- 12.1.4 South Korea
- 12.1.5 Southeast Asia
- 12.1.6 Australia
- 12.1.7 Indonesia
- 12.1.8 Phillipes
- 12.1.9 Singapore
- 12.1.10 Thailandc
- 12.1.11 Rest of Asia Pacific
- 13. South America Food Grade Phosphoric Acid Market Analysis, Insights and Forecast, 2019-2031
- 13.1. Market Analysis, Insights and Forecast - By Country/Sub-region
- 13.1.1 Brazil
- 13.1.2 Argentina
- 13.1.3 Peru
- 13.1.4 Chile
- 13.1.5 Colombia
- 13.1.6 Ecuador
- 13.1.7 Venezuela
- 13.1.8 Rest of South America
- 14. North America Food Grade Phosphoric Acid Market Analysis, Insights and Forecast, 2019-2031
- 14.1. Market Analysis, Insights and Forecast - By Country/Sub-region
- 14.1.1 United States
- 14.1.2 Canada
- 14.1.3 Mexico
- 15. MEA Food Grade Phosphoric Acid Market Analysis, Insights and Forecast, 2019-2031
- 15.1. Market Analysis, Insights and Forecast - By Country/Sub-region
- 15.1.1 United Arab Emirates
- 15.1.2 Saudi Arabia
- 15.1.3 South Africa
- 15.1.4 Rest of Middle East and Africa
- 16. Competitive Analysis
- 16.1. Global Market Share Analysis 2024
- 16.2. Company Profiles
- 16.2.1 Merck KGaA
- 16.2.1.1. Overview
- 16.2.1.2. Products
- 16.2.1.3. SWOT Analysis
- 16.2.1.4. Recent Developments
- 16.2.1.5. Financials (Based on Availability)
- 16.2.2 Emco Dyestuff Pvt Ltd
- 16.2.2.1. Overview
- 16.2.2.2. Products
- 16.2.2.3. SWOT Analysis
- 16.2.2.4. Recent Developments
- 16.2.2.5. Financials (Based on Availability)
- 16.2.3 Vinipul Inorganics Private Limited*List Not Exhaustive
- 16.2.3.1. Overview
- 16.2.3.2. Products
- 16.2.3.3. SWOT Analysis
- 16.2.3.4. Recent Developments
- 16.2.3.5. Financials (Based on Availability)
- 16.2.4 Prayon SA
- 16.2.4.1. Overview
- 16.2.4.2. Products
- 16.2.4.3. SWOT Analysis
- 16.2.4.4. Recent Developments
- 16.2.4.5. Financials (Based on Availability)
- 16.2.5 Guangxi Qinzhou Capital Success Chemical Co Ltd
- 16.2.5.1. Overview
- 16.2.5.2. Products
- 16.2.5.3. SWOT Analysis
- 16.2.5.4. Recent Developments
- 16.2.5.5. Financials (Based on Availability)
- 16.2.6 Grasim Industries Limited
- 16.2.6.1. Overview
- 16.2.6.2. Products
- 16.2.6.3. SWOT Analysis
- 16.2.6.4. Recent Developments
- 16.2.6.5. Financials (Based on Availability)
- 16.2.7 Brenntag AG
- 16.2.7.1. Overview
- 16.2.7.2. Products
- 16.2.7.3. SWOT Analysis
- 16.2.7.4. Recent Developments
- 16.2.7.5. Financials (Based on Availability)
- 16.2.8 Spectrum Chemical Manufacturing Corp
- 16.2.8.1. Overview
- 16.2.8.2. Products
- 16.2.8.3. SWOT Analysis
- 16.2.8.4. Recent Developments
- 16.2.8.5. Financials (Based on Availability)
- 16.2.9 Nutrien Ltd
- 16.2.9.1. Overview
- 16.2.9.2. Products
- 16.2.9.3. SWOT Analysis
- 16.2.9.4. Recent Developments
- 16.2.9.5. Financials (Based on Availability)
- 16.2.10 OCP SA
- 16.2.10.1. Overview
- 16.2.10.2. Products
- 16.2.10.3. SWOT Analysis
- 16.2.10.4. Recent Developments
- 16.2.10.5. Financials (Based on Availability)
- 16.2.1 Merck KGaA
List of Figures
- Figure 1: Global Food Grade Phosphoric Acid Market Revenue Breakdown (Million, %) by Region 2024 & 2032
- Figure 2: North America Food Grade Phosphoric Acid Market Revenue (Million), by Country 2024 & 2032
- Figure 3: North America Food Grade Phosphoric Acid Market Revenue Share (%), by Country 2024 & 2032
- Figure 4: Europe Food Grade Phosphoric Acid Market Revenue (Million), by Country 2024 & 2032
- Figure 5: Europe Food Grade Phosphoric Acid Market Revenue Share (%), by Country 2024 & 2032
- Figure 6: Asia Pacific Food Grade Phosphoric Acid Market Revenue (Million), by Country 2024 & 2032
- Figure 7: Asia Pacific Food Grade Phosphoric Acid Market Revenue Share (%), by Country 2024 & 2032
- Figure 8: South America Food Grade Phosphoric Acid Market Revenue (Million), by Country 2024 & 2032
- Figure 9: South America Food Grade Phosphoric Acid Market Revenue Share (%), by Country 2024 & 2032
- Figure 10: North America Food Grade Phosphoric Acid Market Revenue (Million), by Country 2024 & 2032
- Figure 11: North America Food Grade Phosphoric Acid Market Revenue Share (%), by Country 2024 & 2032
- Figure 12: MEA Food Grade Phosphoric Acid Market Revenue (Million), by Country 2024 & 2032
- Figure 13: MEA Food Grade Phosphoric Acid Market Revenue Share (%), by Country 2024 & 2032
- Figure 14: North America Food Grade Phosphoric Acid Market Revenue (Million), by Application 2024 & 2032
- Figure 15: North America Food Grade Phosphoric Acid Market Revenue Share (%), by Application 2024 & 2032
- Figure 16: North America Food Grade Phosphoric Acid Market Revenue (Million), by Country 2024 & 2032
- Figure 17: North America Food Grade Phosphoric Acid Market Revenue Share (%), by Country 2024 & 2032
- Figure 18: Europe Food Grade Phosphoric Acid Market Revenue (Million), by Application 2024 & 2032
- Figure 19: Europe Food Grade Phosphoric Acid Market Revenue Share (%), by Application 2024 & 2032
- Figure 20: Europe Food Grade Phosphoric Acid Market Revenue (Million), by Country 2024 & 2032
- Figure 21: Europe Food Grade Phosphoric Acid Market Revenue Share (%), by Country 2024 & 2032
- Figure 22: Asia Pacific Food Grade Phosphoric Acid Market Revenue (Million), by Application 2024 & 2032
- Figure 23: Asia Pacific Food Grade Phosphoric Acid Market Revenue Share (%), by Application 2024 & 2032
- Figure 24: Asia Pacific Food Grade Phosphoric Acid Market Revenue (Million), by Country 2024 & 2032
- Figure 25: Asia Pacific Food Grade Phosphoric Acid Market Revenue Share (%), by Country 2024 & 2032
- Figure 26: Rest of the World Food Grade Phosphoric Acid Market Revenue (Million), by Application 2024 & 2032
- Figure 27: Rest of the World Food Grade Phosphoric Acid Market Revenue Share (%), by Application 2024 & 2032
- Figure 28: Rest of the World Food Grade Phosphoric Acid Market Revenue (Million), by Country 2024 & 2032
- Figure 29: Rest of the World Food Grade Phosphoric Acid Market Revenue Share (%), by Country 2024 & 2032
List of Tables
- Table 1: Global Food Grade Phosphoric Acid Market Revenue Million Forecast, by Region 2019 & 2032
- Table 2: Global Food Grade Phosphoric Acid Market Revenue Million Forecast, by Application 2019 & 2032
- Table 3: Global Food Grade Phosphoric Acid Market Revenue Million Forecast, by Region 2019 & 2032
- Table 4: Global Food Grade Phosphoric Acid Market Revenue Million Forecast, by Country 2019 & 2032
- Table 5: United States Food Grade Phosphoric Acid Market Revenue (Million) Forecast, by Application 2019 & 2032
- Table 6: Canada Food Grade Phosphoric Acid Market Revenue (Million) Forecast, by Application 2019 & 2032
- Table 7: Mexico Food Grade Phosphoric Acid Market Revenue (Million) Forecast, by Application 2019 & 2032
- Table 8: Global Food Grade Phosphoric Acid Market Revenue Million Forecast, by Country 2019 & 2032
- Table 9: Germany Food Grade Phosphoric Acid Market Revenue (Million) Forecast, by Application 2019 & 2032
- Table 10: United Kingdom Food Grade Phosphoric Acid Market Revenue (Million) Forecast, by Application 2019 & 2032
- Table 11: France Food Grade Phosphoric Acid Market Revenue (Million) Forecast, by Application 2019 & 2032
- Table 12: Spain Food Grade Phosphoric Acid Market Revenue (Million) Forecast, by Application 2019 & 2032
- Table 13: Italy Food Grade Phosphoric Acid Market Revenue (Million) Forecast, by Application 2019 & 2032
- Table 14: Spain Food Grade Phosphoric Acid Market Revenue (Million) Forecast, by Application 2019 & 2032
- Table 15: Belgium Food Grade Phosphoric Acid Market Revenue (Million) Forecast, by Application 2019 & 2032
- Table 16: Netherland Food Grade Phosphoric Acid Market Revenue (Million) Forecast, by Application 2019 & 2032
- Table 17: Nordics Food Grade Phosphoric Acid Market Revenue (Million) Forecast, by Application 2019 & 2032
- Table 18: Rest of Europe Food Grade Phosphoric Acid Market Revenue (Million) Forecast, by Application 2019 & 2032
- Table 19: Global Food Grade Phosphoric Acid Market Revenue Million Forecast, by Country 2019 & 2032
- Table 20: China Food Grade Phosphoric Acid Market Revenue (Million) Forecast, by Application 2019 & 2032
- Table 21: Japan Food Grade Phosphoric Acid Market Revenue (Million) Forecast, by Application 2019 & 2032
- Table 22: India Food Grade Phosphoric Acid Market Revenue (Million) Forecast, by Application 2019 & 2032
- Table 23: South Korea Food Grade Phosphoric Acid Market Revenue (Million) Forecast, by Application 2019 & 2032
- Table 24: Southeast Asia Food Grade Phosphoric Acid Market Revenue (Million) Forecast, by Application 2019 & 2032
- Table 25: Australia Food Grade Phosphoric Acid Market Revenue (Million) Forecast, by Application 2019 & 2032
- Table 26: Indonesia Food Grade Phosphoric Acid Market Revenue (Million) Forecast, by Application 2019 & 2032
- Table 27: Phillipes Food Grade Phosphoric Acid Market Revenue (Million) Forecast, by Application 2019 & 2032
- Table 28: Singapore Food Grade Phosphoric Acid Market Revenue (Million) Forecast, by Application 2019 & 2032
- Table 29: Thailandc Food Grade Phosphoric Acid Market Revenue (Million) Forecast, by Application 2019 & 2032
- Table 30: Rest of Asia Pacific Food Grade Phosphoric Acid Market Revenue (Million) Forecast, by Application 2019 & 2032
- Table 31: Global Food Grade Phosphoric Acid Market Revenue Million Forecast, by Country 2019 & 2032
- Table 32: Brazil Food Grade Phosphoric Acid Market Revenue (Million) Forecast, by Application 2019 & 2032
- Table 33: Argentina Food Grade Phosphoric Acid Market Revenue (Million) Forecast, by Application 2019 & 2032
- Table 34: Peru Food Grade Phosphoric Acid Market Revenue (Million) Forecast, by Application 2019 & 2032
- Table 35: Chile Food Grade Phosphoric Acid Market Revenue (Million) Forecast, by Application 2019 & 2032
- Table 36: Colombia Food Grade Phosphoric Acid Market Revenue (Million) Forecast, by Application 2019 & 2032
- Table 37: Ecuador Food Grade Phosphoric Acid Market Revenue (Million) Forecast, by Application 2019 & 2032
- Table 38: Venezuela Food Grade Phosphoric Acid Market Revenue (Million) Forecast, by Application 2019 & 2032
- Table 39: Rest of South America Food Grade Phosphoric Acid Market Revenue (Million) Forecast, by Application 2019 & 2032
- Table 40: Global Food Grade Phosphoric Acid Market Revenue Million Forecast, by Country 2019 & 2032
- Table 41: United States Food Grade Phosphoric Acid Market Revenue (Million) Forecast, by Application 2019 & 2032
- Table 42: Canada Food Grade Phosphoric Acid Market Revenue (Million) Forecast, by Application 2019 & 2032
- Table 43: Mexico Food Grade Phosphoric Acid Market Revenue (Million) Forecast, by Application 2019 & 2032
- Table 44: Global Food Grade Phosphoric Acid Market Revenue Million Forecast, by Country 2019 & 2032
- Table 45: United Arab Emirates Food Grade Phosphoric Acid Market Revenue (Million) Forecast, by Application 2019 & 2032
- Table 46: Saudi Arabia Food Grade Phosphoric Acid Market Revenue (Million) Forecast, by Application 2019 & 2032
- Table 47: South Africa Food Grade Phosphoric Acid Market Revenue (Million) Forecast, by Application 2019 & 2032
- Table 48: Rest of Middle East and Africa Food Grade Phosphoric Acid Market Revenue (Million) Forecast, by Application 2019 & 2032
- Table 49: Global Food Grade Phosphoric Acid Market Revenue Million Forecast, by Application 2019 & 2032
- Table 50: Global Food Grade Phosphoric Acid Market Revenue Million Forecast, by Country 2019 & 2032
- Table 51: United States Food Grade Phosphoric Acid Market Revenue (Million) Forecast, by Application 2019 & 2032
- Table 52: Canada Food Grade Phosphoric Acid Market Revenue (Million) Forecast, by Application 2019 & 2032
- Table 53: Mexico Food Grade Phosphoric Acid Market Revenue (Million) Forecast, by Application 2019 & 2032
- Table 54: Rest of North America Food Grade Phosphoric Acid Market Revenue (Million) Forecast, by Application 2019 & 2032
- Table 55: Global Food Grade Phosphoric Acid Market Revenue Million Forecast, by Application 2019 & 2032
- Table 56: Global Food Grade Phosphoric Acid Market Revenue Million Forecast, by Country 2019 & 2032
- Table 57: Germany Food Grade Phosphoric Acid Market Revenue (Million) Forecast, by Application 2019 & 2032
- Table 58: United Kingdom Food Grade Phosphoric Acid Market Revenue (Million) Forecast, by Application 2019 & 2032
- Table 59: Italy Food Grade Phosphoric Acid Market Revenue (Million) Forecast, by Application 2019 & 2032
- Table 60: Spain Food Grade Phosphoric Acid Market Revenue (Million) Forecast, by Application 2019 & 2032
- Table 61: France Food Grade Phosphoric Acid Market Revenue (Million) Forecast, by Application 2019 & 2032
- Table 62: Russia Food Grade Phosphoric Acid Market Revenue (Million) Forecast, by Application 2019 & 2032
- Table 63: Rest of Europe Food Grade Phosphoric Acid Market Revenue (Million) Forecast, by Application 2019 & 2032
- Table 64: Global Food Grade Phosphoric Acid Market Revenue Million Forecast, by Application 2019 & 2032
- Table 65: Global Food Grade Phosphoric Acid Market Revenue Million Forecast, by Country 2019 & 2032
- Table 66: India Food Grade Phosphoric Acid Market Revenue (Million) Forecast, by Application 2019 & 2032
- Table 67: China Food Grade Phosphoric Acid Market Revenue (Million) Forecast, by Application 2019 & 2032
- Table 68: Japan Food Grade Phosphoric Acid Market Revenue (Million) Forecast, by Application 2019 & 2032
- Table 69: Australia Food Grade Phosphoric Acid Market Revenue (Million) Forecast, by Application 2019 & 2032
- Table 70: Rest of Asia Pacific Food Grade Phosphoric Acid Market Revenue (Million) Forecast, by Application 2019 & 2032
- Table 71: Global Food Grade Phosphoric Acid Market Revenue Million Forecast, by Application 2019 & 2032
- Table 72: Global Food Grade Phosphoric Acid Market Revenue Million Forecast, by Country 2019 & 2032
- Table 73: South America Food Grade Phosphoric Acid Market Revenue (Million) Forecast, by Application 2019 & 2032
- Table 74: Middle East Food Grade Phosphoric Acid Market Revenue (Million) Forecast, by Application 2019 & 2032
- Table 75: Africa Food Grade Phosphoric Acid Market Revenue (Million) Forecast, by Application 2019 & 2032
Frequently Asked Questions
1. What is the projected Compound Annual Growth Rate (CAGR) of the Food Grade Phosphoric Acid Market?
The projected CAGR is approximately 3.44%.
2. Which companies are prominent players in the Food Grade Phosphoric Acid Market?
Key companies in the market include Merck KGaA, Emco Dyestuff Pvt Ltd, Vinipul Inorganics Private Limited*List Not Exhaustive, Prayon SA, Guangxi Qinzhou Capital Success Chemical Co Ltd, Grasim Industries Limited, Brenntag AG, Spectrum Chemical Manufacturing Corp, Nutrien Ltd, OCP SA.
3. What are the main segments of the Food Grade Phosphoric Acid Market?
The market segments include Application.
4. Can you provide details about the market size?
The market size is estimated to be USD 2.44 Million as of 2022.
5. What are some drivers contributing to market growth?
Increasing Demand for Supplement Nutrition; Growing Casein Application in Processed Food Products.
6. What are the notable trends driving market growth?
Increasing Demand as a Food Additive.
7. Are there any restraints impacting market growth?
Competition from Vegan/Plant-based Protein Powders.
8. Can you provide examples of recent developments in the market?
January 2023: Prayon, a major operator in the phosphorus industry, announced the successful acquisition of its shares in Febex, the dominant player in the phosphoric acid market in Europe, from Arkema.
9. What pricing options are available for accessing the report?
Pricing options include single-user, multi-user, and enterprise licenses priced at USD 4750, USD 5250, and USD 8750 respectively.
10. Is the market size provided in terms of value or volume?
The market size is provided in terms of value, measured in Million.
11. Are there any specific market keywords associated with the report?
Yes, the market keyword associated with the report is "Food Grade Phosphoric Acid Market," which aids in identifying and referencing the specific market segment covered.
12. How do I determine which pricing option suits my needs best?
The pricing options vary based on user requirements and access needs. Individual users may opt for single-user licenses, while businesses requiring broader access may choose multi-user or enterprise licenses for cost-effective access to the report.
13. Are there any additional resources or data provided in the Food Grade Phosphoric Acid Market report?
While the report offers comprehensive insights, it's advisable to review the specific contents or supplementary materials provided to ascertain if additional resources or data are available.
14. How can I stay updated on further developments or reports in the Food Grade Phosphoric Acid Market?
To stay informed about further developments, trends, and reports in the Food Grade Phosphoric Acid Market, consider subscribing to industry newsletters, following relevant companies and organizations, or regularly checking reputable industry news sources and publications.
Methodology
Step 1 - Identification of Relevant Samples Size from Population Database


Step 2 - Approaches for Defining Global Market Size (Value, Volume* & Price*)

Note*: In applicable scenarios
Step 3 - Data Sources
Primary Research
- Web Analytics
- Survey Reports
- Research Institute
- Latest Research Reports
- Opinion Leaders
Secondary Research
- Annual Reports
- White Paper
- Latest Press Release
- Industry Association
- Paid Database
- Investor Presentations

Step 4 - Data Triangulation
Involves using different sources of information in order to increase the validity of a study
These sources are likely to be stakeholders in a program - participants, other researchers, program staff, other community members, and so on.
Then we put all data in single framework & apply various statistical tools to find out the dynamic on the market.
During the analysis stage, feedback from the stakeholder groups would be compared to determine areas of agreement as well as areas of divergence


