
Key Insights
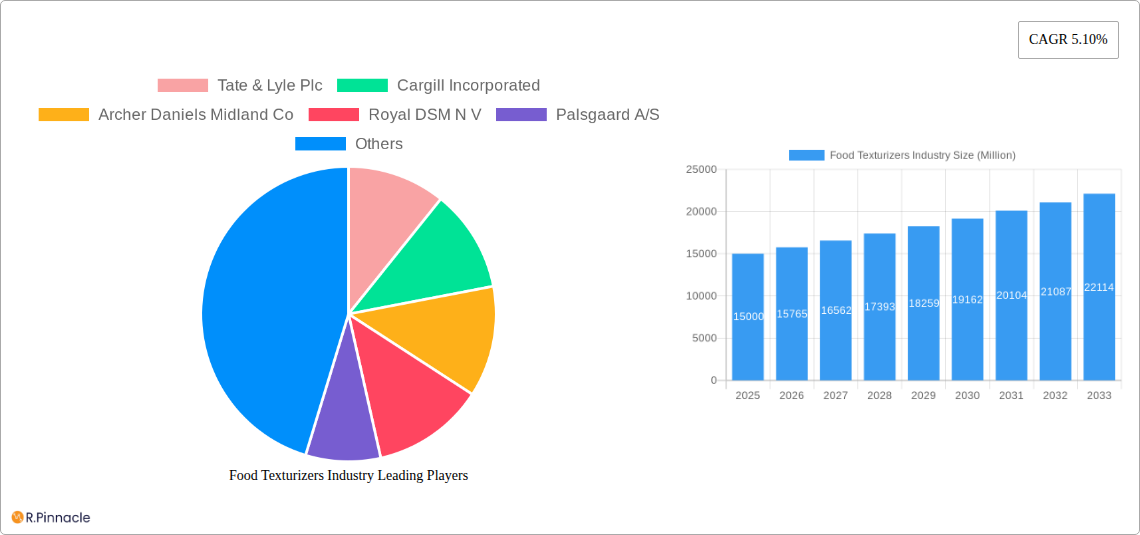
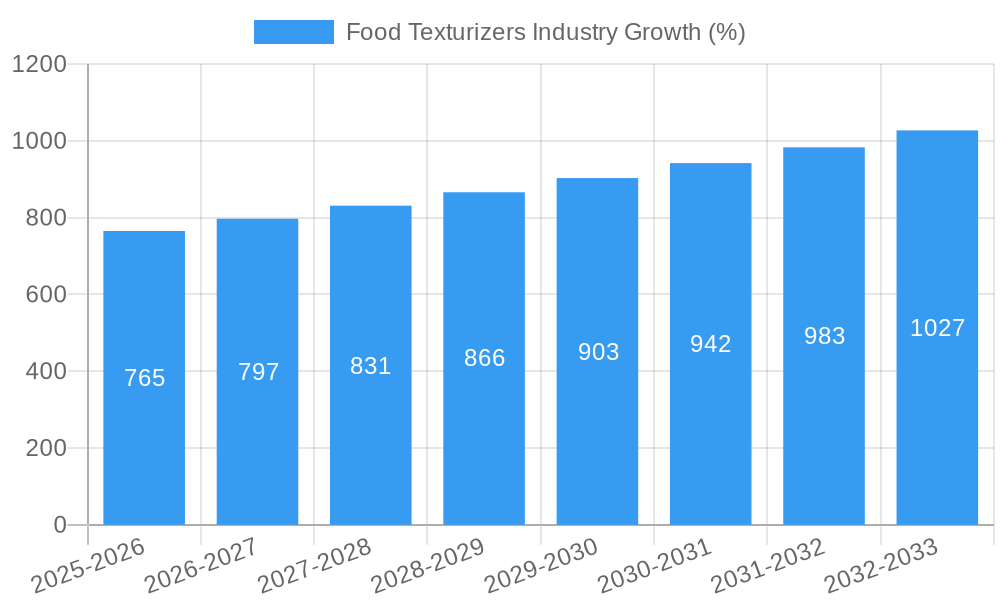
The global food texturizers market, valued at approximately $XX million in 2025, is projected to experience robust growth, exhibiting a compound annual growth rate (CAGR) of 5.10% from 2025 to 2033. This expansion is driven by several key factors. The rising demand for convenient and processed foods, coupled with increasing consumer preference for enhanced textures and mouthfeel in various food products, significantly fuels market growth. Innovation in food technology, particularly the development of novel texturizers derived from plant-based sources, caters to the growing health-conscious population seeking healthier alternatives. Furthermore, the expanding food and beverage industry, encompassing dairy products, confectionery, bakery, and ready meals, creates substantial demand for these crucial ingredients. The increasing adoption of food texturizers in meat alternatives and plant-based protein products further contributes to market expansion.
However, certain challenges exist. Fluctuations in raw material prices, particularly agricultural commodities used in the production of many texturizers, can impact market stability and profitability. Stringent regulatory frameworks surrounding food additives in different regions might pose hurdles for manufacturers. Furthermore, the growing consumer awareness regarding the potential health implications of certain food additives necessitates the development and adoption of cleaner-label and more natural texturizer solutions. This necessitates continued innovation to cater to these changing consumer preferences and regulatory environments. The market segmentation reveals a strong demand across various applications, with dairy products & ice creams, confectionery, and bakery segments holding significant market shares. Key players such as Tate & Lyle Plc, Cargill Incorporated, and Archer Daniels Midland Co. dominate the landscape, constantly striving for innovation and market share expansion through product diversification and strategic partnerships.
Food Texturizers Industry Market Report: 2019-2033
This comprehensive report provides a detailed analysis of the global food texturizers industry, offering invaluable insights for industry professionals, investors, and strategic decision-makers. With a study period spanning 2019-2033, a base year of 2025, and a forecast period of 2025-2033, this report offers a complete overview of the market's historical performance, current state, and future trajectory. The market size is projected to reach xx Million by 2033, exhibiting a CAGR of xx% during the forecast period.
Food Texturizers Industry Market Structure & Innovation Trends
This section analyzes the competitive landscape of the food texturizers market, examining market concentration, innovation drivers, regulatory frameworks, and M&A activities. The industry is characterized by a moderately concentrated market structure, with key players such as Tate & Lyle Plc, Cargill Incorporated, Archer Daniels Midland Co., and Ingredion Inc. holding significant market share. However, the presence of numerous smaller players, particularly in regional markets, signifies a dynamic and competitive environment.
- Market Concentration: The top 5 players account for approximately xx% of the global market share in 2025, indicating a moderately consolidated market.
- Innovation Drivers: Growing consumer demand for clean-label products, health-conscious food options, and novel textures are key drivers of innovation. This has led to a surge in the development of natural and functional food texturizers.
- Regulatory Framework: Stringent food safety regulations and labeling requirements across various regions influence product development and market access. Compliance with these regulations is crucial for market success.
- Product Substitutes: Competition arises from alternative ingredients offering similar textural functionalities, necessitating continuous innovation and product differentiation.
- M&A Activities: The industry has witnessed a moderate level of mergers and acquisitions in recent years, with deal values ranging from xx Million to xx Million. These activities have primarily focused on expanding product portfolios, geographical reach, and technological capabilities. For instance, the xx Million acquisition of [Company X] by [Company Y] in [Year] significantly strengthened [Company Y]'s position in the [Specific Segment] market.
Food Texturizers Industry Market Dynamics & Trends
The global food texturizers market is experiencing robust growth, driven by several key factors. The increasing demand for convenient and ready-to-eat foods is a major catalyst, as food texturizers play a crucial role in enhancing the sensory appeal and shelf life of processed food products. Furthermore, the rising adoption of processed foods in developing economies is contributing significantly to the market expansion. Technological advancements in food processing and the development of novel texturizers with improved functionalities are further fueling market growth.
The market's growth is also shaped by evolving consumer preferences. The growing awareness of health and wellness is driving demand for clean-label and natural food texturizers. Consumers are increasingly seeking products with minimal processing and natural ingredients, which is influencing manufacturers to develop and incorporate more sustainable and healthier options into their products. The growing popularity of plant-based foods and beverages is also contributing to the demand for specific types of food texturizers, such as plant-based gums and starches.
Competitive dynamics are intense, with major players constantly innovating and expanding their product portfolios to cater to evolving consumer needs. The market is characterized by both organic and inorganic growth strategies, including new product launches, strategic partnerships, and acquisitions. The entry of new players with innovative products and technologies also influences the competitive landscape, increasing competition and innovation.
Dominant Regions & Segments in Food Texturizers Industry
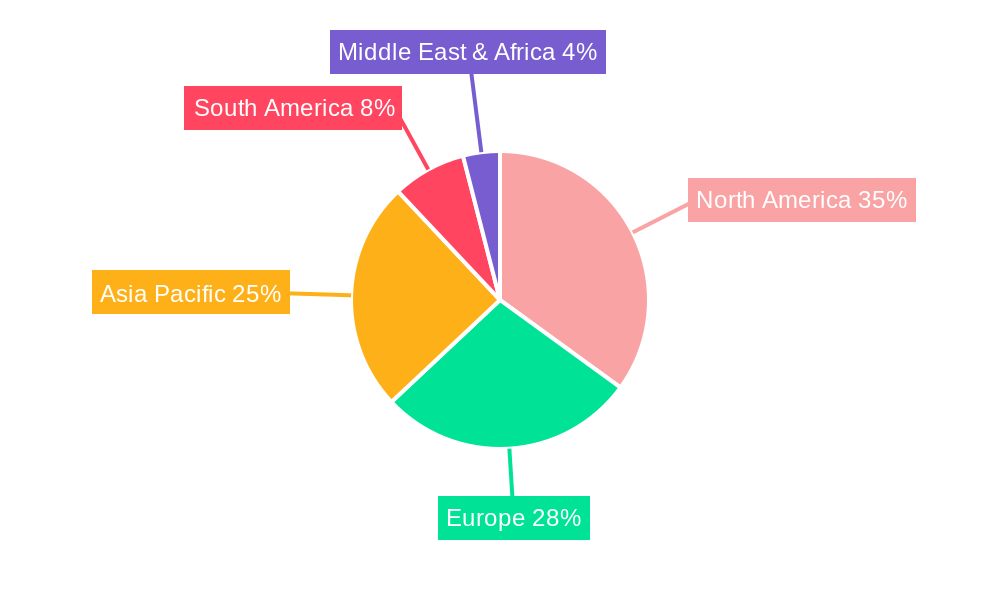
The food texturizers market exhibits regional variations in terms of growth and segment dominance. North America and Europe currently hold significant market shares, driven by high processed food consumption and strong regulatory frameworks. However, the Asia-Pacific region is poised for significant growth, fueled by rising disposable incomes and increasing demand for convenient foods.
- Leading Regions: North America and Europe currently dominate the market, followed by the Asia-Pacific region experiencing rapid growth.
- Dominant Segments:
- By Type: Starch and cellulose derivatives are currently the leading segments, owing to their widespread application and cost-effectiveness. However, the demand for natural gums and pectins is also growing rapidly.
- By Application: Dairy products and ice creams, confectionery, and bakery products represent major application segments, driven by their extensive usage of food texturizers to enhance sensory qualities and stability.
Key Drivers by Region:
- North America: Strong regulatory frameworks, high processed food consumption, and well-established supply chains.
- Europe: Similar factors to North America, along with a focus on clean-label and sustainable products.
- Asia-Pacific: Rising disposable incomes, increasing urbanization, and a burgeoning processed food industry.
Food Texturizers Industry Product Innovations
Recent innovations in the food texturizers industry are focused on developing clean-label, natural, and functional ingredients. Manufacturers are increasingly incorporating plant-based and sustainably sourced ingredients to meet the growing demand for healthier and more environmentally friendly products. This includes the development of novel texturizers with improved functionalities, such as enhanced viscosity, stability, and texture modification capabilities. Examples include the use of modified starches for improved freeze-thaw stability and the application of plant-based proteins for enhanced texture in meat alternatives. These innovations address specific market needs, improving the quality, functionality, and sustainability of food products.
Report Scope & Segmentation Analysis
This report comprehensively segments the food texturizers market by type (Cellulose Derivatives, Gums, Pectins, Gelatins, Starch, Inulin, Dextrins, Other Types) and application (Dairy Products & Ice Creams, Confectionery, Jams, Layers, Fillings, Bakery, Meat Products, Ready Meals, Sauces, Beverages, Other Applications). Each segment's growth projection, market size (in Million USD), and competitive dynamics are analyzed in detail. The market size for each segment is projected to grow at a varying CAGR during the forecast period, reflecting the dynamic nature of the food texturizers industry.
Key Drivers of Food Texturizers Industry Growth
The growth of the food texturizers market is propelled by several key factors, including the increasing demand for convenient and processed foods, the rising popularity of clean-label and natural ingredients, and the development of innovative texturizers with enhanced functionalities. The expansion of the global food and beverage industry is also a significant growth driver, creating a robust demand for ingredients that enhance the texture, stability, and sensory appeal of food products. Furthermore, advancements in food processing technology have facilitated the wider adoption of food texturizers across diverse applications.
Challenges in the Food Texturizers Industry Sector
The food texturizers industry faces certain challenges, including stringent regulatory compliance requirements, fluctuating raw material prices, and intense competition. Meeting the demands of varying regulatory standards across different geographical regions adds complexity and cost to production and distribution. The price volatility of raw materials, such as starch and gums, can impact manufacturers' profit margins and requires effective supply chain management strategies. Finally, the presence of numerous players, both large and small, creates a competitive market, requiring constant innovation and product differentiation to maintain market share.
Emerging Opportunities in Food Texturizers Industry
The food texturizers market presents significant opportunities for growth and innovation. The growing interest in plant-based foods and alternative protein sources creates substantial demand for texturizers that can mimic the texture of traditional animal-based products. The development of novel texturizers derived from sustainable and renewable sources is another key opportunity area, responding to growing consumer demand for eco-friendly products. Finally, expansion into emerging markets with growing processed food consumption presents significant growth potential.
Leading Players in the Food Texturizers Industry Market
- Tate & Lyle Plc
- Cargill Incorporated
- Archer Daniels Midland Co
- Royal DSM N V
- Palsgaard A/S
- Kerry Inc
- Ingredion Inc
- DuPont
- Fiberstar Inc
- Estelle Chemicals Pvt Ltd
Key Developments in Food Texturizers Industry
- October 2021: Cargill Incorporated launched SimPure rice flour, a clean-label bulking agent, expanding its product portfolio and catering to the growing demand for clean-label ingredients.
- April 2022: Cargill Salt announced a USD 68 billion investment to expand its ST. Clair Plant, enhancing production capacity and efficiency through automation and new technology. This significant investment underscores the industry's growth and commitment to technological advancement.
Future Outlook for Food Texturizers Industry Market
The future outlook for the food texturizers market is highly promising, driven by sustained growth in the food and beverage sector, increasing demand for convenient and processed foods, and the ongoing development of innovative and sustainable texturizers. The market is expected to experience continued expansion, with specific segments, like plant-based texturizers, experiencing particularly rapid growth. Strategic partnerships and investments in research and development will play a vital role in shaping the future of the industry, leading to further advancements and market expansion.
Food Texturizers Industry Segmentation
-
1. Type
- 1.1. Cellulose Derivatives
- 1.2. Gums
- 1.3. Pectins
- 1.4. Gelatins
- 1.5. Starch
- 1.6. Inulin
- 1.7. Dextrins
- 1.8. Other Types
-
2. Application
- 2.1. Dairy Products & Ice Creams
- 2.2. Confectionery
- 2.3. Jams
- 2.4. Layers
- 2.5. Fillings
- 2.6. Bakery
- 2.7. Meat Products
- 2.8. Ready Meals
- 2.9. Sauces
- 2.10. Beverages
- 2.11. Other Applications
Food Texturizers Industry Segmentation By Geography
-
1. North America
- 1.1. United States
- 1.2. Canada
- 1.3. Mexico
- 1.4. Rest of North America
-
2. Europe
- 2.1. United Kingdom
- 2.2. Germany
- 2.3. France
- 2.4. Russia
- 2.5. Italy
- 2.6. Spain
- 2.7. Rest of Europe
-
3. Asia Pacific
- 3.1. India
- 3.2. China
- 3.3. Japan
- 3.4. Australia
- 3.5. Rest of Asia Pacific
-
4. South America
- 4.1. Brazil
- 4.2. Argentina
- 4.3. Rest of South America
- 5. Middle East
-
6. South Africa
- 6.1. Saudi Arabia
- 6.2. Rest of Middle East
Food Texturizers Industry REPORT HIGHLIGHTS
| Aspects | Details |
|---|---|
| Study Period | 2019-2033 |
| Base Year | 2024 |
| Estimated Year | 2025 |
| Forecast Period | 2025-2033 |
| Historical Period | 2019-2024 |
| Growth Rate | CAGR of 5.10% from 2019-2033 |
| Segmentation |
|
Table of Contents
- 1. Introduction
- 1.1. Research Scope
- 1.2. Market Segmentation
- 1.3. Research Methodology
- 1.4. Definitions and Assumptions
- 2. Executive Summary
- 2.1. Introduction
- 3. Market Dynamics
- 3.1. Introduction
- 3.2. Market Drivers
- 3.2.1. Rising Incidence of Obesity and Cadiovascular Diseases; Growing Trend of Veganism Drives the Market
- 3.3. Market Restrains
- 3.3.1. Associated Allergies With Plant Proteins
- 3.4. Market Trends
- 3.4.1. Growing Demand for Low Calorie Food Products
- 4. Market Factor Analysis
- 4.1. Porters Five Forces
- 4.2. Supply/Value Chain
- 4.3. PESTEL analysis
- 4.4. Market Entropy
- 4.5. Patent/Trademark Analysis
- 5. Global Food Texturizers Industry Analysis, Insights and Forecast, 2019-2031
- 5.1. Market Analysis, Insights and Forecast - by Type
- 5.1.1. Cellulose Derivatives
- 5.1.2. Gums
- 5.1.3. Pectins
- 5.1.4. Gelatins
- 5.1.5. Starch
- 5.1.6. Inulin
- 5.1.7. Dextrins
- 5.1.8. Other Types
- 5.2. Market Analysis, Insights and Forecast - by Application
- 5.2.1. Dairy Products & Ice Creams
- 5.2.2. Confectionery
- 5.2.3. Jams
- 5.2.4. Layers
- 5.2.5. Fillings
- 5.2.6. Bakery
- 5.2.7. Meat Products
- 5.2.8. Ready Meals
- 5.2.9. Sauces
- 5.2.10. Beverages
- 5.2.11. Other Applications
- 5.3. Market Analysis, Insights and Forecast - by Region
- 5.3.1. North America
- 5.3.2. Europe
- 5.3.3. Asia Pacific
- 5.3.4. South America
- 5.3.5. Middle East
- 5.3.6. South Africa
- 5.1. Market Analysis, Insights and Forecast - by Type
- 6. North America Food Texturizers Industry Analysis, Insights and Forecast, 2019-2031
- 6.1. Market Analysis, Insights and Forecast - by Type
- 6.1.1. Cellulose Derivatives
- 6.1.2. Gums
- 6.1.3. Pectins
- 6.1.4. Gelatins
- 6.1.5. Starch
- 6.1.6. Inulin
- 6.1.7. Dextrins
- 6.1.8. Other Types
- 6.2. Market Analysis, Insights and Forecast - by Application
- 6.2.1. Dairy Products & Ice Creams
- 6.2.2. Confectionery
- 6.2.3. Jams
- 6.2.4. Layers
- 6.2.5. Fillings
- 6.2.6. Bakery
- 6.2.7. Meat Products
- 6.2.8. Ready Meals
- 6.2.9. Sauces
- 6.2.10. Beverages
- 6.2.11. Other Applications
- 6.1. Market Analysis, Insights and Forecast - by Type
- 7. Europe Food Texturizers Industry Analysis, Insights and Forecast, 2019-2031
- 7.1. Market Analysis, Insights and Forecast - by Type
- 7.1.1. Cellulose Derivatives
- 7.1.2. Gums
- 7.1.3. Pectins
- 7.1.4. Gelatins
- 7.1.5. Starch
- 7.1.6. Inulin
- 7.1.7. Dextrins
- 7.1.8. Other Types
- 7.2. Market Analysis, Insights and Forecast - by Application
- 7.2.1. Dairy Products & Ice Creams
- 7.2.2. Confectionery
- 7.2.3. Jams
- 7.2.4. Layers
- 7.2.5. Fillings
- 7.2.6. Bakery
- 7.2.7. Meat Products
- 7.2.8. Ready Meals
- 7.2.9. Sauces
- 7.2.10. Beverages
- 7.2.11. Other Applications
- 7.1. Market Analysis, Insights and Forecast - by Type
- 8. Asia Pacific Food Texturizers Industry Analysis, Insights and Forecast, 2019-2031
- 8.1. Market Analysis, Insights and Forecast - by Type
- 8.1.1. Cellulose Derivatives
- 8.1.2. Gums
- 8.1.3. Pectins
- 8.1.4. Gelatins
- 8.1.5. Starch
- 8.1.6. Inulin
- 8.1.7. Dextrins
- 8.1.8. Other Types
- 8.2. Market Analysis, Insights and Forecast - by Application
- 8.2.1. Dairy Products & Ice Creams
- 8.2.2. Confectionery
- 8.2.3. Jams
- 8.2.4. Layers
- 8.2.5. Fillings
- 8.2.6. Bakery
- 8.2.7. Meat Products
- 8.2.8. Ready Meals
- 8.2.9. Sauces
- 8.2.10. Beverages
- 8.2.11. Other Applications
- 8.1. Market Analysis, Insights and Forecast - by Type
- 9. South America Food Texturizers Industry Analysis, Insights and Forecast, 2019-2031
- 9.1. Market Analysis, Insights and Forecast - by Type
- 9.1.1. Cellulose Derivatives
- 9.1.2. Gums
- 9.1.3. Pectins
- 9.1.4. Gelatins
- 9.1.5. Starch
- 9.1.6. Inulin
- 9.1.7. Dextrins
- 9.1.8. Other Types
- 9.2. Market Analysis, Insights and Forecast - by Application
- 9.2.1. Dairy Products & Ice Creams
- 9.2.2. Confectionery
- 9.2.3. Jams
- 9.2.4. Layers
- 9.2.5. Fillings
- 9.2.6. Bakery
- 9.2.7. Meat Products
- 9.2.8. Ready Meals
- 9.2.9. Sauces
- 9.2.10. Beverages
- 9.2.11. Other Applications
- 9.1. Market Analysis, Insights and Forecast - by Type
- 10. Middle East Food Texturizers Industry Analysis, Insights and Forecast, 2019-2031
- 10.1. Market Analysis, Insights and Forecast - by Type
- 10.1.1. Cellulose Derivatives
- 10.1.2. Gums
- 10.1.3. Pectins
- 10.1.4. Gelatins
- 10.1.5. Starch
- 10.1.6. Inulin
- 10.1.7. Dextrins
- 10.1.8. Other Types
- 10.2. Market Analysis, Insights and Forecast - by Application
- 10.2.1. Dairy Products & Ice Creams
- 10.2.2. Confectionery
- 10.2.3. Jams
- 10.2.4. Layers
- 10.2.5. Fillings
- 10.2.6. Bakery
- 10.2.7. Meat Products
- 10.2.8. Ready Meals
- 10.2.9. Sauces
- 10.2.10. Beverages
- 10.2.11. Other Applications
- 10.1. Market Analysis, Insights and Forecast - by Type
- 11. South Africa Food Texturizers Industry Analysis, Insights and Forecast, 2019-2031
- 11.1. Market Analysis, Insights and Forecast - by Type
- 11.1.1. Cellulose Derivatives
- 11.1.2. Gums
- 11.1.3. Pectins
- 11.1.4. Gelatins
- 11.1.5. Starch
- 11.1.6. Inulin
- 11.1.7. Dextrins
- 11.1.8. Other Types
- 11.2. Market Analysis, Insights and Forecast - by Application
- 11.2.1. Dairy Products & Ice Creams
- 11.2.2. Confectionery
- 11.2.3. Jams
- 11.2.4. Layers
- 11.2.5. Fillings
- 11.2.6. Bakery
- 11.2.7. Meat Products
- 11.2.8. Ready Meals
- 11.2.9. Sauces
- 11.2.10. Beverages
- 11.2.11. Other Applications
- 11.1. Market Analysis, Insights and Forecast - by Type
- 12. North America Food Texturizers Industry Analysis, Insights and Forecast, 2019-2031
- 12.1. Market Analysis, Insights and Forecast - By Country/Sub-region
- 12.1.1 United States
- 12.1.2 Canada
- 12.1.3 Mexico
- 12.1.4 Rest of North America
- 13. Europe Food Texturizers Industry Analysis, Insights and Forecast, 2019-2031
- 13.1. Market Analysis, Insights and Forecast - By Country/Sub-region
- 13.1.1 United Kingdom
- 13.1.2 Germany
- 13.1.3 France
- 13.1.4 Russia
- 13.1.5 Italy
- 13.1.6 Spain
- 13.1.7 Rest of Europe
- 14. Asia Pacific Food Texturizers Industry Analysis, Insights and Forecast, 2019-2031
- 14.1. Market Analysis, Insights and Forecast - By Country/Sub-region
- 14.1.1 India
- 14.1.2 China
- 14.1.3 Japan
- 14.1.4 Australia
- 14.1.5 Rest of Asia Pacific
- 15. South America Food Texturizers Industry Analysis, Insights and Forecast, 2019-2031
- 15.1. Market Analysis, Insights and Forecast - By Country/Sub-region
- 15.1.1 Brazil
- 15.1.2 Argentina
- 15.1.3 Rest of South America
- 16. Middle East Food Texturizers Industry Analysis, Insights and Forecast, 2019-2031
- 16.1. Market Analysis, Insights and Forecast - By Country/Sub-region
- 16.1.1.
- 17. South Africa Food Texturizers Industry Analysis, Insights and Forecast, 2019-2031
- 17.1. Market Analysis, Insights and Forecast - By Country/Sub-region
- 17.1.1 Saudi Arabia
- 17.1.2 Rest of Middle East
- 18. Competitive Analysis
- 18.1. Global Market Share Analysis 2024
- 18.2. Company Profiles
- 18.2.1 Tate & Lyle Plc
- 18.2.1.1. Overview
- 18.2.1.2. Products
- 18.2.1.3. SWOT Analysis
- 18.2.1.4. Recent Developments
- 18.2.1.5. Financials (Based on Availability)
- 18.2.2 Cargill Incorporated
- 18.2.2.1. Overview
- 18.2.2.2. Products
- 18.2.2.3. SWOT Analysis
- 18.2.2.4. Recent Developments
- 18.2.2.5. Financials (Based on Availability)
- 18.2.3 Archer Daniels Midland Co
- 18.2.3.1. Overview
- 18.2.3.2. Products
- 18.2.3.3. SWOT Analysis
- 18.2.3.4. Recent Developments
- 18.2.3.5. Financials (Based on Availability)
- 18.2.4 Royal DSM N V
- 18.2.4.1. Overview
- 18.2.4.2. Products
- 18.2.4.3. SWOT Analysis
- 18.2.4.4. Recent Developments
- 18.2.4.5. Financials (Based on Availability)
- 18.2.5 Palsgaard A/S
- 18.2.5.1. Overview
- 18.2.5.2. Products
- 18.2.5.3. SWOT Analysis
- 18.2.5.4. Recent Developments
- 18.2.5.5. Financials (Based on Availability)
- 18.2.6 Kerry Inc
- 18.2.6.1. Overview
- 18.2.6.2. Products
- 18.2.6.3. SWOT Analysis
- 18.2.6.4. Recent Developments
- 18.2.6.5. Financials (Based on Availability)
- 18.2.7 Ingredion Inc
- 18.2.7.1. Overview
- 18.2.7.2. Products
- 18.2.7.3. SWOT Analysis
- 18.2.7.4. Recent Developments
- 18.2.7.5. Financials (Based on Availability)
- 18.2.8 DuPont
- 18.2.8.1. Overview
- 18.2.8.2. Products
- 18.2.8.3. SWOT Analysis
- 18.2.8.4. Recent Developments
- 18.2.8.5. Financials (Based on Availability)
- 18.2.9 Fiberstar Inc *List Not Exhaustive
- 18.2.9.1. Overview
- 18.2.9.2. Products
- 18.2.9.3. SWOT Analysis
- 18.2.9.4. Recent Developments
- 18.2.9.5. Financials (Based on Availability)
- 18.2.10 Estelle Chemicals Pvt Ltd
- 18.2.10.1. Overview
- 18.2.10.2. Products
- 18.2.10.3. SWOT Analysis
- 18.2.10.4. Recent Developments
- 18.2.10.5. Financials (Based on Availability)
- 18.2.1 Tate & Lyle Plc
List of Figures
- Figure 1: Global Food Texturizers Industry Revenue Breakdown (Million, %) by Region 2024 & 2032
- Figure 2: Global Food Texturizers Industry Volume Breakdown (K Tons, %) by Region 2024 & 2032
- Figure 3: North America Food Texturizers Industry Revenue (Million), by Country 2024 & 2032
- Figure 4: North America Food Texturizers Industry Volume (K Tons), by Country 2024 & 2032
- Figure 5: North America Food Texturizers Industry Revenue Share (%), by Country 2024 & 2032
- Figure 6: North America Food Texturizers Industry Volume Share (%), by Country 2024 & 2032
- Figure 7: Europe Food Texturizers Industry Revenue (Million), by Country 2024 & 2032
- Figure 8: Europe Food Texturizers Industry Volume (K Tons), by Country 2024 & 2032
- Figure 9: Europe Food Texturizers Industry Revenue Share (%), by Country 2024 & 2032
- Figure 10: Europe Food Texturizers Industry Volume Share (%), by Country 2024 & 2032
- Figure 11: Asia Pacific Food Texturizers Industry Revenue (Million), by Country 2024 & 2032
- Figure 12: Asia Pacific Food Texturizers Industry Volume (K Tons), by Country 2024 & 2032
- Figure 13: Asia Pacific Food Texturizers Industry Revenue Share (%), by Country 2024 & 2032
- Figure 14: Asia Pacific Food Texturizers Industry Volume Share (%), by Country 2024 & 2032
- Figure 15: South America Food Texturizers Industry Revenue (Million), by Country 2024 & 2032
- Figure 16: South America Food Texturizers Industry Volume (K Tons), by Country 2024 & 2032
- Figure 17: South America Food Texturizers Industry Revenue Share (%), by Country 2024 & 2032
- Figure 18: South America Food Texturizers Industry Volume Share (%), by Country 2024 & 2032
- Figure 19: Middle East Food Texturizers Industry Revenue (Million), by Country 2024 & 2032
- Figure 20: Middle East Food Texturizers Industry Volume (K Tons), by Country 2024 & 2032
- Figure 21: Middle East Food Texturizers Industry Revenue Share (%), by Country 2024 & 2032
- Figure 22: Middle East Food Texturizers Industry Volume Share (%), by Country 2024 & 2032
- Figure 23: South Africa Food Texturizers Industry Revenue (Million), by Country 2024 & 2032
- Figure 24: South Africa Food Texturizers Industry Volume (K Tons), by Country 2024 & 2032
- Figure 25: South Africa Food Texturizers Industry Revenue Share (%), by Country 2024 & 2032
- Figure 26: South Africa Food Texturizers Industry Volume Share (%), by Country 2024 & 2032
- Figure 27: North America Food Texturizers Industry Revenue (Million), by Type 2024 & 2032
- Figure 28: North America Food Texturizers Industry Volume (K Tons), by Type 2024 & 2032
- Figure 29: North America Food Texturizers Industry Revenue Share (%), by Type 2024 & 2032
- Figure 30: North America Food Texturizers Industry Volume Share (%), by Type 2024 & 2032
- Figure 31: North America Food Texturizers Industry Revenue (Million), by Application 2024 & 2032
- Figure 32: North America Food Texturizers Industry Volume (K Tons), by Application 2024 & 2032
- Figure 33: North America Food Texturizers Industry Revenue Share (%), by Application 2024 & 2032
- Figure 34: North America Food Texturizers Industry Volume Share (%), by Application 2024 & 2032
- Figure 35: North America Food Texturizers Industry Revenue (Million), by Country 2024 & 2032
- Figure 36: North America Food Texturizers Industry Volume (K Tons), by Country 2024 & 2032
- Figure 37: North America Food Texturizers Industry Revenue Share (%), by Country 2024 & 2032
- Figure 38: North America Food Texturizers Industry Volume Share (%), by Country 2024 & 2032
- Figure 39: Europe Food Texturizers Industry Revenue (Million), by Type 2024 & 2032
- Figure 40: Europe Food Texturizers Industry Volume (K Tons), by Type 2024 & 2032
- Figure 41: Europe Food Texturizers Industry Revenue Share (%), by Type 2024 & 2032
- Figure 42: Europe Food Texturizers Industry Volume Share (%), by Type 2024 & 2032
- Figure 43: Europe Food Texturizers Industry Revenue (Million), by Application 2024 & 2032
- Figure 44: Europe Food Texturizers Industry Volume (K Tons), by Application 2024 & 2032
- Figure 45: Europe Food Texturizers Industry Revenue Share (%), by Application 2024 & 2032
- Figure 46: Europe Food Texturizers Industry Volume Share (%), by Application 2024 & 2032
- Figure 47: Europe Food Texturizers Industry Revenue (Million), by Country 2024 & 2032
- Figure 48: Europe Food Texturizers Industry Volume (K Tons), by Country 2024 & 2032
- Figure 49: Europe Food Texturizers Industry Revenue Share (%), by Country 2024 & 2032
- Figure 50: Europe Food Texturizers Industry Volume Share (%), by Country 2024 & 2032
- Figure 51: Asia Pacific Food Texturizers Industry Revenue (Million), by Type 2024 & 2032
- Figure 52: Asia Pacific Food Texturizers Industry Volume (K Tons), by Type 2024 & 2032
- Figure 53: Asia Pacific Food Texturizers Industry Revenue Share (%), by Type 2024 & 2032
- Figure 54: Asia Pacific Food Texturizers Industry Volume Share (%), by Type 2024 & 2032
- Figure 55: Asia Pacific Food Texturizers Industry Revenue (Million), by Application 2024 & 2032
- Figure 56: Asia Pacific Food Texturizers Industry Volume (K Tons), by Application 2024 & 2032
- Figure 57: Asia Pacific Food Texturizers Industry Revenue Share (%), by Application 2024 & 2032
- Figure 58: Asia Pacific Food Texturizers Industry Volume Share (%), by Application 2024 & 2032
- Figure 59: Asia Pacific Food Texturizers Industry Revenue (Million), by Country 2024 & 2032
- Figure 60: Asia Pacific Food Texturizers Industry Volume (K Tons), by Country 2024 & 2032
- Figure 61: Asia Pacific Food Texturizers Industry Revenue Share (%), by Country 2024 & 2032
- Figure 62: Asia Pacific Food Texturizers Industry Volume Share (%), by Country 2024 & 2032
- Figure 63: South America Food Texturizers Industry Revenue (Million), by Type 2024 & 2032
- Figure 64: South America Food Texturizers Industry Volume (K Tons), by Type 2024 & 2032
- Figure 65: South America Food Texturizers Industry Revenue Share (%), by Type 2024 & 2032
- Figure 66: South America Food Texturizers Industry Volume Share (%), by Type 2024 & 2032
- Figure 67: South America Food Texturizers Industry Revenue (Million), by Application 2024 & 2032
- Figure 68: South America Food Texturizers Industry Volume (K Tons), by Application 2024 & 2032
- Figure 69: South America Food Texturizers Industry Revenue Share (%), by Application 2024 & 2032
- Figure 70: South America Food Texturizers Industry Volume Share (%), by Application 2024 & 2032
- Figure 71: South America Food Texturizers Industry Revenue (Million), by Country 2024 & 2032
- Figure 72: South America Food Texturizers Industry Volume (K Tons), by Country 2024 & 2032
- Figure 73: South America Food Texturizers Industry Revenue Share (%), by Country 2024 & 2032
- Figure 74: South America Food Texturizers Industry Volume Share (%), by Country 2024 & 2032
- Figure 75: Middle East Food Texturizers Industry Revenue (Million), by Type 2024 & 2032
- Figure 76: Middle East Food Texturizers Industry Volume (K Tons), by Type 2024 & 2032
- Figure 77: Middle East Food Texturizers Industry Revenue Share (%), by Type 2024 & 2032
- Figure 78: Middle East Food Texturizers Industry Volume Share (%), by Type 2024 & 2032
- Figure 79: Middle East Food Texturizers Industry Revenue (Million), by Application 2024 & 2032
- Figure 80: Middle East Food Texturizers Industry Volume (K Tons), by Application 2024 & 2032
- Figure 81: Middle East Food Texturizers Industry Revenue Share (%), by Application 2024 & 2032
- Figure 82: Middle East Food Texturizers Industry Volume Share (%), by Application 2024 & 2032
- Figure 83: Middle East Food Texturizers Industry Revenue (Million), by Country 2024 & 2032
- Figure 84: Middle East Food Texturizers Industry Volume (K Tons), by Country 2024 & 2032
- Figure 85: Middle East Food Texturizers Industry Revenue Share (%), by Country 2024 & 2032
- Figure 86: Middle East Food Texturizers Industry Volume Share (%), by Country 2024 & 2032
- Figure 87: South Africa Food Texturizers Industry Revenue (Million), by Type 2024 & 2032
- Figure 88: South Africa Food Texturizers Industry Volume (K Tons), by Type 2024 & 2032
- Figure 89: South Africa Food Texturizers Industry Revenue Share (%), by Type 2024 & 2032
- Figure 90: South Africa Food Texturizers Industry Volume Share (%), by Type 2024 & 2032
- Figure 91: South Africa Food Texturizers Industry Revenue (Million), by Application 2024 & 2032
- Figure 92: South Africa Food Texturizers Industry Volume (K Tons), by Application 2024 & 2032
- Figure 93: South Africa Food Texturizers Industry Revenue Share (%), by Application 2024 & 2032
- Figure 94: South Africa Food Texturizers Industry Volume Share (%), by Application 2024 & 2032
- Figure 95: South Africa Food Texturizers Industry Revenue (Million), by Country 2024 & 2032
- Figure 96: South Africa Food Texturizers Industry Volume (K Tons), by Country 2024 & 2032
- Figure 97: South Africa Food Texturizers Industry Revenue Share (%), by Country 2024 & 2032
- Figure 98: South Africa Food Texturizers Industry Volume Share (%), by Country 2024 & 2032
List of Tables
- Table 1: Global Food Texturizers Industry Revenue Million Forecast, by Region 2019 & 2032
- Table 2: Global Food Texturizers Industry Volume K Tons Forecast, by Region 2019 & 2032
- Table 3: Global Food Texturizers Industry Revenue Million Forecast, by Type 2019 & 2032
- Table 4: Global Food Texturizers Industry Volume K Tons Forecast, by Type 2019 & 2032
- Table 5: Global Food Texturizers Industry Revenue Million Forecast, by Application 2019 & 2032
- Table 6: Global Food Texturizers Industry Volume K Tons Forecast, by Application 2019 & 2032
- Table 7: Global Food Texturizers Industry Revenue Million Forecast, by Region 2019 & 2032
- Table 8: Global Food Texturizers Industry Volume K Tons Forecast, by Region 2019 & 2032
- Table 9: Global Food Texturizers Industry Revenue Million Forecast, by Country 2019 & 2032
- Table 10: Global Food Texturizers Industry Volume K Tons Forecast, by Country 2019 & 2032
- Table 11: United States Food Texturizers Industry Revenue (Million) Forecast, by Application 2019 & 2032
- Table 12: United States Food Texturizers Industry Volume (K Tons) Forecast, by Application 2019 & 2032
- Table 13: Canada Food Texturizers Industry Revenue (Million) Forecast, by Application 2019 & 2032
- Table 14: Canada Food Texturizers Industry Volume (K Tons) Forecast, by Application 2019 & 2032
- Table 15: Mexico Food Texturizers Industry Revenue (Million) Forecast, by Application 2019 & 2032
- Table 16: Mexico Food Texturizers Industry Volume (K Tons) Forecast, by Application 2019 & 2032
- Table 17: Rest of North America Food Texturizers Industry Revenue (Million) Forecast, by Application 2019 & 2032
- Table 18: Rest of North America Food Texturizers Industry Volume (K Tons) Forecast, by Application 2019 & 2032
- Table 19: Global Food Texturizers Industry Revenue Million Forecast, by Country 2019 & 2032
- Table 20: Global Food Texturizers Industry Volume K Tons Forecast, by Country 2019 & 2032
- Table 21: United Kingdom Food Texturizers Industry Revenue (Million) Forecast, by Application 2019 & 2032
- Table 22: United Kingdom Food Texturizers Industry Volume (K Tons) Forecast, by Application 2019 & 2032
- Table 23: Germany Food Texturizers Industry Revenue (Million) Forecast, by Application 2019 & 2032
- Table 24: Germany Food Texturizers Industry Volume (K Tons) Forecast, by Application 2019 & 2032
- Table 25: France Food Texturizers Industry Revenue (Million) Forecast, by Application 2019 & 2032
- Table 26: France Food Texturizers Industry Volume (K Tons) Forecast, by Application 2019 & 2032
- Table 27: Russia Food Texturizers Industry Revenue (Million) Forecast, by Application 2019 & 2032
- Table 28: Russia Food Texturizers Industry Volume (K Tons) Forecast, by Application 2019 & 2032
- Table 29: Italy Food Texturizers Industry Revenue (Million) Forecast, by Application 2019 & 2032
- Table 30: Italy Food Texturizers Industry Volume (K Tons) Forecast, by Application 2019 & 2032
- Table 31: Spain Food Texturizers Industry Revenue (Million) Forecast, by Application 2019 & 2032
- Table 32: Spain Food Texturizers Industry Volume (K Tons) Forecast, by Application 2019 & 2032
- Table 33: Rest of Europe Food Texturizers Industry Revenue (Million) Forecast, by Application 2019 & 2032
- Table 34: Rest of Europe Food Texturizers Industry Volume (K Tons) Forecast, by Application 2019 & 2032
- Table 35: Global Food Texturizers Industry Revenue Million Forecast, by Country 2019 & 2032
- Table 36: Global Food Texturizers Industry Volume K Tons Forecast, by Country 2019 & 2032
- Table 37: India Food Texturizers Industry Revenue (Million) Forecast, by Application 2019 & 2032
- Table 38: India Food Texturizers Industry Volume (K Tons) Forecast, by Application 2019 & 2032
- Table 39: China Food Texturizers Industry Revenue (Million) Forecast, by Application 2019 & 2032
- Table 40: China Food Texturizers Industry Volume (K Tons) Forecast, by Application 2019 & 2032
- Table 41: Japan Food Texturizers Industry Revenue (Million) Forecast, by Application 2019 & 2032
- Table 42: Japan Food Texturizers Industry Volume (K Tons) Forecast, by Application 2019 & 2032
- Table 43: Australia Food Texturizers Industry Revenue (Million) Forecast, by Application 2019 & 2032
- Table 44: Australia Food Texturizers Industry Volume (K Tons) Forecast, by Application 2019 & 2032
- Table 45: Rest of Asia Pacific Food Texturizers Industry Revenue (Million) Forecast, by Application 2019 & 2032
- Table 46: Rest of Asia Pacific Food Texturizers Industry Volume (K Tons) Forecast, by Application 2019 & 2032
- Table 47: Global Food Texturizers Industry Revenue Million Forecast, by Country 2019 & 2032
- Table 48: Global Food Texturizers Industry Volume K Tons Forecast, by Country 2019 & 2032
- Table 49: Brazil Food Texturizers Industry Revenue (Million) Forecast, by Application 2019 & 2032
- Table 50: Brazil Food Texturizers Industry Volume (K Tons) Forecast, by Application 2019 & 2032
- Table 51: Argentina Food Texturizers Industry Revenue (Million) Forecast, by Application 2019 & 2032
- Table 52: Argentina Food Texturizers Industry Volume (K Tons) Forecast, by Application 2019 & 2032
- Table 53: Rest of South America Food Texturizers Industry Revenue (Million) Forecast, by Application 2019 & 2032
- Table 54: Rest of South America Food Texturizers Industry Volume (K Tons) Forecast, by Application 2019 & 2032
- Table 55: Global Food Texturizers Industry Revenue Million Forecast, by Country 2019 & 2032
- Table 56: Global Food Texturizers Industry Volume K Tons Forecast, by Country 2019 & 2032
- Table 57: Food Texturizers Industry Revenue (Million) Forecast, by Application 2019 & 2032
- Table 58: Food Texturizers Industry Volume (K Tons) Forecast, by Application 2019 & 2032
- Table 59: Global Food Texturizers Industry Revenue Million Forecast, by Country 2019 & 2032
- Table 60: Global Food Texturizers Industry Volume K Tons Forecast, by Country 2019 & 2032
- Table 61: Saudi Arabia Food Texturizers Industry Revenue (Million) Forecast, by Application 2019 & 2032
- Table 62: Saudi Arabia Food Texturizers Industry Volume (K Tons) Forecast, by Application 2019 & 2032
- Table 63: Rest of Middle East Food Texturizers Industry Revenue (Million) Forecast, by Application 2019 & 2032
- Table 64: Rest of Middle East Food Texturizers Industry Volume (K Tons) Forecast, by Application 2019 & 2032
- Table 65: Global Food Texturizers Industry Revenue Million Forecast, by Type 2019 & 2032
- Table 66: Global Food Texturizers Industry Volume K Tons Forecast, by Type 2019 & 2032
- Table 67: Global Food Texturizers Industry Revenue Million Forecast, by Application 2019 & 2032
- Table 68: Global Food Texturizers Industry Volume K Tons Forecast, by Application 2019 & 2032
- Table 69: Global Food Texturizers Industry Revenue Million Forecast, by Country 2019 & 2032
- Table 70: Global Food Texturizers Industry Volume K Tons Forecast, by Country 2019 & 2032
- Table 71: United States Food Texturizers Industry Revenue (Million) Forecast, by Application 2019 & 2032
- Table 72: United States Food Texturizers Industry Volume (K Tons) Forecast, by Application 2019 & 2032
- Table 73: Canada Food Texturizers Industry Revenue (Million) Forecast, by Application 2019 & 2032
- Table 74: Canada Food Texturizers Industry Volume (K Tons) Forecast, by Application 2019 & 2032
- Table 75: Mexico Food Texturizers Industry Revenue (Million) Forecast, by Application 2019 & 2032
- Table 76: Mexico Food Texturizers Industry Volume (K Tons) Forecast, by Application 2019 & 2032
- Table 77: Rest of North America Food Texturizers Industry Revenue (Million) Forecast, by Application 2019 & 2032
- Table 78: Rest of North America Food Texturizers Industry Volume (K Tons) Forecast, by Application 2019 & 2032
- Table 79: Global Food Texturizers Industry Revenue Million Forecast, by Type 2019 & 2032
- Table 80: Global Food Texturizers Industry Volume K Tons Forecast, by Type 2019 & 2032
- Table 81: Global Food Texturizers Industry Revenue Million Forecast, by Application 2019 & 2032
- Table 82: Global Food Texturizers Industry Volume K Tons Forecast, by Application 2019 & 2032
- Table 83: Global Food Texturizers Industry Revenue Million Forecast, by Country 2019 & 2032
- Table 84: Global Food Texturizers Industry Volume K Tons Forecast, by Country 2019 & 2032
- Table 85: United Kingdom Food Texturizers Industry Revenue (Million) Forecast, by Application 2019 & 2032
- Table 86: United Kingdom Food Texturizers Industry Volume (K Tons) Forecast, by Application 2019 & 2032
- Table 87: Germany Food Texturizers Industry Revenue (Million) Forecast, by Application 2019 & 2032
- Table 88: Germany Food Texturizers Industry Volume (K Tons) Forecast, by Application 2019 & 2032
- Table 89: France Food Texturizers Industry Revenue (Million) Forecast, by Application 2019 & 2032
- Table 90: France Food Texturizers Industry Volume (K Tons) Forecast, by Application 2019 & 2032
- Table 91: Russia Food Texturizers Industry Revenue (Million) Forecast, by Application 2019 & 2032
- Table 92: Russia Food Texturizers Industry Volume (K Tons) Forecast, by Application 2019 & 2032
- Table 93: Italy Food Texturizers Industry Revenue (Million) Forecast, by Application 2019 & 2032
- Table 94: Italy Food Texturizers Industry Volume (K Tons) Forecast, by Application 2019 & 2032
- Table 95: Spain Food Texturizers Industry Revenue (Million) Forecast, by Application 2019 & 2032
- Table 96: Spain Food Texturizers Industry Volume (K Tons) Forecast, by Application 2019 & 2032
- Table 97: Rest of Europe Food Texturizers Industry Revenue (Million) Forecast, by Application 2019 & 2032
- Table 98: Rest of Europe Food Texturizers Industry Volume (K Tons) Forecast, by Application 2019 & 2032
- Table 99: Global Food Texturizers Industry Revenue Million Forecast, by Type 2019 & 2032
- Table 100: Global Food Texturizers Industry Volume K Tons Forecast, by Type 2019 & 2032
- Table 101: Global Food Texturizers Industry Revenue Million Forecast, by Application 2019 & 2032
- Table 102: Global Food Texturizers Industry Volume K Tons Forecast, by Application 2019 & 2032
- Table 103: Global Food Texturizers Industry Revenue Million Forecast, by Country 2019 & 2032
- Table 104: Global Food Texturizers Industry Volume K Tons Forecast, by Country 2019 & 2032
- Table 105: India Food Texturizers Industry Revenue (Million) Forecast, by Application 2019 & 2032
- Table 106: India Food Texturizers Industry Volume (K Tons) Forecast, by Application 2019 & 2032
- Table 107: China Food Texturizers Industry Revenue (Million) Forecast, by Application 2019 & 2032
- Table 108: China Food Texturizers Industry Volume (K Tons) Forecast, by Application 2019 & 2032
- Table 109: Japan Food Texturizers Industry Revenue (Million) Forecast, by Application 2019 & 2032
- Table 110: Japan Food Texturizers Industry Volume (K Tons) Forecast, by Application 2019 & 2032
- Table 111: Australia Food Texturizers Industry Revenue (Million) Forecast, by Application 2019 & 2032
- Table 112: Australia Food Texturizers Industry Volume (K Tons) Forecast, by Application 2019 & 2032
- Table 113: Rest of Asia Pacific Food Texturizers Industry Revenue (Million) Forecast, by Application 2019 & 2032
- Table 114: Rest of Asia Pacific Food Texturizers Industry Volume (K Tons) Forecast, by Application 2019 & 2032
- Table 115: Global Food Texturizers Industry Revenue Million Forecast, by Type 2019 & 2032
- Table 116: Global Food Texturizers Industry Volume K Tons Forecast, by Type 2019 & 2032
- Table 117: Global Food Texturizers Industry Revenue Million Forecast, by Application 2019 & 2032
- Table 118: Global Food Texturizers Industry Volume K Tons Forecast, by Application 2019 & 2032
- Table 119: Global Food Texturizers Industry Revenue Million Forecast, by Country 2019 & 2032
- Table 120: Global Food Texturizers Industry Volume K Tons Forecast, by Country 2019 & 2032
- Table 121: Brazil Food Texturizers Industry Revenue (Million) Forecast, by Application 2019 & 2032
- Table 122: Brazil Food Texturizers Industry Volume (K Tons) Forecast, by Application 2019 & 2032
- Table 123: Argentina Food Texturizers Industry Revenue (Million) Forecast, by Application 2019 & 2032
- Table 124: Argentina Food Texturizers Industry Volume (K Tons) Forecast, by Application 2019 & 2032
- Table 125: Rest of South America Food Texturizers Industry Revenue (Million) Forecast, by Application 2019 & 2032
- Table 126: Rest of South America Food Texturizers Industry Volume (K Tons) Forecast, by Application 2019 & 2032
- Table 127: Global Food Texturizers Industry Revenue Million Forecast, by Type 2019 & 2032
- Table 128: Global Food Texturizers Industry Volume K Tons Forecast, by Type 2019 & 2032
- Table 129: Global Food Texturizers Industry Revenue Million Forecast, by Application 2019 & 2032
- Table 130: Global Food Texturizers Industry Volume K Tons Forecast, by Application 2019 & 2032
- Table 131: Global Food Texturizers Industry Revenue Million Forecast, by Country 2019 & 2032
- Table 132: Global Food Texturizers Industry Volume K Tons Forecast, by Country 2019 & 2032
- Table 133: Global Food Texturizers Industry Revenue Million Forecast, by Type 2019 & 2032
- Table 134: Global Food Texturizers Industry Volume K Tons Forecast, by Type 2019 & 2032
- Table 135: Global Food Texturizers Industry Revenue Million Forecast, by Application 2019 & 2032
- Table 136: Global Food Texturizers Industry Volume K Tons Forecast, by Application 2019 & 2032
- Table 137: Global Food Texturizers Industry Revenue Million Forecast, by Country 2019 & 2032
- Table 138: Global Food Texturizers Industry Volume K Tons Forecast, by Country 2019 & 2032
- Table 139: Saudi Arabia Food Texturizers Industry Revenue (Million) Forecast, by Application 2019 & 2032
- Table 140: Saudi Arabia Food Texturizers Industry Volume (K Tons) Forecast, by Application 2019 & 2032
- Table 141: Rest of Middle East Food Texturizers Industry Revenue (Million) Forecast, by Application 2019 & 2032
- Table 142: Rest of Middle East Food Texturizers Industry Volume (K Tons) Forecast, by Application 2019 & 2032
Frequently Asked Questions
1. What is the projected Compound Annual Growth Rate (CAGR) of the Food Texturizers Industry?
The projected CAGR is approximately 5.10%.
2. Which companies are prominent players in the Food Texturizers Industry?
Key companies in the market include Tate & Lyle Plc, Cargill Incorporated, Archer Daniels Midland Co, Royal DSM N V, Palsgaard A/S, Kerry Inc, Ingredion Inc, DuPont, Fiberstar Inc *List Not Exhaustive, Estelle Chemicals Pvt Ltd.
3. What are the main segments of the Food Texturizers Industry?
The market segments include Type, Application.
4. Can you provide details about the market size?
The market size is estimated to be USD XX Million as of 2022.
5. What are some drivers contributing to market growth?
Rising Incidence of Obesity and Cadiovascular Diseases; Growing Trend of Veganism Drives the Market.
6. What are the notable trends driving market growth?
Growing Demand for Low Calorie Food Products.
7. Are there any restraints impacting market growth?
Associated Allergies With Plant Proteins.
8. Can you provide examples of recent developments in the market?
April 2022: Cargill Salt announced it will invest USD 68 billion in expanding ST. Clair Plant. Investments being made by Cargill will enhance the plant's production capacity through increased automation, new technology, and efficiency improvements. The multi-year improvement project also includes constructing a new 50,000-square-foot evaporation facility to house a state-of-the-art dry processing line expected to reduce waste and increase capacity by up to 40%.
9. What pricing options are available for accessing the report?
Pricing options include single-user, multi-user, and enterprise licenses priced at USD 4750, USD 5250, and USD 8750 respectively.
10. Is the market size provided in terms of value or volume?
The market size is provided in terms of value, measured in Million and volume, measured in K Tons.
11. Are there any specific market keywords associated with the report?
Yes, the market keyword associated with the report is "Food Texturizers Industry," which aids in identifying and referencing the specific market segment covered.
12. How do I determine which pricing option suits my needs best?
The pricing options vary based on user requirements and access needs. Individual users may opt for single-user licenses, while businesses requiring broader access may choose multi-user or enterprise licenses for cost-effective access to the report.
13. Are there any additional resources or data provided in the Food Texturizers Industry report?
While the report offers comprehensive insights, it's advisable to review the specific contents or supplementary materials provided to ascertain if additional resources or data are available.
14. How can I stay updated on further developments or reports in the Food Texturizers Industry?
To stay informed about further developments, trends, and reports in the Food Texturizers Industry, consider subscribing to industry newsletters, following relevant companies and organizations, or regularly checking reputable industry news sources and publications.
Methodology
Step 1 - Identification of Relevant Samples Size from Population Database


Step 2 - Approaches for Defining Global Market Size (Value, Volume* & Price*)

Note*: In applicable scenarios
Step 3 - Data Sources
Primary Research
- Web Analytics
- Survey Reports
- Research Institute
- Latest Research Reports
- Opinion Leaders
Secondary Research
- Annual Reports
- White Paper
- Latest Press Release
- Industry Association
- Paid Database
- Investor Presentations

Step 4 - Data Triangulation
Involves using different sources of information in order to increase the validity of a study
These sources are likely to be stakeholders in a program - participants, other researchers, program staff, other community members, and so on.
Then we put all data in single framework & apply various statistical tools to find out the dynamic on the market.
During the analysis stage, feedback from the stakeholder groups would be compared to determine areas of agreement as well as areas of divergence


