
Key Insights
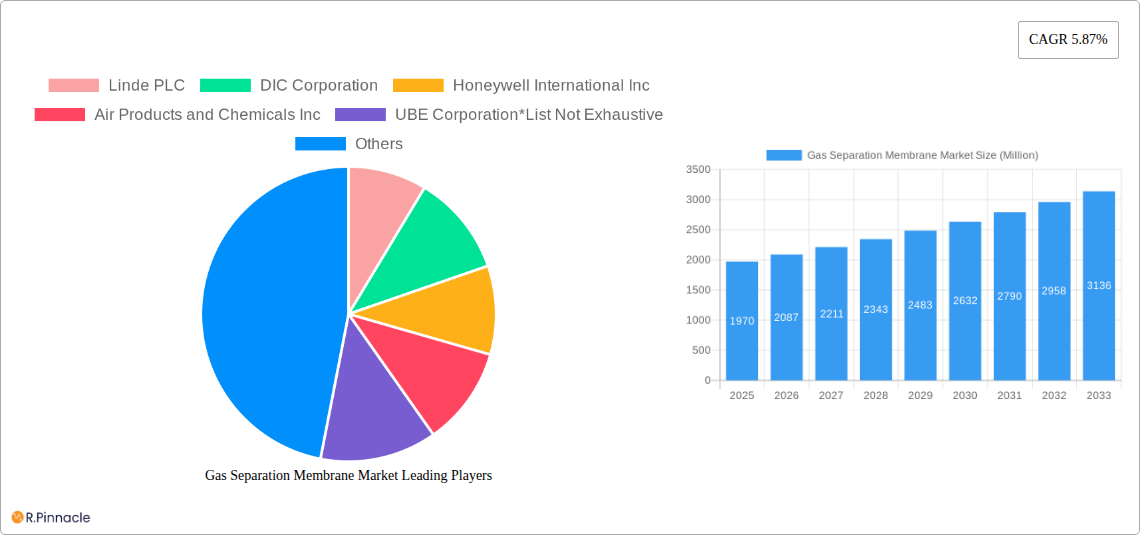
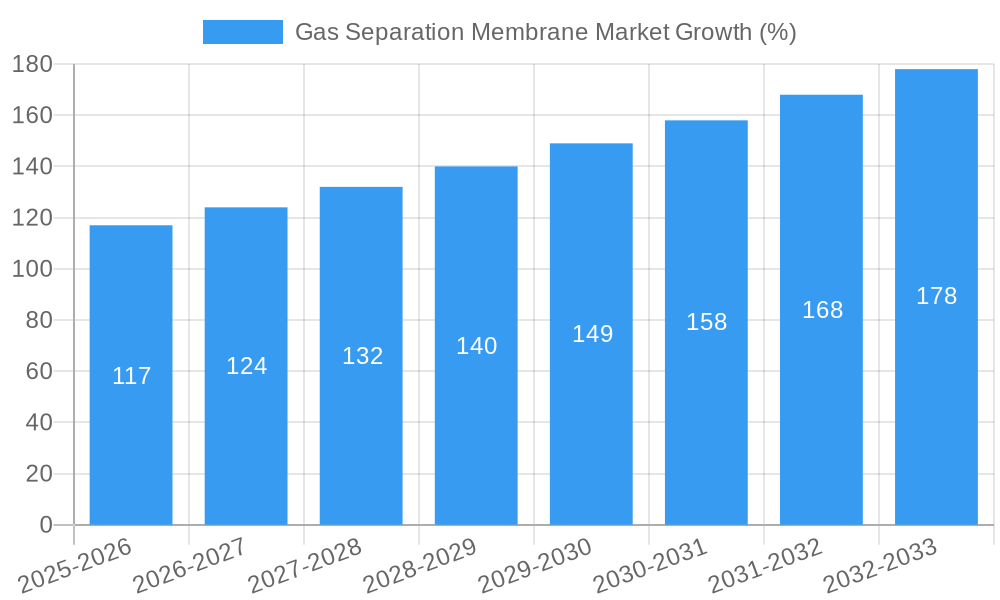
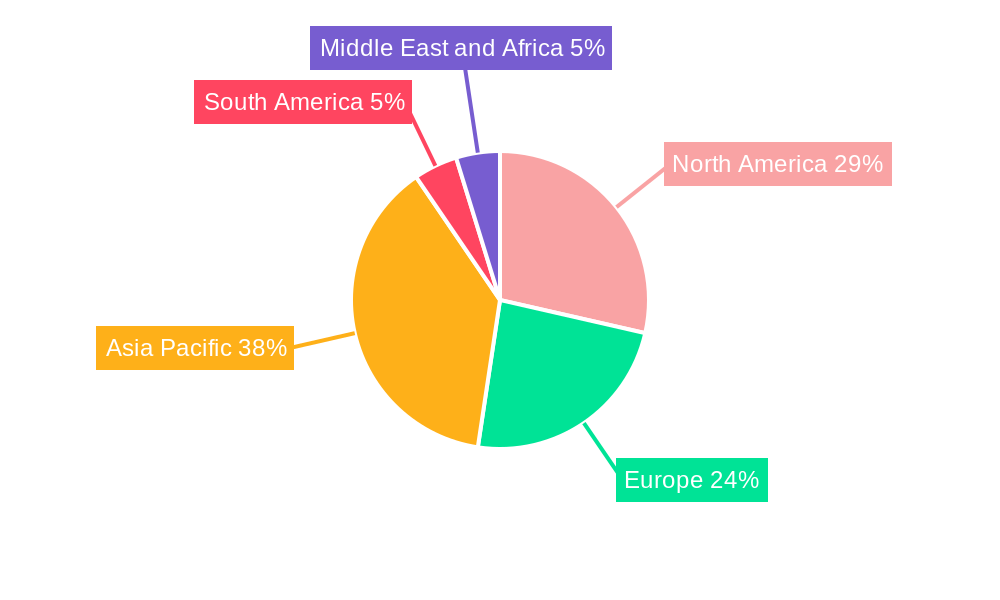
The global gas separation membrane market, valued at $1.97 billion in 2025, is projected to experience robust growth, driven by increasing demand for efficient and cost-effective gas separation solutions across various industries. A Compound Annual Growth Rate (CAGR) of 5.87% from 2025 to 2033 indicates a significant expansion, reaching an estimated value exceeding $3.5 billion by 2033. Key drivers include the rising adoption of membrane technology in natural gas processing for enhanced recovery of valuable components like hydrogen and helium, the burgeoning renewable energy sector requiring efficient CO2 capture and biogas upgrading, and the growing need for on-site nitrogen generation in various industries, reducing reliance on bulk gas suppliers. The market is segmented by material type (polyimide and polyamide leading the way, followed by polysulfone and cellulose acetate) and application (nitrogen generation and oxygen enrichment holding significant market share, with growth expected in hydrogen recovery and carbon dioxide removal). Geographic expansion is also a significant factor, with Asia Pacific, particularly China and India, expected to show strong growth due to increasing industrialization and investment in energy infrastructure. However, the high initial investment cost of membrane systems and the potential for membrane fouling can act as restraints. Technological advancements focusing on membrane durability, selectivity, and cost reduction will be key to future market growth.
The competitive landscape is characterized by a mix of established players like Linde PLC, Air Products and Chemicals Inc., and Honeywell International Inc., and specialized membrane manufacturers. Strategic partnerships, mergers and acquisitions, and ongoing research and development efforts are shaping the market dynamics. Regional variations in regulatory frameworks and industrial development will also influence the market growth trajectory. North America and Europe currently hold significant market share, but the Asia-Pacific region is poised for substantial growth in the coming years, driven by robust industrial expansion and government support for clean energy initiatives. The continued development of advanced membrane materials, coupled with improved system design and operational efficiency, will drive further penetration of gas separation membrane technology across various industrial applications, leading to a more sustainable and efficient gas processing landscape.
Gas Separation Membrane Market: A Comprehensive Report (2019-2033)
This in-depth report provides a comprehensive analysis of the Gas Separation Membrane Market, offering actionable insights for industry professionals, investors, and strategists. Covering the period from 2019 to 2033, with a focus on 2025, this report meticulously examines market dynamics, key players, technological advancements, and future growth prospects. The global market is projected to reach xx Million by 2033, exhibiting a robust CAGR of xx% during the forecast period (2025-2033).
Gas Separation Membrane Market Structure & Innovation Trends
This section analyzes the competitive landscape, innovation drivers, and regulatory influences shaping the Gas Separation Membrane Market. The market exhibits moderate concentration, with key players holding significant market share. However, the presence of numerous smaller players fosters competition and innovation.
- Market Concentration: The top 5 players (Linde PLC, DIC Corporation, Honeywell International Inc, Air Products and Chemicals Inc, UBE Corporation) collectively hold an estimated xx% market share in 2025.
- Innovation Drivers: Stringent environmental regulations, the burgeoning demand for cleaner energy sources (particularly hydrogen), and advancements in membrane materials (e.g., polyimide and polysulfone) are key innovation drivers.
- Regulatory Frameworks: Government initiatives promoting renewable energy and carbon capture, utilization, and storage (CCUS) significantly influence market growth. Differing regional regulations impact market dynamics.
- Product Substitutes: Alternative gas separation technologies, such as cryogenic distillation, pose competitive pressure; however, membrane-based solutions offer advantages in terms of cost-effectiveness and scalability for specific applications.
- End-User Demographics: Major end-user sectors include chemical processing, petroleum refining, natural gas processing, and the burgeoning hydrogen and CO2 capture industries.
- M&A Activities: The market has witnessed moderate M&A activity in recent years, with deal values averaging approximately xx Million per transaction. Consolidation among key players is anticipated to increase as the market matures.
Gas Separation Membrane Market Dynamics & Trends
The Gas Separation Membrane Market is experiencing significant growth, driven by a confluence of factors. The increasing demand for high-purity gases in various industrial processes, coupled with stringent environmental regulations aimed at reducing greenhouse gas emissions, is fueling market expansion.
Technological advancements in membrane materials and module designs are enhancing efficiency and reducing costs, making gas separation membranes a more attractive alternative to traditional separation techniques. The rising adoption of renewable energy sources, such as hydrogen, is further boosting market growth, particularly for hydrogen recovery applications.
Consumer preferences are shifting toward sustainable and environmentally friendly solutions, reinforcing the demand for gas separation membranes in carbon capture, utilization, and storage (CCUS) applications. The competitive dynamics are characterized by both established players and emerging companies vying for market share through technological innovation, strategic partnerships, and geographic expansion. The market’s penetration rate in specific end-use industries is steadily increasing, with significant growth projected in emerging economies.
Dominant Regions & Segments in Gas Separation Membrane Market
North America and Asia-Pacific currently dominate the Gas Separation Membrane market.
Dominant Regions:
- North America: Strong presence of major players, robust chemical and energy industries, and supportive regulatory framework contribute to its dominance.
- Asia-Pacific: Rapid industrialization, increasing energy demand, and significant investments in renewable energy infrastructure drive substantial market growth.
Dominant Segments:
- Material Type: Polyimide and polyamide membranes hold the largest market share due to their superior performance characteristics and wide applicability.
- Application: Nitrogen generation and oxygen enrichment remain the dominant application segments due to their widespread use in various industrial processes. However, the hydrogen recovery segment is experiencing rapid growth, driven by the rising adoption of hydrogen as a clean energy source.
Key Drivers (by Segment):
- Polyimide and Polyamide: High selectivity, chemical resistance, and thermal stability drive market dominance.
- Polysulfone: Cost-effectiveness and suitability for specific applications contribute to moderate market share.
- Cellulose Acetate: Limited applications due to lower performance compared to other materials restrict market growth.
- Nitrogen Generation and Oxygen Enrichment: Wide applicability in various industries leads to high market demand.
- Hydrogen Recovery: Driven by the growing interest in hydrogen as a clean energy carrier.
- Carbon Dioxide Removal: Growing environmental concerns and regulations are driving growth in this segment.
Gas Separation Membrane Market Product Innovations
Recent innovations focus on enhancing membrane selectivity, permeability, and durability. The development of novel membrane materials, such as mixed matrix membranes, is improving performance characteristics and expanding the range of applications. Furthermore, advancements in module design and fabrication techniques are optimizing system efficiency and reducing costs. These innovations are enabling gas separation membranes to compete more effectively with traditional separation technologies.
Report Scope & Segmentation Analysis
This report comprehensively segments the Gas Separation Membrane Market by Material Type (Polyimide and Polyamide, Polysulfone, Cellulose Acetate, Other Material Types) and Application (Nitrogen Generation and Oxygen Enrichment, Hydrogen Recovery, Carbon Dioxide Removal, Removal of Hydrogen Sulphide, Other Applications). Each segment’s growth projections, market size, and competitive dynamics are analyzed in detail, providing a granular understanding of the market landscape. The detailed analysis considers historical data (2019-2024), the base year (2025), and forecasts (2025-2033).
Key Drivers of Gas Separation Membrane Market Growth
The market’s growth is propelled by several factors: the increasing demand for high-purity gases in various industries, stringent environmental regulations promoting cleaner energy and reduced emissions, advancements in membrane technology leading to improved efficiency and cost-effectiveness, and the rising adoption of hydrogen as a clean energy carrier. Government incentives and investments in renewable energy infrastructure are further accelerating market expansion.
Challenges in the Gas Separation Membrane Market Sector
The Gas Separation Membrane market faces certain challenges, including the high initial investment costs associated with membrane installation and maintenance, potential fouling and degradation of membranes, and competition from established gas separation technologies. Fluctuations in raw material prices and supply chain disruptions can also impact market growth. Addressing these challenges through technological innovation and cost optimization strategies is crucial for sustained market development.
Emerging Opportunities in Gas Separation Membrane Market
Emerging opportunities exist in developing advanced membrane materials with improved performance, expanding into new applications such as biogas upgrading and natural gas processing, and penetrating emerging economies with high growth potential. The integration of gas separation membranes with other technologies, such as renewable energy systems, creates new synergistic opportunities.
Leading Players in the Gas Separation Membrane Market Market
- Linde PLC (Linde PLC)
- DIC Corporation (DIC Corporation)
- Honeywell International Inc (Honeywell International Inc)
- Air Products and Chemicals Inc (Air Products and Chemicals Inc)
- UBE Corporation
- Toray Industries Inc (Toray Industries Inc)
- SLB (schlumberger) (SLB (schlumberger))
- Evonik Industries AG (Evonik Industries AG)
- Fujifilm Corporation (Fujifilm Corporation)
- Air Liquide Advanced Separations (Air Liquide)
- Generon
- Parker Hannifin Corp (Parker Hannifin Corp)
- Membrane Technology and Research Inc
Key Developments in Gas Separation Membrane Market Industry
January 2023: UBE Corporation announced the expansion of its polyimide hollow fiber production facilities and gas separation membrane module production facilities to meet growing demand, particularly for CO2 separation membranes. Increased production capacity by approximately 1.8 times is expected by the first half of fiscal 2025. This significantly strengthens their market position and capacity to meet the rising demand for CO2 separation.
January 2022: Toray Industries, Inc. developed a new polymeric separation membrane module for efficient hydrogen permeation from mixed gases. This innovation more than halved CO2 emissions during hydrogen purification, highlighting a significant step towards sustainable hydrogen production and enhancing the company's competitive advantage.
Future Outlook for Gas Separation Membrane Market Market
The Gas Separation Membrane market is poised for robust growth, driven by ongoing technological advancements, increasing demand for clean energy, and supportive government policies. Strategic investments in research and development, expansion into new applications, and strategic partnerships will be crucial for companies to capitalize on future market opportunities. The market is expected to witness further consolidation as leading players expand their production capacities and invest in new technologies to maintain their competitive edge.
Gas Separation Membrane Market Segmentation
-
1. Material Type
- 1.1. Polyimide and Polyamide
- 1.2. Polysulfone
- 1.3. Cellulose Acetate
- 1.4. Other Material Types (Nanostructured Membrane)
-
2. Application
- 2.1. Nitrogen Generation and Oxygen Enrichment
- 2.2. Hydrogen Recovery
- 2.3. Carbon Dioxide Removal
- 2.4. Removal of Hydrogen Sulphide
- 2.5. Other Applications (Carbonation)
Gas Separation Membrane Market Segmentation By Geography
-
1. Asia Pacific
- 1.1. China
- 1.2. India
- 1.3. Japan
- 1.4. South Korea
- 1.5. Malaysia
- 1.6. Thailand
- 1.7. Indonesia
- 1.8. Vietnam
- 1.9. Rest of Asia Pacific
-
2. North America
- 2.1. United States
- 2.2. Canada
- 2.3. Mexico
-
3. Europe
- 3.1. Germany
- 3.2. United Kingdom
- 3.3. Italy
- 3.4. France
- 3.5. Spain
- 3.6. Turkey
- 3.7. Russia
- 3.8. NORDIC
- 3.9. Rest of Europe
-
4. South America
- 4.1. Brazil
- 4.2. Argentina
- 4.3. Colombia
- 4.4. Rest of South America
-
5. Middle East and Africa
- 5.1. Saudi Arabia
- 5.2. South Africa
- 5.3. Nigeria
- 5.4. Qatar
- 5.5. Egypt
- 5.6. UAE
- 5.7. Rest of Middle East and Africa
Gas Separation Membrane Market REPORT HIGHLIGHTS
| Aspects | Details |
|---|---|
| Study Period | 2019-2033 |
| Base Year | 2024 |
| Estimated Year | 2025 |
| Forecast Period | 2025-2033 |
| Historical Period | 2019-2024 |
| Growth Rate | CAGR of 5.87% from 2019-2033 |
| Segmentation |
|
Table of Contents
- 1. Introduction
- 1.1. Research Scope
- 1.2. Market Segmentation
- 1.3. Research Methodology
- 1.4. Definitions and Assumptions
- 2. Executive Summary
- 2.1. Introduction
- 3. Market Dynamics
- 3.1. Introduction
- 3.2. Market Drivers
- 3.2.1. Increasing Demand for Membranes in Carbon Dioxide Separation Processes; Strict Government Norms Toward GHG Emissions
- 3.3. Market Restrains
- 3.3.1. Plasticization of Polymeric Membranes in High-Temperature Applications; Upscaling and Adoption of New Membranes
- 3.4. Market Trends
- 3.4.1. Nitrogen Generation and Oxygen Enrichment Application to Dominate the Market
- 4. Market Factor Analysis
- 4.1. Porters Five Forces
- 4.2. Supply/Value Chain
- 4.3. PESTEL analysis
- 4.4. Market Entropy
- 4.5. Patent/Trademark Analysis
- 5. Global Gas Separation Membrane Market Analysis, Insights and Forecast, 2019-2031
- 5.1. Market Analysis, Insights and Forecast - by Material Type
- 5.1.1. Polyimide and Polyamide
- 5.1.2. Polysulfone
- 5.1.3. Cellulose Acetate
- 5.1.4. Other Material Types (Nanostructured Membrane)
- 5.2. Market Analysis, Insights and Forecast - by Application
- 5.2.1. Nitrogen Generation and Oxygen Enrichment
- 5.2.2. Hydrogen Recovery
- 5.2.3. Carbon Dioxide Removal
- 5.2.4. Removal of Hydrogen Sulphide
- 5.2.5. Other Applications (Carbonation)
- 5.3. Market Analysis, Insights and Forecast - by Region
- 5.3.1. Asia Pacific
- 5.3.2. North America
- 5.3.3. Europe
- 5.3.4. South America
- 5.3.5. Middle East and Africa
- 5.1. Market Analysis, Insights and Forecast - by Material Type
- 6. Asia Pacific Gas Separation Membrane Market Analysis, Insights and Forecast, 2019-2031
- 6.1. Market Analysis, Insights and Forecast - by Material Type
- 6.1.1. Polyimide and Polyamide
- 6.1.2. Polysulfone
- 6.1.3. Cellulose Acetate
- 6.1.4. Other Material Types (Nanostructured Membrane)
- 6.2. Market Analysis, Insights and Forecast - by Application
- 6.2.1. Nitrogen Generation and Oxygen Enrichment
- 6.2.2. Hydrogen Recovery
- 6.2.3. Carbon Dioxide Removal
- 6.2.4. Removal of Hydrogen Sulphide
- 6.2.5. Other Applications (Carbonation)
- 6.1. Market Analysis, Insights and Forecast - by Material Type
- 7. North America Gas Separation Membrane Market Analysis, Insights and Forecast, 2019-2031
- 7.1. Market Analysis, Insights and Forecast - by Material Type
- 7.1.1. Polyimide and Polyamide
- 7.1.2. Polysulfone
- 7.1.3. Cellulose Acetate
- 7.1.4. Other Material Types (Nanostructured Membrane)
- 7.2. Market Analysis, Insights and Forecast - by Application
- 7.2.1. Nitrogen Generation and Oxygen Enrichment
- 7.2.2. Hydrogen Recovery
- 7.2.3. Carbon Dioxide Removal
- 7.2.4. Removal of Hydrogen Sulphide
- 7.2.5. Other Applications (Carbonation)
- 7.1. Market Analysis, Insights and Forecast - by Material Type
- 8. Europe Gas Separation Membrane Market Analysis, Insights and Forecast, 2019-2031
- 8.1. Market Analysis, Insights and Forecast - by Material Type
- 8.1.1. Polyimide and Polyamide
- 8.1.2. Polysulfone
- 8.1.3. Cellulose Acetate
- 8.1.4. Other Material Types (Nanostructured Membrane)
- 8.2. Market Analysis, Insights and Forecast - by Application
- 8.2.1. Nitrogen Generation and Oxygen Enrichment
- 8.2.2. Hydrogen Recovery
- 8.2.3. Carbon Dioxide Removal
- 8.2.4. Removal of Hydrogen Sulphide
- 8.2.5. Other Applications (Carbonation)
- 8.1. Market Analysis, Insights and Forecast - by Material Type
- 9. South America Gas Separation Membrane Market Analysis, Insights and Forecast, 2019-2031
- 9.1. Market Analysis, Insights and Forecast - by Material Type
- 9.1.1. Polyimide and Polyamide
- 9.1.2. Polysulfone
- 9.1.3. Cellulose Acetate
- 9.1.4. Other Material Types (Nanostructured Membrane)
- 9.2. Market Analysis, Insights and Forecast - by Application
- 9.2.1. Nitrogen Generation and Oxygen Enrichment
- 9.2.2. Hydrogen Recovery
- 9.2.3. Carbon Dioxide Removal
- 9.2.4. Removal of Hydrogen Sulphide
- 9.2.5. Other Applications (Carbonation)
- 9.1. Market Analysis, Insights and Forecast - by Material Type
- 10. Middle East and Africa Gas Separation Membrane Market Analysis, Insights and Forecast, 2019-2031
- 10.1. Market Analysis, Insights and Forecast - by Material Type
- 10.1.1. Polyimide and Polyamide
- 10.1.2. Polysulfone
- 10.1.3. Cellulose Acetate
- 10.1.4. Other Material Types (Nanostructured Membrane)
- 10.2. Market Analysis, Insights and Forecast - by Application
- 10.2.1. Nitrogen Generation and Oxygen Enrichment
- 10.2.2. Hydrogen Recovery
- 10.2.3. Carbon Dioxide Removal
- 10.2.4. Removal of Hydrogen Sulphide
- 10.2.5. Other Applications (Carbonation)
- 10.1. Market Analysis, Insights and Forecast - by Material Type
- 11. Asia Pacific Gas Separation Membrane Market Analysis, Insights and Forecast, 2019-2031
- 11.1. Market Analysis, Insights and Forecast - By Country/Sub-region
- 11.1.1 China
- 11.1.2 India
- 11.1.3 Japan
- 11.1.4 South Korea
- 11.1.5 Rest of Asia Pacific
- 12. North America Gas Separation Membrane Market Analysis, Insights and Forecast, 2019-2031
- 12.1. Market Analysis, Insights and Forecast - By Country/Sub-region
- 12.1.1 United States
- 12.1.2 Canada
- 12.1.3 Mexico
- 13. Europe Gas Separation Membrane Market Analysis, Insights and Forecast, 2019-2031
- 13.1. Market Analysis, Insights and Forecast - By Country/Sub-region
- 13.1.1 Germany
- 13.1.2 United Kingdom
- 13.1.3 Italy
- 13.1.4 France
- 13.1.5 Rest of Europe
- 14. South America Gas Separation Membrane Market Analysis, Insights and Forecast, 2019-2031
- 14.1. Market Analysis, Insights and Forecast - By Country/Sub-region
- 14.1.1 Brazil
- 14.1.2 Argentina
- 14.1.3 Rest of South America
- 15. Middle East and Africa Gas Separation Membrane Market Analysis, Insights and Forecast, 2019-2031
- 15.1. Market Analysis, Insights and Forecast - By Country/Sub-region
- 15.1.1 Saudi Arabia
- 15.1.2 South Africa
- 15.1.3 Rest of Middle East and Africa
- 16. Competitive Analysis
- 16.1. Global Market Share Analysis 2024
- 16.2. Company Profiles
- 16.2.1 Linde PLC
- 16.2.1.1. Overview
- 16.2.1.2. Products
- 16.2.1.3. SWOT Analysis
- 16.2.1.4. Recent Developments
- 16.2.1.5. Financials (Based on Availability)
- 16.2.2 DIC Corporation
- 16.2.2.1. Overview
- 16.2.2.2. Products
- 16.2.2.3. SWOT Analysis
- 16.2.2.4. Recent Developments
- 16.2.2.5. Financials (Based on Availability)
- 16.2.3 Honeywell International Inc
- 16.2.3.1. Overview
- 16.2.3.2. Products
- 16.2.3.3. SWOT Analysis
- 16.2.3.4. Recent Developments
- 16.2.3.5. Financials (Based on Availability)
- 16.2.4 Air Products and Chemicals Inc
- 16.2.4.1. Overview
- 16.2.4.2. Products
- 16.2.4.3. SWOT Analysis
- 16.2.4.4. Recent Developments
- 16.2.4.5. Financials (Based on Availability)
- 16.2.5 UBE Corporation*List Not Exhaustive
- 16.2.5.1. Overview
- 16.2.5.2. Products
- 16.2.5.3. SWOT Analysis
- 16.2.5.4. Recent Developments
- 16.2.5.5. Financials (Based on Availability)
- 16.2.6 Toray Industries Inc
- 16.2.6.1. Overview
- 16.2.6.2. Products
- 16.2.6.3. SWOT Analysis
- 16.2.6.4. Recent Developments
- 16.2.6.5. Financials (Based on Availability)
- 16.2.7 SLB (schlumberger)
- 16.2.7.1. Overview
- 16.2.7.2. Products
- 16.2.7.3. SWOT Analysis
- 16.2.7.4. Recent Developments
- 16.2.7.5. Financials (Based on Availability)
- 16.2.8 Evonik Industries AG
- 16.2.8.1. Overview
- 16.2.8.2. Products
- 16.2.8.3. SWOT Analysis
- 16.2.8.4. Recent Developments
- 16.2.8.5. Financials (Based on Availability)
- 16.2.9 Fujifilm Corporation
- 16.2.9.1. Overview
- 16.2.9.2. Products
- 16.2.9.3. SWOT Analysis
- 16.2.9.4. Recent Developments
- 16.2.9.5. Financials (Based on Availability)
- 16.2.10 Air Liquide Advanced Separations
- 16.2.10.1. Overview
- 16.2.10.2. Products
- 16.2.10.3. SWOT Analysis
- 16.2.10.4. Recent Developments
- 16.2.10.5. Financials (Based on Availability)
- 16.2.11 Generon
- 16.2.11.1. Overview
- 16.2.11.2. Products
- 16.2.11.3. SWOT Analysis
- 16.2.11.4. Recent Developments
- 16.2.11.5. Financials (Based on Availability)
- 16.2.12 Parker Hannifin Corp
- 16.2.12.1. Overview
- 16.2.12.2. Products
- 16.2.12.3. SWOT Analysis
- 16.2.12.4. Recent Developments
- 16.2.12.5. Financials (Based on Availability)
- 16.2.13 Membrane Technology and Research Inc
- 16.2.13.1. Overview
- 16.2.13.2. Products
- 16.2.13.3. SWOT Analysis
- 16.2.13.4. Recent Developments
- 16.2.13.5. Financials (Based on Availability)
- 16.2.1 Linde PLC
List of Figures
- Figure 1: Global Gas Separation Membrane Market Revenue Breakdown (Million, %) by Region 2024 & 2032
- Figure 2: Global Gas Separation Membrane Market Volume Breakdown (K Tons, %) by Region 2024 & 2032
- Figure 3: Asia Pacific Gas Separation Membrane Market Revenue (Million), by Country 2024 & 2032
- Figure 4: Asia Pacific Gas Separation Membrane Market Volume (K Tons), by Country 2024 & 2032
- Figure 5: Asia Pacific Gas Separation Membrane Market Revenue Share (%), by Country 2024 & 2032
- Figure 6: Asia Pacific Gas Separation Membrane Market Volume Share (%), by Country 2024 & 2032
- Figure 7: North America Gas Separation Membrane Market Revenue (Million), by Country 2024 & 2032
- Figure 8: North America Gas Separation Membrane Market Volume (K Tons), by Country 2024 & 2032
- Figure 9: North America Gas Separation Membrane Market Revenue Share (%), by Country 2024 & 2032
- Figure 10: North America Gas Separation Membrane Market Volume Share (%), by Country 2024 & 2032
- Figure 11: Europe Gas Separation Membrane Market Revenue (Million), by Country 2024 & 2032
- Figure 12: Europe Gas Separation Membrane Market Volume (K Tons), by Country 2024 & 2032
- Figure 13: Europe Gas Separation Membrane Market Revenue Share (%), by Country 2024 & 2032
- Figure 14: Europe Gas Separation Membrane Market Volume Share (%), by Country 2024 & 2032
- Figure 15: South America Gas Separation Membrane Market Revenue (Million), by Country 2024 & 2032
- Figure 16: South America Gas Separation Membrane Market Volume (K Tons), by Country 2024 & 2032
- Figure 17: South America Gas Separation Membrane Market Revenue Share (%), by Country 2024 & 2032
- Figure 18: South America Gas Separation Membrane Market Volume Share (%), by Country 2024 & 2032
- Figure 19: Middle East and Africa Gas Separation Membrane Market Revenue (Million), by Country 2024 & 2032
- Figure 20: Middle East and Africa Gas Separation Membrane Market Volume (K Tons), by Country 2024 & 2032
- Figure 21: Middle East and Africa Gas Separation Membrane Market Revenue Share (%), by Country 2024 & 2032
- Figure 22: Middle East and Africa Gas Separation Membrane Market Volume Share (%), by Country 2024 & 2032
- Figure 23: Asia Pacific Gas Separation Membrane Market Revenue (Million), by Material Type 2024 & 2032
- Figure 24: Asia Pacific Gas Separation Membrane Market Volume (K Tons), by Material Type 2024 & 2032
- Figure 25: Asia Pacific Gas Separation Membrane Market Revenue Share (%), by Material Type 2024 & 2032
- Figure 26: Asia Pacific Gas Separation Membrane Market Volume Share (%), by Material Type 2024 & 2032
- Figure 27: Asia Pacific Gas Separation Membrane Market Revenue (Million), by Application 2024 & 2032
- Figure 28: Asia Pacific Gas Separation Membrane Market Volume (K Tons), by Application 2024 & 2032
- Figure 29: Asia Pacific Gas Separation Membrane Market Revenue Share (%), by Application 2024 & 2032
- Figure 30: Asia Pacific Gas Separation Membrane Market Volume Share (%), by Application 2024 & 2032
- Figure 31: Asia Pacific Gas Separation Membrane Market Revenue (Million), by Country 2024 & 2032
- Figure 32: Asia Pacific Gas Separation Membrane Market Volume (K Tons), by Country 2024 & 2032
- Figure 33: Asia Pacific Gas Separation Membrane Market Revenue Share (%), by Country 2024 & 2032
- Figure 34: Asia Pacific Gas Separation Membrane Market Volume Share (%), by Country 2024 & 2032
- Figure 35: North America Gas Separation Membrane Market Revenue (Million), by Material Type 2024 & 2032
- Figure 36: North America Gas Separation Membrane Market Volume (K Tons), by Material Type 2024 & 2032
- Figure 37: North America Gas Separation Membrane Market Revenue Share (%), by Material Type 2024 & 2032
- Figure 38: North America Gas Separation Membrane Market Volume Share (%), by Material Type 2024 & 2032
- Figure 39: North America Gas Separation Membrane Market Revenue (Million), by Application 2024 & 2032
- Figure 40: North America Gas Separation Membrane Market Volume (K Tons), by Application 2024 & 2032
- Figure 41: North America Gas Separation Membrane Market Revenue Share (%), by Application 2024 & 2032
- Figure 42: North America Gas Separation Membrane Market Volume Share (%), by Application 2024 & 2032
- Figure 43: North America Gas Separation Membrane Market Revenue (Million), by Country 2024 & 2032
- Figure 44: North America Gas Separation Membrane Market Volume (K Tons), by Country 2024 & 2032
- Figure 45: North America Gas Separation Membrane Market Revenue Share (%), by Country 2024 & 2032
- Figure 46: North America Gas Separation Membrane Market Volume Share (%), by Country 2024 & 2032
- Figure 47: Europe Gas Separation Membrane Market Revenue (Million), by Material Type 2024 & 2032
- Figure 48: Europe Gas Separation Membrane Market Volume (K Tons), by Material Type 2024 & 2032
- Figure 49: Europe Gas Separation Membrane Market Revenue Share (%), by Material Type 2024 & 2032
- Figure 50: Europe Gas Separation Membrane Market Volume Share (%), by Material Type 2024 & 2032
- Figure 51: Europe Gas Separation Membrane Market Revenue (Million), by Application 2024 & 2032
- Figure 52: Europe Gas Separation Membrane Market Volume (K Tons), by Application 2024 & 2032
- Figure 53: Europe Gas Separation Membrane Market Revenue Share (%), by Application 2024 & 2032
- Figure 54: Europe Gas Separation Membrane Market Volume Share (%), by Application 2024 & 2032
- Figure 55: Europe Gas Separation Membrane Market Revenue (Million), by Country 2024 & 2032
- Figure 56: Europe Gas Separation Membrane Market Volume (K Tons), by Country 2024 & 2032
- Figure 57: Europe Gas Separation Membrane Market Revenue Share (%), by Country 2024 & 2032
- Figure 58: Europe Gas Separation Membrane Market Volume Share (%), by Country 2024 & 2032
- Figure 59: South America Gas Separation Membrane Market Revenue (Million), by Material Type 2024 & 2032
- Figure 60: South America Gas Separation Membrane Market Volume (K Tons), by Material Type 2024 & 2032
- Figure 61: South America Gas Separation Membrane Market Revenue Share (%), by Material Type 2024 & 2032
- Figure 62: South America Gas Separation Membrane Market Volume Share (%), by Material Type 2024 & 2032
- Figure 63: South America Gas Separation Membrane Market Revenue (Million), by Application 2024 & 2032
- Figure 64: South America Gas Separation Membrane Market Volume (K Tons), by Application 2024 & 2032
- Figure 65: South America Gas Separation Membrane Market Revenue Share (%), by Application 2024 & 2032
- Figure 66: South America Gas Separation Membrane Market Volume Share (%), by Application 2024 & 2032
- Figure 67: South America Gas Separation Membrane Market Revenue (Million), by Country 2024 & 2032
- Figure 68: South America Gas Separation Membrane Market Volume (K Tons), by Country 2024 & 2032
- Figure 69: South America Gas Separation Membrane Market Revenue Share (%), by Country 2024 & 2032
- Figure 70: South America Gas Separation Membrane Market Volume Share (%), by Country 2024 & 2032
- Figure 71: Middle East and Africa Gas Separation Membrane Market Revenue (Million), by Material Type 2024 & 2032
- Figure 72: Middle East and Africa Gas Separation Membrane Market Volume (K Tons), by Material Type 2024 & 2032
- Figure 73: Middle East and Africa Gas Separation Membrane Market Revenue Share (%), by Material Type 2024 & 2032
- Figure 74: Middle East and Africa Gas Separation Membrane Market Volume Share (%), by Material Type 2024 & 2032
- Figure 75: Middle East and Africa Gas Separation Membrane Market Revenue (Million), by Application 2024 & 2032
- Figure 76: Middle East and Africa Gas Separation Membrane Market Volume (K Tons), by Application 2024 & 2032
- Figure 77: Middle East and Africa Gas Separation Membrane Market Revenue Share (%), by Application 2024 & 2032
- Figure 78: Middle East and Africa Gas Separation Membrane Market Volume Share (%), by Application 2024 & 2032
- Figure 79: Middle East and Africa Gas Separation Membrane Market Revenue (Million), by Country 2024 & 2032
- Figure 80: Middle East and Africa Gas Separation Membrane Market Volume (K Tons), by Country 2024 & 2032
- Figure 81: Middle East and Africa Gas Separation Membrane Market Revenue Share (%), by Country 2024 & 2032
- Figure 82: Middle East and Africa Gas Separation Membrane Market Volume Share (%), by Country 2024 & 2032
List of Tables
- Table 1: Global Gas Separation Membrane Market Revenue Million Forecast, by Region 2019 & 2032
- Table 2: Global Gas Separation Membrane Market Volume K Tons Forecast, by Region 2019 & 2032
- Table 3: Global Gas Separation Membrane Market Revenue Million Forecast, by Material Type 2019 & 2032
- Table 4: Global Gas Separation Membrane Market Volume K Tons Forecast, by Material Type 2019 & 2032
- Table 5: Global Gas Separation Membrane Market Revenue Million Forecast, by Application 2019 & 2032
- Table 6: Global Gas Separation Membrane Market Volume K Tons Forecast, by Application 2019 & 2032
- Table 7: Global Gas Separation Membrane Market Revenue Million Forecast, by Region 2019 & 2032
- Table 8: Global Gas Separation Membrane Market Volume K Tons Forecast, by Region 2019 & 2032
- Table 9: Global Gas Separation Membrane Market Revenue Million Forecast, by Country 2019 & 2032
- Table 10: Global Gas Separation Membrane Market Volume K Tons Forecast, by Country 2019 & 2032
- Table 11: China Gas Separation Membrane Market Revenue (Million) Forecast, by Application 2019 & 2032
- Table 12: China Gas Separation Membrane Market Volume (K Tons) Forecast, by Application 2019 & 2032
- Table 13: India Gas Separation Membrane Market Revenue (Million) Forecast, by Application 2019 & 2032
- Table 14: India Gas Separation Membrane Market Volume (K Tons) Forecast, by Application 2019 & 2032
- Table 15: Japan Gas Separation Membrane Market Revenue (Million) Forecast, by Application 2019 & 2032
- Table 16: Japan Gas Separation Membrane Market Volume (K Tons) Forecast, by Application 2019 & 2032
- Table 17: South Korea Gas Separation Membrane Market Revenue (Million) Forecast, by Application 2019 & 2032
- Table 18: South Korea Gas Separation Membrane Market Volume (K Tons) Forecast, by Application 2019 & 2032
- Table 19: Rest of Asia Pacific Gas Separation Membrane Market Revenue (Million) Forecast, by Application 2019 & 2032
- Table 20: Rest of Asia Pacific Gas Separation Membrane Market Volume (K Tons) Forecast, by Application 2019 & 2032
- Table 21: Global Gas Separation Membrane Market Revenue Million Forecast, by Country 2019 & 2032
- Table 22: Global Gas Separation Membrane Market Volume K Tons Forecast, by Country 2019 & 2032
- Table 23: United States Gas Separation Membrane Market Revenue (Million) Forecast, by Application 2019 & 2032
- Table 24: United States Gas Separation Membrane Market Volume (K Tons) Forecast, by Application 2019 & 2032
- Table 25: Canada Gas Separation Membrane Market Revenue (Million) Forecast, by Application 2019 & 2032
- Table 26: Canada Gas Separation Membrane Market Volume (K Tons) Forecast, by Application 2019 & 2032
- Table 27: Mexico Gas Separation Membrane Market Revenue (Million) Forecast, by Application 2019 & 2032
- Table 28: Mexico Gas Separation Membrane Market Volume (K Tons) Forecast, by Application 2019 & 2032
- Table 29: Global Gas Separation Membrane Market Revenue Million Forecast, by Country 2019 & 2032
- Table 30: Global Gas Separation Membrane Market Volume K Tons Forecast, by Country 2019 & 2032
- Table 31: Germany Gas Separation Membrane Market Revenue (Million) Forecast, by Application 2019 & 2032
- Table 32: Germany Gas Separation Membrane Market Volume (K Tons) Forecast, by Application 2019 & 2032
- Table 33: United Kingdom Gas Separation Membrane Market Revenue (Million) Forecast, by Application 2019 & 2032
- Table 34: United Kingdom Gas Separation Membrane Market Volume (K Tons) Forecast, by Application 2019 & 2032
- Table 35: Italy Gas Separation Membrane Market Revenue (Million) Forecast, by Application 2019 & 2032
- Table 36: Italy Gas Separation Membrane Market Volume (K Tons) Forecast, by Application 2019 & 2032
- Table 37: France Gas Separation Membrane Market Revenue (Million) Forecast, by Application 2019 & 2032
- Table 38: France Gas Separation Membrane Market Volume (K Tons) Forecast, by Application 2019 & 2032
- Table 39: Rest of Europe Gas Separation Membrane Market Revenue (Million) Forecast, by Application 2019 & 2032
- Table 40: Rest of Europe Gas Separation Membrane Market Volume (K Tons) Forecast, by Application 2019 & 2032
- Table 41: Global Gas Separation Membrane Market Revenue Million Forecast, by Country 2019 & 2032
- Table 42: Global Gas Separation Membrane Market Volume K Tons Forecast, by Country 2019 & 2032
- Table 43: Brazil Gas Separation Membrane Market Revenue (Million) Forecast, by Application 2019 & 2032
- Table 44: Brazil Gas Separation Membrane Market Volume (K Tons) Forecast, by Application 2019 & 2032
- Table 45: Argentina Gas Separation Membrane Market Revenue (Million) Forecast, by Application 2019 & 2032
- Table 46: Argentina Gas Separation Membrane Market Volume (K Tons) Forecast, by Application 2019 & 2032
- Table 47: Rest of South America Gas Separation Membrane Market Revenue (Million) Forecast, by Application 2019 & 2032
- Table 48: Rest of South America Gas Separation Membrane Market Volume (K Tons) Forecast, by Application 2019 & 2032
- Table 49: Global Gas Separation Membrane Market Revenue Million Forecast, by Country 2019 & 2032
- Table 50: Global Gas Separation Membrane Market Volume K Tons Forecast, by Country 2019 & 2032
- Table 51: Saudi Arabia Gas Separation Membrane Market Revenue (Million) Forecast, by Application 2019 & 2032
- Table 52: Saudi Arabia Gas Separation Membrane Market Volume (K Tons) Forecast, by Application 2019 & 2032
- Table 53: South Africa Gas Separation Membrane Market Revenue (Million) Forecast, by Application 2019 & 2032
- Table 54: South Africa Gas Separation Membrane Market Volume (K Tons) Forecast, by Application 2019 & 2032
- Table 55: Rest of Middle East and Africa Gas Separation Membrane Market Revenue (Million) Forecast, by Application 2019 & 2032
- Table 56: Rest of Middle East and Africa Gas Separation Membrane Market Volume (K Tons) Forecast, by Application 2019 & 2032
- Table 57: Global Gas Separation Membrane Market Revenue Million Forecast, by Material Type 2019 & 2032
- Table 58: Global Gas Separation Membrane Market Volume K Tons Forecast, by Material Type 2019 & 2032
- Table 59: Global Gas Separation Membrane Market Revenue Million Forecast, by Application 2019 & 2032
- Table 60: Global Gas Separation Membrane Market Volume K Tons Forecast, by Application 2019 & 2032
- Table 61: Global Gas Separation Membrane Market Revenue Million Forecast, by Country 2019 & 2032
- Table 62: Global Gas Separation Membrane Market Volume K Tons Forecast, by Country 2019 & 2032
- Table 63: China Gas Separation Membrane Market Revenue (Million) Forecast, by Application 2019 & 2032
- Table 64: China Gas Separation Membrane Market Volume (K Tons) Forecast, by Application 2019 & 2032
- Table 65: India Gas Separation Membrane Market Revenue (Million) Forecast, by Application 2019 & 2032
- Table 66: India Gas Separation Membrane Market Volume (K Tons) Forecast, by Application 2019 & 2032
- Table 67: Japan Gas Separation Membrane Market Revenue (Million) Forecast, by Application 2019 & 2032
- Table 68: Japan Gas Separation Membrane Market Volume (K Tons) Forecast, by Application 2019 & 2032
- Table 69: South Korea Gas Separation Membrane Market Revenue (Million) Forecast, by Application 2019 & 2032
- Table 70: South Korea Gas Separation Membrane Market Volume (K Tons) Forecast, by Application 2019 & 2032
- Table 71: Malaysia Gas Separation Membrane Market Revenue (Million) Forecast, by Application 2019 & 2032
- Table 72: Malaysia Gas Separation Membrane Market Volume (K Tons) Forecast, by Application 2019 & 2032
- Table 73: Thailand Gas Separation Membrane Market Revenue (Million) Forecast, by Application 2019 & 2032
- Table 74: Thailand Gas Separation Membrane Market Volume (K Tons) Forecast, by Application 2019 & 2032
- Table 75: Indonesia Gas Separation Membrane Market Revenue (Million) Forecast, by Application 2019 & 2032
- Table 76: Indonesia Gas Separation Membrane Market Volume (K Tons) Forecast, by Application 2019 & 2032
- Table 77: Vietnam Gas Separation Membrane Market Revenue (Million) Forecast, by Application 2019 & 2032
- Table 78: Vietnam Gas Separation Membrane Market Volume (K Tons) Forecast, by Application 2019 & 2032
- Table 79: Rest of Asia Pacific Gas Separation Membrane Market Revenue (Million) Forecast, by Application 2019 & 2032
- Table 80: Rest of Asia Pacific Gas Separation Membrane Market Volume (K Tons) Forecast, by Application 2019 & 2032
- Table 81: Global Gas Separation Membrane Market Revenue Million Forecast, by Material Type 2019 & 2032
- Table 82: Global Gas Separation Membrane Market Volume K Tons Forecast, by Material Type 2019 & 2032
- Table 83: Global Gas Separation Membrane Market Revenue Million Forecast, by Application 2019 & 2032
- Table 84: Global Gas Separation Membrane Market Volume K Tons Forecast, by Application 2019 & 2032
- Table 85: Global Gas Separation Membrane Market Revenue Million Forecast, by Country 2019 & 2032
- Table 86: Global Gas Separation Membrane Market Volume K Tons Forecast, by Country 2019 & 2032
- Table 87: United States Gas Separation Membrane Market Revenue (Million) Forecast, by Application 2019 & 2032
- Table 88: United States Gas Separation Membrane Market Volume (K Tons) Forecast, by Application 2019 & 2032
- Table 89: Canada Gas Separation Membrane Market Revenue (Million) Forecast, by Application 2019 & 2032
- Table 90: Canada Gas Separation Membrane Market Volume (K Tons) Forecast, by Application 2019 & 2032
- Table 91: Mexico Gas Separation Membrane Market Revenue (Million) Forecast, by Application 2019 & 2032
- Table 92: Mexico Gas Separation Membrane Market Volume (K Tons) Forecast, by Application 2019 & 2032
- Table 93: Global Gas Separation Membrane Market Revenue Million Forecast, by Material Type 2019 & 2032
- Table 94: Global Gas Separation Membrane Market Volume K Tons Forecast, by Material Type 2019 & 2032
- Table 95: Global Gas Separation Membrane Market Revenue Million Forecast, by Application 2019 & 2032
- Table 96: Global Gas Separation Membrane Market Volume K Tons Forecast, by Application 2019 & 2032
- Table 97: Global Gas Separation Membrane Market Revenue Million Forecast, by Country 2019 & 2032
- Table 98: Global Gas Separation Membrane Market Volume K Tons Forecast, by Country 2019 & 2032
- Table 99: Germany Gas Separation Membrane Market Revenue (Million) Forecast, by Application 2019 & 2032
- Table 100: Germany Gas Separation Membrane Market Volume (K Tons) Forecast, by Application 2019 & 2032
- Table 101: United Kingdom Gas Separation Membrane Market Revenue (Million) Forecast, by Application 2019 & 2032
- Table 102: United Kingdom Gas Separation Membrane Market Volume (K Tons) Forecast, by Application 2019 & 2032
- Table 103: Italy Gas Separation Membrane Market Revenue (Million) Forecast, by Application 2019 & 2032
- Table 104: Italy Gas Separation Membrane Market Volume (K Tons) Forecast, by Application 2019 & 2032
- Table 105: France Gas Separation Membrane Market Revenue (Million) Forecast, by Application 2019 & 2032
- Table 106: France Gas Separation Membrane Market Volume (K Tons) Forecast, by Application 2019 & 2032
- Table 107: Spain Gas Separation Membrane Market Revenue (Million) Forecast, by Application 2019 & 2032
- Table 108: Spain Gas Separation Membrane Market Volume (K Tons) Forecast, by Application 2019 & 2032
- Table 109: Turkey Gas Separation Membrane Market Revenue (Million) Forecast, by Application 2019 & 2032
- Table 110: Turkey Gas Separation Membrane Market Volume (K Tons) Forecast, by Application 2019 & 2032
- Table 111: Russia Gas Separation Membrane Market Revenue (Million) Forecast, by Application 2019 & 2032
- Table 112: Russia Gas Separation Membrane Market Volume (K Tons) Forecast, by Application 2019 & 2032
- Table 113: NORDIC Gas Separation Membrane Market Revenue (Million) Forecast, by Application 2019 & 2032
- Table 114: NORDIC Gas Separation Membrane Market Volume (K Tons) Forecast, by Application 2019 & 2032
- Table 115: Rest of Europe Gas Separation Membrane Market Revenue (Million) Forecast, by Application 2019 & 2032
- Table 116: Rest of Europe Gas Separation Membrane Market Volume (K Tons) Forecast, by Application 2019 & 2032
- Table 117: Global Gas Separation Membrane Market Revenue Million Forecast, by Material Type 2019 & 2032
- Table 118: Global Gas Separation Membrane Market Volume K Tons Forecast, by Material Type 2019 & 2032
- Table 119: Global Gas Separation Membrane Market Revenue Million Forecast, by Application 2019 & 2032
- Table 120: Global Gas Separation Membrane Market Volume K Tons Forecast, by Application 2019 & 2032
- Table 121: Global Gas Separation Membrane Market Revenue Million Forecast, by Country 2019 & 2032
- Table 122: Global Gas Separation Membrane Market Volume K Tons Forecast, by Country 2019 & 2032
- Table 123: Brazil Gas Separation Membrane Market Revenue (Million) Forecast, by Application 2019 & 2032
- Table 124: Brazil Gas Separation Membrane Market Volume (K Tons) Forecast, by Application 2019 & 2032
- Table 125: Argentina Gas Separation Membrane Market Revenue (Million) Forecast, by Application 2019 & 2032
- Table 126: Argentina Gas Separation Membrane Market Volume (K Tons) Forecast, by Application 2019 & 2032
- Table 127: Colombia Gas Separation Membrane Market Revenue (Million) Forecast, by Application 2019 & 2032
- Table 128: Colombia Gas Separation Membrane Market Volume (K Tons) Forecast, by Application 2019 & 2032
- Table 129: Rest of South America Gas Separation Membrane Market Revenue (Million) Forecast, by Application 2019 & 2032
- Table 130: Rest of South America Gas Separation Membrane Market Volume (K Tons) Forecast, by Application 2019 & 2032
- Table 131: Global Gas Separation Membrane Market Revenue Million Forecast, by Material Type 2019 & 2032
- Table 132: Global Gas Separation Membrane Market Volume K Tons Forecast, by Material Type 2019 & 2032
- Table 133: Global Gas Separation Membrane Market Revenue Million Forecast, by Application 2019 & 2032
- Table 134: Global Gas Separation Membrane Market Volume K Tons Forecast, by Application 2019 & 2032
- Table 135: Global Gas Separation Membrane Market Revenue Million Forecast, by Country 2019 & 2032
- Table 136: Global Gas Separation Membrane Market Volume K Tons Forecast, by Country 2019 & 2032
- Table 137: Saudi Arabia Gas Separation Membrane Market Revenue (Million) Forecast, by Application 2019 & 2032
- Table 138: Saudi Arabia Gas Separation Membrane Market Volume (K Tons) Forecast, by Application 2019 & 2032
- Table 139: South Africa Gas Separation Membrane Market Revenue (Million) Forecast, by Application 2019 & 2032
- Table 140: South Africa Gas Separation Membrane Market Volume (K Tons) Forecast, by Application 2019 & 2032
- Table 141: Nigeria Gas Separation Membrane Market Revenue (Million) Forecast, by Application 2019 & 2032
- Table 142: Nigeria Gas Separation Membrane Market Volume (K Tons) Forecast, by Application 2019 & 2032
- Table 143: Qatar Gas Separation Membrane Market Revenue (Million) Forecast, by Application 2019 & 2032
- Table 144: Qatar Gas Separation Membrane Market Volume (K Tons) Forecast, by Application 2019 & 2032
- Table 145: Egypt Gas Separation Membrane Market Revenue (Million) Forecast, by Application 2019 & 2032
- Table 146: Egypt Gas Separation Membrane Market Volume (K Tons) Forecast, by Application 2019 & 2032
- Table 147: UAE Gas Separation Membrane Market Revenue (Million) Forecast, by Application 2019 & 2032
- Table 148: UAE Gas Separation Membrane Market Volume (K Tons) Forecast, by Application 2019 & 2032
- Table 149: Rest of Middle East and Africa Gas Separation Membrane Market Revenue (Million) Forecast, by Application 2019 & 2032
- Table 150: Rest of Middle East and Africa Gas Separation Membrane Market Volume (K Tons) Forecast, by Application 2019 & 2032
Frequently Asked Questions
1. What is the projected Compound Annual Growth Rate (CAGR) of the Gas Separation Membrane Market?
The projected CAGR is approximately 5.87%.
2. Which companies are prominent players in the Gas Separation Membrane Market?
Key companies in the market include Linde PLC, DIC Corporation, Honeywell International Inc, Air Products and Chemicals Inc, UBE Corporation*List Not Exhaustive, Toray Industries Inc, SLB (schlumberger), Evonik Industries AG, Fujifilm Corporation, Air Liquide Advanced Separations, Generon, Parker Hannifin Corp, Membrane Technology and Research Inc.
3. What are the main segments of the Gas Separation Membrane Market?
The market segments include Material Type, Application.
4. Can you provide details about the market size?
The market size is estimated to be USD 1.97 Million as of 2022.
5. What are some drivers contributing to market growth?
Increasing Demand for Membranes in Carbon Dioxide Separation Processes; Strict Government Norms Toward GHG Emissions.
6. What are the notable trends driving market growth?
Nitrogen Generation and Oxygen Enrichment Application to Dominate the Market.
7. Are there any restraints impacting market growth?
Plasticization of Polymeric Membranes in High-Temperature Applications; Upscaling and Adoption of New Membranes.
8. Can you provide examples of recent developments in the market?
January 2023: UBE Corporation announced the expansion of its polyimide hollow fiber production facilities for gas separation membranes at its Ube Chemical Factory and the gas separation membrane module production facilities at its Sakai Factory in order to meet rapidly growing demand, particularly for CO2 separation membranes. Both expanded facilities are scheduled to go online in the first half of fiscal 2025, increasing production capacity by about 1.8 times.
9. What pricing options are available for accessing the report?
Pricing options include single-user, multi-user, and enterprise licenses priced at USD 4750, USD 5250, and USD 8750 respectively.
10. Is the market size provided in terms of value or volume?
The market size is provided in terms of value, measured in Million and volume, measured in K Tons.
11. Are there any specific market keywords associated with the report?
Yes, the market keyword associated with the report is "Gas Separation Membrane Market," which aids in identifying and referencing the specific market segment covered.
12. How do I determine which pricing option suits my needs best?
The pricing options vary based on user requirements and access needs. Individual users may opt for single-user licenses, while businesses requiring broader access may choose multi-user or enterprise licenses for cost-effective access to the report.
13. Are there any additional resources or data provided in the Gas Separation Membrane Market report?
While the report offers comprehensive insights, it's advisable to review the specific contents or supplementary materials provided to ascertain if additional resources or data are available.
14. How can I stay updated on further developments or reports in the Gas Separation Membrane Market?
To stay informed about further developments, trends, and reports in the Gas Separation Membrane Market, consider subscribing to industry newsletters, following relevant companies and organizations, or regularly checking reputable industry news sources and publications.
Methodology
Step 1 - Identification of Relevant Samples Size from Population Database


Step 2 - Approaches for Defining Global Market Size (Value, Volume* & Price*)

Note*: In applicable scenarios
Step 3 - Data Sources
Primary Research
- Web Analytics
- Survey Reports
- Research Institute
- Latest Research Reports
- Opinion Leaders
Secondary Research
- Annual Reports
- White Paper
- Latest Press Release
- Industry Association
- Paid Database
- Investor Presentations

Step 4 - Data Triangulation
Involves using different sources of information in order to increase the validity of a study
These sources are likely to be stakeholders in a program - participants, other researchers, program staff, other community members, and so on.
Then we put all data in single framework & apply various statistical tools to find out the dynamic on the market.
During the analysis stage, feedback from the stakeholder groups would be compared to determine areas of agreement as well as areas of divergence


