
Key Insights
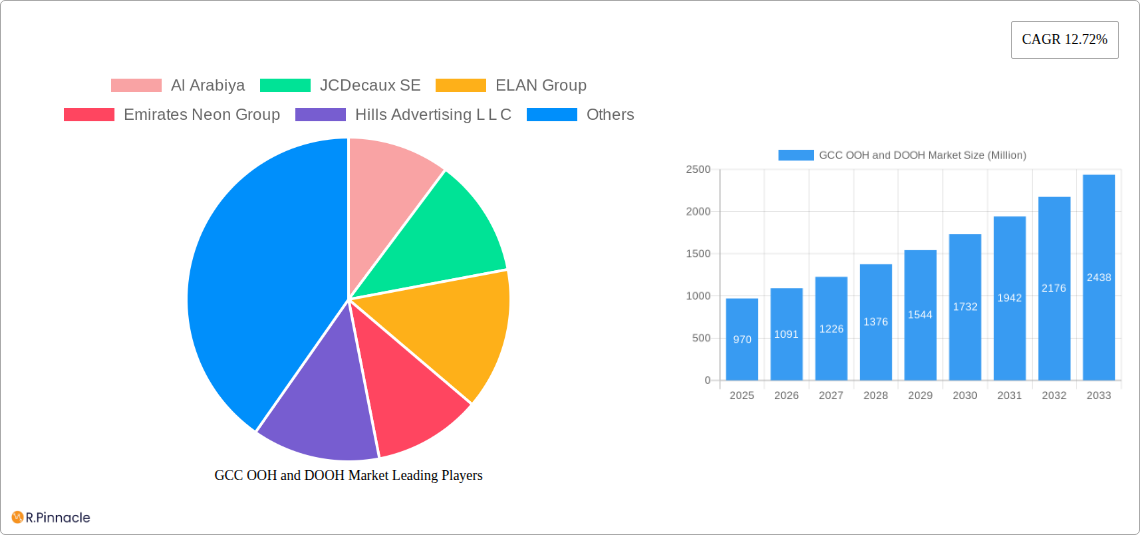
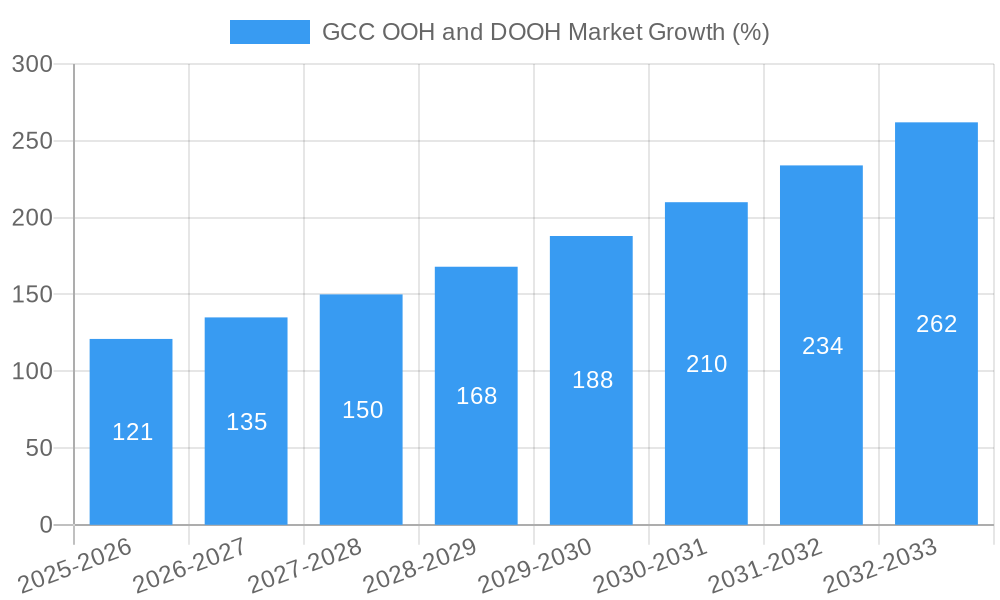
The GCC OOH (Out-of-Home) and DOOH (Digital Out-of-Home) advertising market is experiencing robust growth, projected to reach a market size of $0.97 billion in 2025, exhibiting a Compound Annual Growth Rate (CAGR) of 12.72% from 2019 to 2033. This significant expansion is fueled by several key drivers. Increasing urbanization and population density within the GCC region create a larger audience for OOH advertising, particularly in high-traffic areas like malls, airports, and public transportation hubs. Furthermore, the rising adoption of digital technologies is transforming the OOH landscape, with DOOH formats offering advanced targeting capabilities, real-time data analytics, and dynamic content updates. This shift towards DOOH allows advertisers to better engage with their target audiences and measure campaign effectiveness, contributing substantially to market growth. The increasing investment in smart city infrastructure also plays a crucial role, providing numerous opportunities for innovative DOOH placements and technological integrations. Finally, the region's thriving tourism sector and major sporting and cultural events further enhance the appeal of OOH advertising as a powerful medium for reaching diverse demographics.
Despite the positive growth trajectory, the market faces certain challenges. Competition among numerous OOH and DOOH providers, including both established players like JCDecaux SE and emerging companies like Dooha Media, necessitates strategic differentiation and innovative solutions to maintain market share. The relatively high cost of implementing and maintaining DOOH infrastructure, especially in newer technologies, can be a barrier to entry for smaller companies. Additionally, the market's susceptibility to macroeconomic fluctuations, such as changes in oil prices and global economic downturns, poses a risk to long-term growth. However, the ongoing diversification of the GCC economies and the government's focus on infrastructure development should mitigate these risks in the long run, continuing the positive trend in OOH and DOOH advertising investment and growth throughout the forecast period.
GCC OOH and DOOH Market: A Comprehensive Report (2019-2033)
This report provides a detailed analysis of the GCC Out-of-Home (OOH) and Digital Out-of-Home (DOOH) advertising market, covering the period from 2019 to 2033. It offers invaluable insights for industry professionals, investors, and anyone seeking to understand this dynamic market's growth trajectory. The report leverages extensive market research and data analysis to deliver actionable intelligence.
GCC OOH and DOOH Market Structure & Innovation Trends
This section analyzes the market structure, highlighting key players, their market share, and recent mergers and acquisitions (M&A) activities. It also delves into innovation drivers, regulatory frameworks, and competitive dynamics. The study period is 2019-2033, with 2025 as the base and estimated year.
Market Concentration: The GCC OOH and DOOH market exhibits a moderately concentrated structure, with several major players holding significant market shares. Precise market share figures for individual companies are unavailable but estimations suggest the top five players likely account for xx% of the total market. This concentration is expected to remain fairly stable through the forecast period.
Innovation Drivers: Technological advancements, particularly in digital display technology and programmatic advertising, are key drivers of innovation. The increasing adoption of data-driven strategies and interactive elements further fuels market innovation. Growing consumer preference for engaging and targeted advertising adds momentum.
Regulatory Frameworks: Government regulations concerning advertising placement, content, and safety standards influence market dynamics significantly. Changes in these regulations directly impact the growth and expansion plans of OOH and DOOH advertising firms.
Product Substitutes: While OOH and DOOH advertising holds a unique position, other advertising mediums, such as digital marketing and social media, pose competitive pressures and serve as potential substitutes. The report evaluates the competitive landscape and potential impact of these alternatives.
End-User Demographics: The report analyzes the demographic profile of the target audience, identifying key segments and trends in consumer behavior related to OOH and DOOH advertising. This analysis helps to pinpoint the most effective advertising strategies.
M&A Activities: The GCC OOH and DOOH market has witnessed several M&A activities during the historical period (2019-2024). While specific deal values are not available for all transactions, the Al Arabia OOH deal with Dubai's RTA for AED 522.84 Million (USD 142 Million) represents a significant transaction, highlighting the consolidation trends within the industry.
GCC OOH and DOOH Market Dynamics & Trends
This section explores the market dynamics, including growth drivers, technological disruptions, consumer preferences, and competitive landscape. The report analyzes various factors shaping market growth, utilizing key metrics like the Compound Annual Growth Rate (CAGR) and market penetration rates. The forecast period is 2025-2033.
The GCC OOH and DOOH market is experiencing robust growth driven by several factors. Increased urbanization and rising disposable incomes fuel the demand for advertising space. Furthermore, the growing adoption of digital technologies within the OOH landscape, particularly DOOH, enhances advertising effectiveness and measurement capabilities. Government initiatives supporting infrastructure development in the region further contribute to market expansion. Competitive dynamics are characterized by a combination of both established and emerging players constantly striving to innovate and secure market share, leading to a dynamic competitive landscape with evolving strategies. Market penetration remains high in key urban areas, while opportunities exist in less-developed regions. The report projects a CAGR of xx% for the forecast period, reflecting significant market expansion. The report delves deeper into these trends, providing detailed data analysis and projections for the coming years.
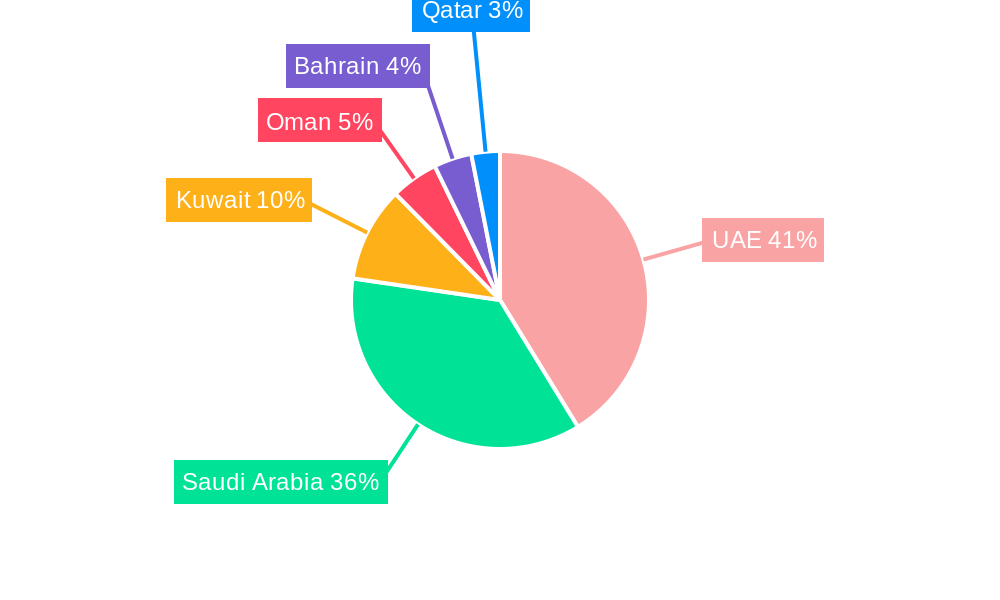
Dominant Regions & Segments in GCC OOH and DOOH Market
This section identifies the leading regions and segments within the GCC OOH and DOOH market. The analysis considers various factors influencing regional dominance, including economic development, infrastructure investments, and government regulations.
UAE Dominance: The UAE consistently leads the GCC region in OOH and DOOH advertising expenditure. Key factors underpinning this dominance include:
- Robust Economic Growth: The UAE's strong economy and high disposable income levels contribute to elevated advertising budgets across various sectors.
- Developed Infrastructure: Extensive road networks, high-density urban areas, and strategic locations for OOH and DOOH placements significantly enhance advertising visibility and impact.
- Pro-Business Environment: The UAE’s business-friendly environment attracts significant investment in advertising and media technologies.
Saudi Arabia Growth: Saudi Arabia exhibits a rapidly developing OOH and DOOH sector, experiencing substantial growth driven by significant infrastructure projects, government initiatives, and the country’s Vision 2030 strategy.
Other GCC Countries: While the UAE and Saudi Arabia dominate, Qatar, Oman, Kuwait, and Bahrain show promise for OOH and DOOH advertising growth. However, their markets remain comparatively smaller.
GCC OOH and DOOH Market Product Innovations
The GCC OOH and DOOH market is witnessing rapid technological advancements. The adoption of LED displays with higher resolutions and improved brightness offers enhanced visual appeal. Programmatic advertising capabilities allow for targeted and efficient ad delivery. Interactive DOOH screens provide engaging experiences, boosting audience engagement and recall. This evolution aligns seamlessly with market demands for more effective and data-driven advertising solutions.
Report Scope & Segmentation Analysis
This report offers a comprehensive segmentation analysis, encompassing various aspects of the GCC OOH and DOOH market.
By Type: The market is segmented into traditional OOH (billboards, posters, transit advertising) and DOOH (digital billboards, LED screens, interactive displays). DOOH is expected to experience faster growth due to technological advancements and increased targeting capabilities.
By Location: Segmentation based on location includes urban, suburban, and rural areas. Urban areas dominate due to high population density and foot traffic.
By Industry: The report categorizes advertising expenditure based on different industries like retail, automotive, finance, and FMCG, analyzing each sector's contribution to overall market growth.
By Format: Different advertising formats, including static and dynamic displays, are considered.
Key Drivers of GCC OOH and DOOH Market Growth
Several factors are driving the expansion of the GCC OOH and DOOH market. Firstly, increased urbanization and rising disposable incomes contribute to the growth. Secondly, technological advancements, such as the integration of digital technology with OOH platforms, have enabled more effective targeting and measurement of advertising campaigns. Lastly, government support for infrastructure development, creating better opportunities for OOH placement, accelerates this growth.
Challenges in the GCC OOH and DOOH Market Sector
The GCC OOH and DOOH sector faces certain challenges. Firstly, competition from other advertising channels, such as digital marketing, necessitates constant innovation and adaptation. Secondly, regulatory changes and varying local guidelines for advertising content and placement introduce complexity in operations and compliance. Lastly, fluctuations in economic growth can impact overall advertising expenditures, potentially affecting the market's expansion trajectory.
Emerging Opportunities in GCC OOH and DOOH Market
Several opportunities exist for future growth. The expansion of DOOH advertising into less-developed regions within the GCC presents a significant opportunity for market expansion. The integration of new technologies, such as augmented reality and artificial intelligence, offers exciting possibilities for enhanced interactive advertising experiences. Furthermore, a greater emphasis on data analytics and performance measurement enables more effective targeting and campaign optimization, presenting further growth opportunities.
Leading Players in the GCC OOH and DOOH Market Market
- Al Arabiya
- JCDecaux SE (JCDecaux SE)
- ELAN Group
- Emirates Neon Group
- Hills Advertising L L C
- Dooha Media
- BackLite Media LLC
- Daktronics Inc (Daktronics Inc)
- Hypermedia FZ-LLC
- Abu Dhabi Media Network
Key Developments in GCC OOH and DOOH Market Industry
- January 2024: Al Arabia OOH secured a USD 142 Million contract with Dubai's RTA for billboard installations and management.
- February 2024: Promomedia launched an OOH advertising initiative in Qatar at Al Maha Island, featuring LED displays and billboards.
- May 2024: ELAN Media partnered with WOQOD to install DOOH screens at five key petrol stations across Qatar.
Future Outlook for GCC OOH and DOOH Market Market
The GCC OOH and DOOH market is poised for continued growth, driven by technological advancements, rising disposable incomes, and increasing urbanization. Strategic partnerships and investments in innovative advertising formats, coupled with data-driven strategies, will further enhance market growth. The market is expected to remain dynamic, with continuous innovation and competitive pressures shaping its future trajectory.
GCC OOH and DOOH Market Segmentation
-
1. Type
- 1.1. Static (Traditional) OOH
-
1.2. Digital OOH (LED Screens)
- 1.2.1. Programmatic OOH
- 1.2.2. Others
-
2. Appli
- 2.1. Billboard
-
2.2. Transportation (Transit)
- 2.2.1. Airports
- 2.2.2. Others (Buses, etc.)
- 2.3. Street Furniture
- 2.4. Other Place-Based Media
-
3. End-U
- 3.1. Automotive
- 3.2. Retail and Consumer Goods
- 3.3. Healthcare
- 3.4. BFSI
- 3.5. Other End Users
GCC OOH and DOOH Market Segmentation By Geography
-
1. North America
- 1.1. United States
- 1.2. Canada
- 1.3. Mexico
-
2. South America
- 2.1. Brazil
- 2.2. Argentina
- 2.3. Rest of South America
-
3. Europe
- 3.1. United Kingdom
- 3.2. Germany
- 3.3. France
- 3.4. Italy
- 3.5. Spain
- 3.6. Russia
- 3.7. Benelux
- 3.8. Nordics
- 3.9. Rest of Europe
-
4. Middle East & Africa
- 4.1. Turkey
- 4.2. Israel
- 4.3. GCC
- 4.4. North Africa
- 4.5. South Africa
- 4.6. Rest of Middle East & Africa
-
5. Asia Pacific
- 5.1. China
- 5.2. India
- 5.3. Japan
- 5.4. South Korea
- 5.5. ASEAN
- 5.6. Oceania
- 5.7. Rest of Asia Pacific
GCC OOH and DOOH Market REPORT HIGHLIGHTS
| Aspects | Details |
|---|---|
| Study Period | 2019-2033 |
| Base Year | 2024 |
| Estimated Year | 2025 |
| Forecast Period | 2025-2033 |
| Historical Period | 2019-2024 |
| Growth Rate | CAGR of 12.72% from 2019-2033 |
| Segmentation |
|
Table of Contents
- 1. Introduction
- 1.1. Research Scope
- 1.2. Market Segmentation
- 1.3. Research Methodology
- 1.4. Definitions and Assumptions
- 2. Executive Summary
- 2.1. Introduction
- 3. Market Dynamics
- 3.1. Introduction
- 3.2. Market Drivers
- 3.2.1. Ongoing Shift Towards Digital Advertising; Increasing Use of Recommendation Engines
- 3.3. Market Restrains
- 3.3.1. Ongoing Shift Towards Digital Advertising; Increasing Use of Recommendation Engines
- 3.4. Market Trends
- 3.4.1. Ongoing Shift toward Digital Advertising is expected to boost the Market Growth
- 4. Market Factor Analysis
- 4.1. Porters Five Forces
- 4.2. Supply/Value Chain
- 4.3. PESTEL analysis
- 4.4. Market Entropy
- 4.5. Patent/Trademark Analysis
- 5. Global GCC OOH and DOOH Market Analysis, Insights and Forecast, 2019-2031
- 5.1. Market Analysis, Insights and Forecast - by Type
- 5.1.1. Static (Traditional) OOH
- 5.1.2. Digital OOH (LED Screens)
- 5.1.2.1. Programmatic OOH
- 5.1.2.2. Others
- 5.2. Market Analysis, Insights and Forecast - by Appli
- 5.2.1. Billboard
- 5.2.2. Transportation (Transit)
- 5.2.2.1. Airports
- 5.2.2.2. Others (Buses, etc.)
- 5.2.3. Street Furniture
- 5.2.4. Other Place-Based Media
- 5.3. Market Analysis, Insights and Forecast - by End-U
- 5.3.1. Automotive
- 5.3.2. Retail and Consumer Goods
- 5.3.3. Healthcare
- 5.3.4. BFSI
- 5.3.5. Other End Users
- 5.4. Market Analysis, Insights and Forecast - by Region
- 5.4.1. North America
- 5.4.2. South America
- 5.4.3. Europe
- 5.4.4. Middle East & Africa
- 5.4.5. Asia Pacific
- 5.1. Market Analysis, Insights and Forecast - by Type
- 6. North America GCC OOH and DOOH Market Analysis, Insights and Forecast, 2019-2031
- 6.1. Market Analysis, Insights and Forecast - by Type
- 6.1.1. Static (Traditional) OOH
- 6.1.2. Digital OOH (LED Screens)
- 6.1.2.1. Programmatic OOH
- 6.1.2.2. Others
- 6.2. Market Analysis, Insights and Forecast - by Appli
- 6.2.1. Billboard
- 6.2.2. Transportation (Transit)
- 6.2.2.1. Airports
- 6.2.2.2. Others (Buses, etc.)
- 6.2.3. Street Furniture
- 6.2.4. Other Place-Based Media
- 6.3. Market Analysis, Insights and Forecast - by End-U
- 6.3.1. Automotive
- 6.3.2. Retail and Consumer Goods
- 6.3.3. Healthcare
- 6.3.4. BFSI
- 6.3.5. Other End Users
- 6.1. Market Analysis, Insights and Forecast - by Type
- 7. South America GCC OOH and DOOH Market Analysis, Insights and Forecast, 2019-2031
- 7.1. Market Analysis, Insights and Forecast - by Type
- 7.1.1. Static (Traditional) OOH
- 7.1.2. Digital OOH (LED Screens)
- 7.1.2.1. Programmatic OOH
- 7.1.2.2. Others
- 7.2. Market Analysis, Insights and Forecast - by Appli
- 7.2.1. Billboard
- 7.2.2. Transportation (Transit)
- 7.2.2.1. Airports
- 7.2.2.2. Others (Buses, etc.)
- 7.2.3. Street Furniture
- 7.2.4. Other Place-Based Media
- 7.3. Market Analysis, Insights and Forecast - by End-U
- 7.3.1. Automotive
- 7.3.2. Retail and Consumer Goods
- 7.3.3. Healthcare
- 7.3.4. BFSI
- 7.3.5. Other End Users
- 7.1. Market Analysis, Insights and Forecast - by Type
- 8. Europe GCC OOH and DOOH Market Analysis, Insights and Forecast, 2019-2031
- 8.1. Market Analysis, Insights and Forecast - by Type
- 8.1.1. Static (Traditional) OOH
- 8.1.2. Digital OOH (LED Screens)
- 8.1.2.1. Programmatic OOH
- 8.1.2.2. Others
- 8.2. Market Analysis, Insights and Forecast - by Appli
- 8.2.1. Billboard
- 8.2.2. Transportation (Transit)
- 8.2.2.1. Airports
- 8.2.2.2. Others (Buses, etc.)
- 8.2.3. Street Furniture
- 8.2.4. Other Place-Based Media
- 8.3. Market Analysis, Insights and Forecast - by End-U
- 8.3.1. Automotive
- 8.3.2. Retail and Consumer Goods
- 8.3.3. Healthcare
- 8.3.4. BFSI
- 8.3.5. Other End Users
- 8.1. Market Analysis, Insights and Forecast - by Type
- 9. Middle East & Africa GCC OOH and DOOH Market Analysis, Insights and Forecast, 2019-2031
- 9.1. Market Analysis, Insights and Forecast - by Type
- 9.1.1. Static (Traditional) OOH
- 9.1.2. Digital OOH (LED Screens)
- 9.1.2.1. Programmatic OOH
- 9.1.2.2. Others
- 9.2. Market Analysis, Insights and Forecast - by Appli
- 9.2.1. Billboard
- 9.2.2. Transportation (Transit)
- 9.2.2.1. Airports
- 9.2.2.2. Others (Buses, etc.)
- 9.2.3. Street Furniture
- 9.2.4. Other Place-Based Media
- 9.3. Market Analysis, Insights and Forecast - by End-U
- 9.3.1. Automotive
- 9.3.2. Retail and Consumer Goods
- 9.3.3. Healthcare
- 9.3.4. BFSI
- 9.3.5. Other End Users
- 9.1. Market Analysis, Insights and Forecast - by Type
- 10. Asia Pacific GCC OOH and DOOH Market Analysis, Insights and Forecast, 2019-2031
- 10.1. Market Analysis, Insights and Forecast - by Type
- 10.1.1. Static (Traditional) OOH
- 10.1.2. Digital OOH (LED Screens)
- 10.1.2.1. Programmatic OOH
- 10.1.2.2. Others
- 10.2. Market Analysis, Insights and Forecast - by Appli
- 10.2.1. Billboard
- 10.2.2. Transportation (Transit)
- 10.2.2.1. Airports
- 10.2.2.2. Others (Buses, etc.)
- 10.2.3. Street Furniture
- 10.2.4. Other Place-Based Media
- 10.3. Market Analysis, Insights and Forecast - by End-U
- 10.3.1. Automotive
- 10.3.2. Retail and Consumer Goods
- 10.3.3. Healthcare
- 10.3.4. BFSI
- 10.3.5. Other End Users
- 10.1. Market Analysis, Insights and Forecast - by Type
- 11. Competitive Analysis
- 11.1. Global Market Share Analysis 2024
- 11.2. Company Profiles
- 11.2.1 Al Arabiya
- 11.2.1.1. Overview
- 11.2.1.2. Products
- 11.2.1.3. SWOT Analysis
- 11.2.1.4. Recent Developments
- 11.2.1.5. Financials (Based on Availability)
- 11.2.2 JCDecaux SE
- 11.2.2.1. Overview
- 11.2.2.2. Products
- 11.2.2.3. SWOT Analysis
- 11.2.2.4. Recent Developments
- 11.2.2.5. Financials (Based on Availability)
- 11.2.3 ELAN Group
- 11.2.3.1. Overview
- 11.2.3.2. Products
- 11.2.3.3. SWOT Analysis
- 11.2.3.4. Recent Developments
- 11.2.3.5. Financials (Based on Availability)
- 11.2.4 Emirates Neon Group
- 11.2.4.1. Overview
- 11.2.4.2. Products
- 11.2.4.3. SWOT Analysis
- 11.2.4.4. Recent Developments
- 11.2.4.5. Financials (Based on Availability)
- 11.2.5 Hills Advertising L L C
- 11.2.5.1. Overview
- 11.2.5.2. Products
- 11.2.5.3. SWOT Analysis
- 11.2.5.4. Recent Developments
- 11.2.5.5. Financials (Based on Availability)
- 11.2.6 Dooha Media
- 11.2.6.1. Overview
- 11.2.6.2. Products
- 11.2.6.3. SWOT Analysis
- 11.2.6.4. Recent Developments
- 11.2.6.5. Financials (Based on Availability)
- 11.2.7 BackLite Media LLC
- 11.2.7.1. Overview
- 11.2.7.2. Products
- 11.2.7.3. SWOT Analysis
- 11.2.7.4. Recent Developments
- 11.2.7.5. Financials (Based on Availability)
- 11.2.8 Daktronics Inc
- 11.2.8.1. Overview
- 11.2.8.2. Products
- 11.2.8.3. SWOT Analysis
- 11.2.8.4. Recent Developments
- 11.2.8.5. Financials (Based on Availability)
- 11.2.9 Hypermedia FZ-LLC
- 11.2.9.1. Overview
- 11.2.9.2. Products
- 11.2.9.3. SWOT Analysis
- 11.2.9.4. Recent Developments
- 11.2.9.5. Financials (Based on Availability)
- 11.2.10 Abu Dhabi Media Networ
- 11.2.10.1. Overview
- 11.2.10.2. Products
- 11.2.10.3. SWOT Analysis
- 11.2.10.4. Recent Developments
- 11.2.10.5. Financials (Based on Availability)
- 11.2.1 Al Arabiya
List of Figures
- Figure 1: Global GCC OOH and DOOH Market Revenue Breakdown (Million, %) by Region 2024 & 2032
- Figure 2: Global GCC OOH and DOOH Market Volume Breakdown (Billion, %) by Region 2024 & 2032
- Figure 3: North America GCC OOH and DOOH Market Revenue (Million), by Type 2024 & 2032
- Figure 4: North America GCC OOH and DOOH Market Volume (Billion), by Type 2024 & 2032
- Figure 5: North America GCC OOH and DOOH Market Revenue Share (%), by Type 2024 & 2032
- Figure 6: North America GCC OOH and DOOH Market Volume Share (%), by Type 2024 & 2032
- Figure 7: North America GCC OOH and DOOH Market Revenue (Million), by Appli 2024 & 2032
- Figure 8: North America GCC OOH and DOOH Market Volume (Billion), by Appli 2024 & 2032
- Figure 9: North America GCC OOH and DOOH Market Revenue Share (%), by Appli 2024 & 2032
- Figure 10: North America GCC OOH and DOOH Market Volume Share (%), by Appli 2024 & 2032
- Figure 11: North America GCC OOH and DOOH Market Revenue (Million), by End-U 2024 & 2032
- Figure 12: North America GCC OOH and DOOH Market Volume (Billion), by End-U 2024 & 2032
- Figure 13: North America GCC OOH and DOOH Market Revenue Share (%), by End-U 2024 & 2032
- Figure 14: North America GCC OOH and DOOH Market Volume Share (%), by End-U 2024 & 2032
- Figure 15: North America GCC OOH and DOOH Market Revenue (Million), by Country 2024 & 2032
- Figure 16: North America GCC OOH and DOOH Market Volume (Billion), by Country 2024 & 2032
- Figure 17: North America GCC OOH and DOOH Market Revenue Share (%), by Country 2024 & 2032
- Figure 18: North America GCC OOH and DOOH Market Volume Share (%), by Country 2024 & 2032
- Figure 19: South America GCC OOH and DOOH Market Revenue (Million), by Type 2024 & 2032
- Figure 20: South America GCC OOH and DOOH Market Volume (Billion), by Type 2024 & 2032
- Figure 21: South America GCC OOH and DOOH Market Revenue Share (%), by Type 2024 & 2032
- Figure 22: South America GCC OOH and DOOH Market Volume Share (%), by Type 2024 & 2032
- Figure 23: South America GCC OOH and DOOH Market Revenue (Million), by Appli 2024 & 2032
- Figure 24: South America GCC OOH and DOOH Market Volume (Billion), by Appli 2024 & 2032
- Figure 25: South America GCC OOH and DOOH Market Revenue Share (%), by Appli 2024 & 2032
- Figure 26: South America GCC OOH and DOOH Market Volume Share (%), by Appli 2024 & 2032
- Figure 27: South America GCC OOH and DOOH Market Revenue (Million), by End-U 2024 & 2032
- Figure 28: South America GCC OOH and DOOH Market Volume (Billion), by End-U 2024 & 2032
- Figure 29: South America GCC OOH and DOOH Market Revenue Share (%), by End-U 2024 & 2032
- Figure 30: South America GCC OOH and DOOH Market Volume Share (%), by End-U 2024 & 2032
- Figure 31: South America GCC OOH and DOOH Market Revenue (Million), by Country 2024 & 2032
- Figure 32: South America GCC OOH and DOOH Market Volume (Billion), by Country 2024 & 2032
- Figure 33: South America GCC OOH and DOOH Market Revenue Share (%), by Country 2024 & 2032
- Figure 34: South America GCC OOH and DOOH Market Volume Share (%), by Country 2024 & 2032
- Figure 35: Europe GCC OOH and DOOH Market Revenue (Million), by Type 2024 & 2032
- Figure 36: Europe GCC OOH and DOOH Market Volume (Billion), by Type 2024 & 2032
- Figure 37: Europe GCC OOH and DOOH Market Revenue Share (%), by Type 2024 & 2032
- Figure 38: Europe GCC OOH and DOOH Market Volume Share (%), by Type 2024 & 2032
- Figure 39: Europe GCC OOH and DOOH Market Revenue (Million), by Appli 2024 & 2032
- Figure 40: Europe GCC OOH and DOOH Market Volume (Billion), by Appli 2024 & 2032
- Figure 41: Europe GCC OOH and DOOH Market Revenue Share (%), by Appli 2024 & 2032
- Figure 42: Europe GCC OOH and DOOH Market Volume Share (%), by Appli 2024 & 2032
- Figure 43: Europe GCC OOH and DOOH Market Revenue (Million), by End-U 2024 & 2032
- Figure 44: Europe GCC OOH and DOOH Market Volume (Billion), by End-U 2024 & 2032
- Figure 45: Europe GCC OOH and DOOH Market Revenue Share (%), by End-U 2024 & 2032
- Figure 46: Europe GCC OOH and DOOH Market Volume Share (%), by End-U 2024 & 2032
- Figure 47: Europe GCC OOH and DOOH Market Revenue (Million), by Country 2024 & 2032
- Figure 48: Europe GCC OOH and DOOH Market Volume (Billion), by Country 2024 & 2032
- Figure 49: Europe GCC OOH and DOOH Market Revenue Share (%), by Country 2024 & 2032
- Figure 50: Europe GCC OOH and DOOH Market Volume Share (%), by Country 2024 & 2032
- Figure 51: Middle East & Africa GCC OOH and DOOH Market Revenue (Million), by Type 2024 & 2032
- Figure 52: Middle East & Africa GCC OOH and DOOH Market Volume (Billion), by Type 2024 & 2032
- Figure 53: Middle East & Africa GCC OOH and DOOH Market Revenue Share (%), by Type 2024 & 2032
- Figure 54: Middle East & Africa GCC OOH and DOOH Market Volume Share (%), by Type 2024 & 2032
- Figure 55: Middle East & Africa GCC OOH and DOOH Market Revenue (Million), by Appli 2024 & 2032
- Figure 56: Middle East & Africa GCC OOH and DOOH Market Volume (Billion), by Appli 2024 & 2032
- Figure 57: Middle East & Africa GCC OOH and DOOH Market Revenue Share (%), by Appli 2024 & 2032
- Figure 58: Middle East & Africa GCC OOH and DOOH Market Volume Share (%), by Appli 2024 & 2032
- Figure 59: Middle East & Africa GCC OOH and DOOH Market Revenue (Million), by End-U 2024 & 2032
- Figure 60: Middle East & Africa GCC OOH and DOOH Market Volume (Billion), by End-U 2024 & 2032
- Figure 61: Middle East & Africa GCC OOH and DOOH Market Revenue Share (%), by End-U 2024 & 2032
- Figure 62: Middle East & Africa GCC OOH and DOOH Market Volume Share (%), by End-U 2024 & 2032
- Figure 63: Middle East & Africa GCC OOH and DOOH Market Revenue (Million), by Country 2024 & 2032
- Figure 64: Middle East & Africa GCC OOH and DOOH Market Volume (Billion), by Country 2024 & 2032
- Figure 65: Middle East & Africa GCC OOH and DOOH Market Revenue Share (%), by Country 2024 & 2032
- Figure 66: Middle East & Africa GCC OOH and DOOH Market Volume Share (%), by Country 2024 & 2032
- Figure 67: Asia Pacific GCC OOH and DOOH Market Revenue (Million), by Type 2024 & 2032
- Figure 68: Asia Pacific GCC OOH and DOOH Market Volume (Billion), by Type 2024 & 2032
- Figure 69: Asia Pacific GCC OOH and DOOH Market Revenue Share (%), by Type 2024 & 2032
- Figure 70: Asia Pacific GCC OOH and DOOH Market Volume Share (%), by Type 2024 & 2032
- Figure 71: Asia Pacific GCC OOH and DOOH Market Revenue (Million), by Appli 2024 & 2032
- Figure 72: Asia Pacific GCC OOH and DOOH Market Volume (Billion), by Appli 2024 & 2032
- Figure 73: Asia Pacific GCC OOH and DOOH Market Revenue Share (%), by Appli 2024 & 2032
- Figure 74: Asia Pacific GCC OOH and DOOH Market Volume Share (%), by Appli 2024 & 2032
- Figure 75: Asia Pacific GCC OOH and DOOH Market Revenue (Million), by End-U 2024 & 2032
- Figure 76: Asia Pacific GCC OOH and DOOH Market Volume (Billion), by End-U 2024 & 2032
- Figure 77: Asia Pacific GCC OOH and DOOH Market Revenue Share (%), by End-U 2024 & 2032
- Figure 78: Asia Pacific GCC OOH and DOOH Market Volume Share (%), by End-U 2024 & 2032
- Figure 79: Asia Pacific GCC OOH and DOOH Market Revenue (Million), by Country 2024 & 2032
- Figure 80: Asia Pacific GCC OOH and DOOH Market Volume (Billion), by Country 2024 & 2032
- Figure 81: Asia Pacific GCC OOH and DOOH Market Revenue Share (%), by Country 2024 & 2032
- Figure 82: Asia Pacific GCC OOH and DOOH Market Volume Share (%), by Country 2024 & 2032
List of Tables
- Table 1: Global GCC OOH and DOOH Market Revenue Million Forecast, by Region 2019 & 2032
- Table 2: Global GCC OOH and DOOH Market Volume Billion Forecast, by Region 2019 & 2032
- Table 3: Global GCC OOH and DOOH Market Revenue Million Forecast, by Type 2019 & 2032
- Table 4: Global GCC OOH and DOOH Market Volume Billion Forecast, by Type 2019 & 2032
- Table 5: Global GCC OOH and DOOH Market Revenue Million Forecast, by Appli 2019 & 2032
- Table 6: Global GCC OOH and DOOH Market Volume Billion Forecast, by Appli 2019 & 2032
- Table 7: Global GCC OOH and DOOH Market Revenue Million Forecast, by End-U 2019 & 2032
- Table 8: Global GCC OOH and DOOH Market Volume Billion Forecast, by End-U 2019 & 2032
- Table 9: Global GCC OOH and DOOH Market Revenue Million Forecast, by Region 2019 & 2032
- Table 10: Global GCC OOH and DOOH Market Volume Billion Forecast, by Region 2019 & 2032
- Table 11: Global GCC OOH and DOOH Market Revenue Million Forecast, by Type 2019 & 2032
- Table 12: Global GCC OOH and DOOH Market Volume Billion Forecast, by Type 2019 & 2032
- Table 13: Global GCC OOH and DOOH Market Revenue Million Forecast, by Appli 2019 & 2032
- Table 14: Global GCC OOH and DOOH Market Volume Billion Forecast, by Appli 2019 & 2032
- Table 15: Global GCC OOH and DOOH Market Revenue Million Forecast, by End-U 2019 & 2032
- Table 16: Global GCC OOH and DOOH Market Volume Billion Forecast, by End-U 2019 & 2032
- Table 17: Global GCC OOH and DOOH Market Revenue Million Forecast, by Country 2019 & 2032
- Table 18: Global GCC OOH and DOOH Market Volume Billion Forecast, by Country 2019 & 2032
- Table 19: United States GCC OOH and DOOH Market Revenue (Million) Forecast, by Application 2019 & 2032
- Table 20: United States GCC OOH and DOOH Market Volume (Billion) Forecast, by Application 2019 & 2032
- Table 21: Canada GCC OOH and DOOH Market Revenue (Million) Forecast, by Application 2019 & 2032
- Table 22: Canada GCC OOH and DOOH Market Volume (Billion) Forecast, by Application 2019 & 2032
- Table 23: Mexico GCC OOH and DOOH Market Revenue (Million) Forecast, by Application 2019 & 2032
- Table 24: Mexico GCC OOH and DOOH Market Volume (Billion) Forecast, by Application 2019 & 2032
- Table 25: Global GCC OOH and DOOH Market Revenue Million Forecast, by Type 2019 & 2032
- Table 26: Global GCC OOH and DOOH Market Volume Billion Forecast, by Type 2019 & 2032
- Table 27: Global GCC OOH and DOOH Market Revenue Million Forecast, by Appli 2019 & 2032
- Table 28: Global GCC OOH and DOOH Market Volume Billion Forecast, by Appli 2019 & 2032
- Table 29: Global GCC OOH and DOOH Market Revenue Million Forecast, by End-U 2019 & 2032
- Table 30: Global GCC OOH and DOOH Market Volume Billion Forecast, by End-U 2019 & 2032
- Table 31: Global GCC OOH and DOOH Market Revenue Million Forecast, by Country 2019 & 2032
- Table 32: Global GCC OOH and DOOH Market Volume Billion Forecast, by Country 2019 & 2032
- Table 33: Brazil GCC OOH and DOOH Market Revenue (Million) Forecast, by Application 2019 & 2032
- Table 34: Brazil GCC OOH and DOOH Market Volume (Billion) Forecast, by Application 2019 & 2032
- Table 35: Argentina GCC OOH and DOOH Market Revenue (Million) Forecast, by Application 2019 & 2032
- Table 36: Argentina GCC OOH and DOOH Market Volume (Billion) Forecast, by Application 2019 & 2032
- Table 37: Rest of South America GCC OOH and DOOH Market Revenue (Million) Forecast, by Application 2019 & 2032
- Table 38: Rest of South America GCC OOH and DOOH Market Volume (Billion) Forecast, by Application 2019 & 2032
- Table 39: Global GCC OOH and DOOH Market Revenue Million Forecast, by Type 2019 & 2032
- Table 40: Global GCC OOH and DOOH Market Volume Billion Forecast, by Type 2019 & 2032
- Table 41: Global GCC OOH and DOOH Market Revenue Million Forecast, by Appli 2019 & 2032
- Table 42: Global GCC OOH and DOOH Market Volume Billion Forecast, by Appli 2019 & 2032
- Table 43: Global GCC OOH and DOOH Market Revenue Million Forecast, by End-U 2019 & 2032
- Table 44: Global GCC OOH and DOOH Market Volume Billion Forecast, by End-U 2019 & 2032
- Table 45: Global GCC OOH and DOOH Market Revenue Million Forecast, by Country 2019 & 2032
- Table 46: Global GCC OOH and DOOH Market Volume Billion Forecast, by Country 2019 & 2032
- Table 47: United Kingdom GCC OOH and DOOH Market Revenue (Million) Forecast, by Application 2019 & 2032
- Table 48: United Kingdom GCC OOH and DOOH Market Volume (Billion) Forecast, by Application 2019 & 2032
- Table 49: Germany GCC OOH and DOOH Market Revenue (Million) Forecast, by Application 2019 & 2032
- Table 50: Germany GCC OOH and DOOH Market Volume (Billion) Forecast, by Application 2019 & 2032
- Table 51: France GCC OOH and DOOH Market Revenue (Million) Forecast, by Application 2019 & 2032
- Table 52: France GCC OOH and DOOH Market Volume (Billion) Forecast, by Application 2019 & 2032
- Table 53: Italy GCC OOH and DOOH Market Revenue (Million) Forecast, by Application 2019 & 2032
- Table 54: Italy GCC OOH and DOOH Market Volume (Billion) Forecast, by Application 2019 & 2032
- Table 55: Spain GCC OOH and DOOH Market Revenue (Million) Forecast, by Application 2019 & 2032
- Table 56: Spain GCC OOH and DOOH Market Volume (Billion) Forecast, by Application 2019 & 2032
- Table 57: Russia GCC OOH and DOOH Market Revenue (Million) Forecast, by Application 2019 & 2032
- Table 58: Russia GCC OOH and DOOH Market Volume (Billion) Forecast, by Application 2019 & 2032
- Table 59: Benelux GCC OOH and DOOH Market Revenue (Million) Forecast, by Application 2019 & 2032
- Table 60: Benelux GCC OOH and DOOH Market Volume (Billion) Forecast, by Application 2019 & 2032
- Table 61: Nordics GCC OOH and DOOH Market Revenue (Million) Forecast, by Application 2019 & 2032
- Table 62: Nordics GCC OOH and DOOH Market Volume (Billion) Forecast, by Application 2019 & 2032
- Table 63: Rest of Europe GCC OOH and DOOH Market Revenue (Million) Forecast, by Application 2019 & 2032
- Table 64: Rest of Europe GCC OOH and DOOH Market Volume (Billion) Forecast, by Application 2019 & 2032
- Table 65: Global GCC OOH and DOOH Market Revenue Million Forecast, by Type 2019 & 2032
- Table 66: Global GCC OOH and DOOH Market Volume Billion Forecast, by Type 2019 & 2032
- Table 67: Global GCC OOH and DOOH Market Revenue Million Forecast, by Appli 2019 & 2032
- Table 68: Global GCC OOH and DOOH Market Volume Billion Forecast, by Appli 2019 & 2032
- Table 69: Global GCC OOH and DOOH Market Revenue Million Forecast, by End-U 2019 & 2032
- Table 70: Global GCC OOH and DOOH Market Volume Billion Forecast, by End-U 2019 & 2032
- Table 71: Global GCC OOH and DOOH Market Revenue Million Forecast, by Country 2019 & 2032
- Table 72: Global GCC OOH and DOOH Market Volume Billion Forecast, by Country 2019 & 2032
- Table 73: Turkey GCC OOH and DOOH Market Revenue (Million) Forecast, by Application 2019 & 2032
- Table 74: Turkey GCC OOH and DOOH Market Volume (Billion) Forecast, by Application 2019 & 2032
- Table 75: Israel GCC OOH and DOOH Market Revenue (Million) Forecast, by Application 2019 & 2032
- Table 76: Israel GCC OOH and DOOH Market Volume (Billion) Forecast, by Application 2019 & 2032
- Table 77: GCC GCC OOH and DOOH Market Revenue (Million) Forecast, by Application 2019 & 2032
- Table 78: GCC GCC OOH and DOOH Market Volume (Billion) Forecast, by Application 2019 & 2032
- Table 79: North Africa GCC OOH and DOOH Market Revenue (Million) Forecast, by Application 2019 & 2032
- Table 80: North Africa GCC OOH and DOOH Market Volume (Billion) Forecast, by Application 2019 & 2032
- Table 81: South Africa GCC OOH and DOOH Market Revenue (Million) Forecast, by Application 2019 & 2032
- Table 82: South Africa GCC OOH and DOOH Market Volume (Billion) Forecast, by Application 2019 & 2032
- Table 83: Rest of Middle East & Africa GCC OOH and DOOH Market Revenue (Million) Forecast, by Application 2019 & 2032
- Table 84: Rest of Middle East & Africa GCC OOH and DOOH Market Volume (Billion) Forecast, by Application 2019 & 2032
- Table 85: Global GCC OOH and DOOH Market Revenue Million Forecast, by Type 2019 & 2032
- Table 86: Global GCC OOH and DOOH Market Volume Billion Forecast, by Type 2019 & 2032
- Table 87: Global GCC OOH and DOOH Market Revenue Million Forecast, by Appli 2019 & 2032
- Table 88: Global GCC OOH and DOOH Market Volume Billion Forecast, by Appli 2019 & 2032
- Table 89: Global GCC OOH and DOOH Market Revenue Million Forecast, by End-U 2019 & 2032
- Table 90: Global GCC OOH and DOOH Market Volume Billion Forecast, by End-U 2019 & 2032
- Table 91: Global GCC OOH and DOOH Market Revenue Million Forecast, by Country 2019 & 2032
- Table 92: Global GCC OOH and DOOH Market Volume Billion Forecast, by Country 2019 & 2032
- Table 93: China GCC OOH and DOOH Market Revenue (Million) Forecast, by Application 2019 & 2032
- Table 94: China GCC OOH and DOOH Market Volume (Billion) Forecast, by Application 2019 & 2032
- Table 95: India GCC OOH and DOOH Market Revenue (Million) Forecast, by Application 2019 & 2032
- Table 96: India GCC OOH and DOOH Market Volume (Billion) Forecast, by Application 2019 & 2032
- Table 97: Japan GCC OOH and DOOH Market Revenue (Million) Forecast, by Application 2019 & 2032
- Table 98: Japan GCC OOH and DOOH Market Volume (Billion) Forecast, by Application 2019 & 2032
- Table 99: South Korea GCC OOH and DOOH Market Revenue (Million) Forecast, by Application 2019 & 2032
- Table 100: South Korea GCC OOH and DOOH Market Volume (Billion) Forecast, by Application 2019 & 2032
- Table 101: ASEAN GCC OOH and DOOH Market Revenue (Million) Forecast, by Application 2019 & 2032
- Table 102: ASEAN GCC OOH and DOOH Market Volume (Billion) Forecast, by Application 2019 & 2032
- Table 103: Oceania GCC OOH and DOOH Market Revenue (Million) Forecast, by Application 2019 & 2032
- Table 104: Oceania GCC OOH and DOOH Market Volume (Billion) Forecast, by Application 2019 & 2032
- Table 105: Rest of Asia Pacific GCC OOH and DOOH Market Revenue (Million) Forecast, by Application 2019 & 2032
- Table 106: Rest of Asia Pacific GCC OOH and DOOH Market Volume (Billion) Forecast, by Application 2019 & 2032
Frequently Asked Questions
1. What is the projected Compound Annual Growth Rate (CAGR) of the GCC OOH and DOOH Market?
The projected CAGR is approximately 12.72%.
2. Which companies are prominent players in the GCC OOH and DOOH Market?
Key companies in the market include Al Arabiya, JCDecaux SE, ELAN Group, Emirates Neon Group, Hills Advertising L L C, Dooha Media, BackLite Media LLC, Daktronics Inc, Hypermedia FZ-LLC, Abu Dhabi Media Networ.
3. What are the main segments of the GCC OOH and DOOH Market?
The market segments include Type , Appli, End-U.
4. Can you provide details about the market size?
The market size is estimated to be USD 0.97 Million as of 2022.
5. What are some drivers contributing to market growth?
Ongoing Shift Towards Digital Advertising; Increasing Use of Recommendation Engines.
6. What are the notable trends driving market growth?
Ongoing Shift toward Digital Advertising is expected to boost the Market Growth.
7. Are there any restraints impacting market growth?
Ongoing Shift Towards Digital Advertising; Increasing Use of Recommendation Engines.
8. Can you provide examples of recent developments in the market?
May 2024: ELAN Media, an advertising entity in Qatar, launched plans for its Digital Out-of-Home (DOOH) screens. The screens are set to debut at specific WOQOD petrol stations across Qatar, marking a collaboration between ELAN Media and Qatar Fuel (WOQOD). Under a decade-long pact, ELAN Media was expected to lead the development and exclusive operation of DOOH screens at five key WOQOD petrol stations, strategically positioned at Wholesale Market, New Musherib, Wadi Al Banat, Al Hilal, and Old Slata.
9. What pricing options are available for accessing the report?
Pricing options include single-user, multi-user, and enterprise licenses priced at USD 3800, USD 4500, and USD 5800 respectively.
10. Is the market size provided in terms of value or volume?
The market size is provided in terms of value, measured in Million and volume, measured in Billion.
11. Are there any specific market keywords associated with the report?
Yes, the market keyword associated with the report is "GCC OOH and DOOH Market," which aids in identifying and referencing the specific market segment covered.
12. How do I determine which pricing option suits my needs best?
The pricing options vary based on user requirements and access needs. Individual users may opt for single-user licenses, while businesses requiring broader access may choose multi-user or enterprise licenses for cost-effective access to the report.
13. Are there any additional resources or data provided in the GCC OOH and DOOH Market report?
While the report offers comprehensive insights, it's advisable to review the specific contents or supplementary materials provided to ascertain if additional resources or data are available.
14. How can I stay updated on further developments or reports in the GCC OOH and DOOH Market?
To stay informed about further developments, trends, and reports in the GCC OOH and DOOH Market, consider subscribing to industry newsletters, following relevant companies and organizations, or regularly checking reputable industry news sources and publications.
Methodology
Step 1 - Identification of Relevant Samples Size from Population Database


Step 2 - Approaches for Defining Global Market Size (Value, Volume* & Price*)

Note*: In applicable scenarios
Step 3 - Data Sources
Primary Research
- Web Analytics
- Survey Reports
- Research Institute
- Latest Research Reports
- Opinion Leaders
Secondary Research
- Annual Reports
- White Paper
- Latest Press Release
- Industry Association
- Paid Database
- Investor Presentations

Step 4 - Data Triangulation
Involves using different sources of information in order to increase the validity of a study
These sources are likely to be stakeholders in a program - participants, other researchers, program staff, other community members, and so on.
Then we put all data in single framework & apply various statistical tools to find out the dynamic on the market.
During the analysis stage, feedback from the stakeholder groups would be compared to determine areas of agreement as well as areas of divergence


