
Key Insights
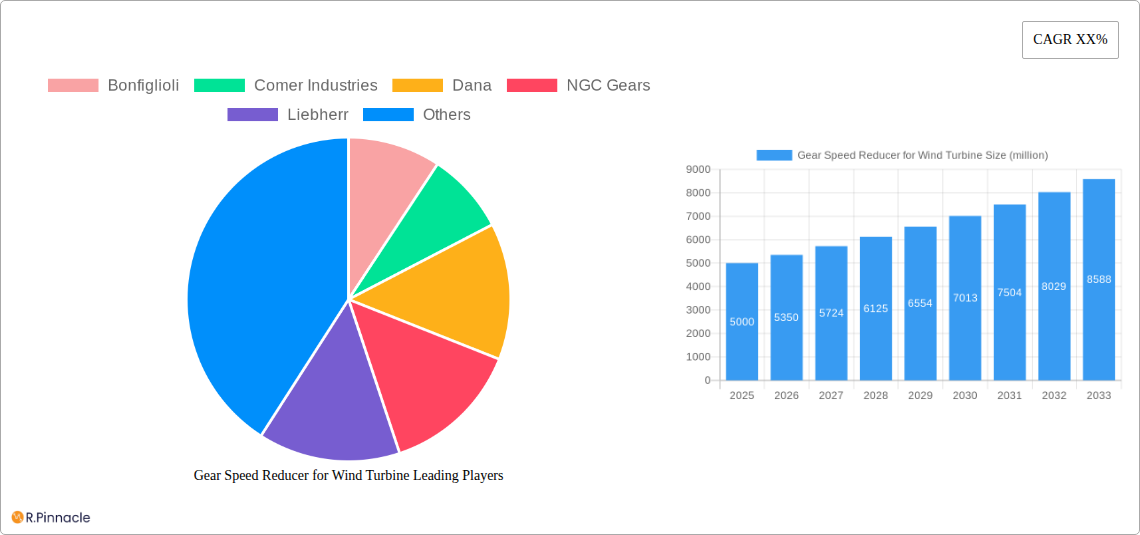
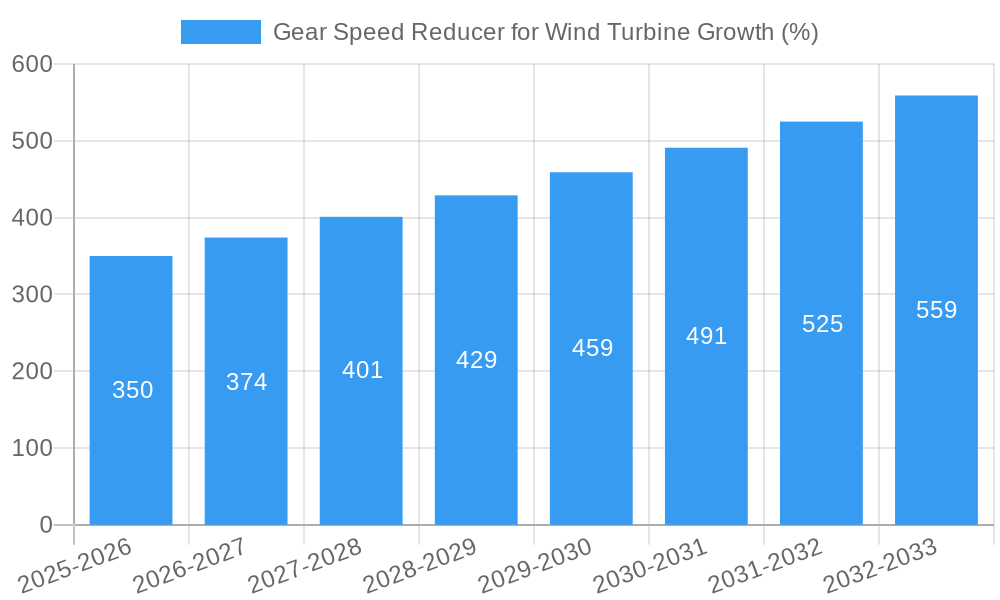
The global market for gear speed reducers in wind turbines is experiencing robust growth, driven by the increasing demand for renewable energy and the expansion of wind power capacity worldwide. The market, estimated at $5 billion in 2025, is projected to exhibit a healthy Compound Annual Growth Rate (CAGR) of 7% from 2025 to 2033, reaching approximately $8.5 billion by 2033. This expansion is fueled by several key factors. Firstly, the global shift towards cleaner energy sources is significantly boosting investment in wind energy projects, leading to a higher demand for efficient and reliable speed reducers. Secondly, technological advancements in gear design, materials, and manufacturing processes are enhancing the performance and lifespan of these components, making them more cost-effective in the long run. Furthermore, the growing adoption of larger wind turbine designs, particularly offshore wind farms, necessitates the use of more powerful and robust speed reducers, further driving market growth. Key players such as Bonfiglioli, Comer Industries, Dana, and others are actively investing in research and development to improve their product offerings and consolidate their market positions.
Despite the positive outlook, the market faces certain challenges. Fluctuations in raw material prices, particularly steel and other metals, can impact production costs and profitability. Additionally, the intense competition among established players and emerging manufacturers necessitates continuous innovation and cost optimization. Stringent regulatory standards and environmental concerns related to manufacturing and disposal also pose constraints. However, the long-term growth prospects remain strong, owing to supportive government policies, increasing investments in renewable energy infrastructure, and a growing awareness of the need to combat climate change. The market is segmented based on type, capacity, and geography, with North America and Europe currently holding significant market shares, although the Asia-Pacific region is poised for substantial growth in the coming years due to rising wind energy adoption.
Gear Speed Reducer for Wind Turbine Market Report: 2019-2033
This comprehensive report provides an in-depth analysis of the global gear speed reducer for wind turbine market, offering invaluable insights for industry professionals, investors, and strategic decision-makers. Covering the period from 2019 to 2033, with a base year of 2025 and a forecast period of 2025-2033, this report unveils the market's structure, dynamics, and future potential. The global market size exceeded $XX million in 2024 and is projected to reach $XX million by 2033, exhibiting a CAGR of XX% during the forecast period.
Gear Speed Reducer for Wind Turbine Market Structure & Innovation Trends
This section analyzes the competitive landscape, highlighting market concentration, key innovation drivers, and regulatory influences shaping the gear speed reducer for wind turbine market. The report examines the role of mergers and acquisitions (M&A) activity, evaluating deal values and their impact on market share distribution.
- Market Concentration: The market exhibits a moderately concentrated structure, with the top five players—Bonfiglioli, Comer Industries, Dana, NGC Gears, and Liebherr—holding a combined market share of approximately XX%.
- Innovation Drivers: Technological advancements in gear materials, design optimization for higher efficiency and load capacity, and the integration of smart technologies are major innovation drivers.
- Regulatory Frameworks: Government policies promoting renewable energy, along with stringent environmental regulations, are significantly influencing market growth.
- Product Substitutes: While gear speed reducers remain dominant, the emergence of alternative technologies, such as direct-drive systems, poses a potential competitive threat. However, their higher costs currently limit widespread adoption.
- End-User Demographics: The primary end-users are wind turbine Original Equipment Manufacturers (OEMs), with a growing focus on offshore wind projects driving demand for robust and reliable gear speed reducers.
- M&A Activities: The past five years have witnessed several significant M&A deals, with a total estimated value exceeding $XX million, reflecting the industry's consolidation trends. These deals have primarily focused on enhancing technological capabilities and expanding geographic reach.
Gear Speed Reducer for Wind Turbine Market Dynamics & Trends
This section delves into the key market dynamics influencing growth, including technological disruptions, consumer preferences, and competitive dynamics. We analyze the factors driving market expansion and the challenges faced by market participants.
The global gear speed reducer market is driven by several factors, such as the increasing demand for renewable energy, government incentives for wind energy projects, technological advancements leading to improved efficiency and reliability of wind turbines and a growing trend towards larger wind turbine capacities. However, the market also faces challenges such as intense competition, high raw material costs, and the fluctuating price of electricity. The market penetration of gear speed reducers in the wind energy sector continues to increase, projected to reach XX% by 2033.
Dominant Regions & Segments in Gear Speed Reducer for Wind Turbine
This section identifies the leading regions and segments driving market growth.
Dominant Region: Europe
- Key Drivers: Strong government support for renewable energy, well-established wind energy infrastructure, and a high concentration of wind turbine manufacturers.
- Dominance Analysis: Europe's mature wind energy market, coupled with stringent environmental regulations and the ongoing expansion of offshore wind farms, positions it as the leading region for gear speed reducer adoption. Significant investments in R&D and a robust supply chain network further contribute to its dominance.
Gear Speed Reducer for Wind Turbine Product Innovations
Recent innovations focus on enhancing efficiency, durability, and reducing noise levels. Advanced materials like high-strength steels and composites are being incorporated to improve performance under demanding conditions. The integration of condition monitoring systems allows for predictive maintenance, reducing downtime and optimizing operational costs. These innovations enhance market fit by addressing the key concerns of wind turbine operators and improving overall system reliability.
Report Scope & Segmentation Analysis
This report segments the market by wind turbine type (onshore and offshore), capacity (MW), gear type (planetary, helical, etc.), and region (North America, Europe, Asia Pacific, etc). Each segment's market size, growth projection, and competitive landscape are thoroughly analyzed, providing a comprehensive understanding of the market's structure and dynamics.
Key Drivers of Gear Speed Reducer for Wind Turbine Growth
The growth of the gear speed reducer for wind turbine market is driven by several factors: increasing demand for renewable energy globally; supportive government policies and subsidies aimed at promoting renewable energy adoption; technological advancements leading to more efficient and reliable gear speed reducers. The rise of offshore wind farms, requiring more robust and durable gearboxes, further contributes to market expansion.
Challenges in the Gear Speed Reducer for Wind Turbine Sector
The sector faces challenges including intense competition among manufacturers, high raw material costs, fluctuations in demand and supply chains and complex manufacturing processes. These factors can impact profitability and lead to price fluctuations in the market.
Emerging Opportunities in Gear Speed Reducer for Wind Turbine
Emerging opportunities lie in the increasing demand for high-capacity wind turbines, the expansion of offshore wind farms, and technological advancements toward improving the efficiency and reliability of wind energy systems. The development of advanced materials and smart technologies creates opportunities for gear speed reducer manufacturers to develop next-generation products.
Leading Players in the Gear Speed Reducer for Wind Turbine Market
- Bonfiglioli
- Comer Industries
- Dana
- NGC Gears
- Liebherr
- Chongqing Gearbox
- Yinchuan Weili Transmission
- Nabtesco
- Bosch-Rexroth
- Enercon
- DHHI
Key Developments in Gear Speed Reducer for Wind Turbine Industry
- 2023: Bonfiglioli launched a new line of high-efficiency gearboxes for offshore wind turbines.
- 2022: Comer Industries acquired a smaller gear manufacturer, expanding its market share.
- 2021: Significant investments were made in R&D for advanced gear materials and designs.
Future Outlook for Gear Speed Reducer for Wind Turbine Market
The market is poised for continued growth, driven by the global shift toward renewable energy and the increasing demand for efficient and reliable wind power generation. The development of larger, more efficient wind turbines and the expansion of offshore wind projects will create significant opportunities for gear speed reducer manufacturers. Technological advancements, such as the integration of smart sensors and predictive maintenance capabilities, will further shape the market's trajectory.
Gear Speed Reducer for Wind Turbine Segmentation
-
1. Application
- 1.1. Onshore
- 1.2. Offshore
-
2. Types
- 2.1. Pitch Reducer
- 2.2. Yaw Reducer
Gear Speed Reducer for Wind Turbine Segmentation By Geography
-
1. North America
- 1.1. United States
- 1.2. Canada
- 1.3. Mexico
-
2. South America
- 2.1. Brazil
- 2.2. Argentina
- 2.3. Rest of South America
-
3. Europe
- 3.1. United Kingdom
- 3.2. Germany
- 3.3. France
- 3.4. Italy
- 3.5. Spain
- 3.6. Russia
- 3.7. Benelux
- 3.8. Nordics
- 3.9. Rest of Europe
-
4. Middle East & Africa
- 4.1. Turkey
- 4.2. Israel
- 4.3. GCC
- 4.4. North Africa
- 4.5. South Africa
- 4.6. Rest of Middle East & Africa
-
5. Asia Pacific
- 5.1. China
- 5.2. India
- 5.3. Japan
- 5.4. South Korea
- 5.5. ASEAN
- 5.6. Oceania
- 5.7. Rest of Asia Pacific

Gear Speed Reducer for Wind Turbine REPORT HIGHLIGHTS
| Aspects | Details |
|---|---|
| Study Period | 2019-2033 |
| Base Year | 2024 |
| Estimated Year | 2025 |
| Forecast Period | 2025-2033 |
| Historical Period | 2019-2024 |
| Growth Rate | CAGR of XX% from 2019-2033 |
| Segmentation |
|
Table of Contents
- 1. Introduction
- 1.1. Research Scope
- 1.2. Market Segmentation
- 1.3. Research Methodology
- 1.4. Definitions and Assumptions
- 2. Executive Summary
- 2.1. Introduction
- 3. Market Dynamics
- 3.1. Introduction
- 3.2. Market Drivers
- 3.3. Market Restrains
- 3.4. Market Trends
- 4. Market Factor Analysis
- 4.1. Porters Five Forces
- 4.2. Supply/Value Chain
- 4.3. PESTEL analysis
- 4.4. Market Entropy
- 4.5. Patent/Trademark Analysis
- 5. Global Gear Speed Reducer for Wind Turbine Analysis, Insights and Forecast, 2019-2031
- 5.1. Market Analysis, Insights and Forecast - by Application
- 5.1.1. Onshore
- 5.1.2. Offshore
- 5.2. Market Analysis, Insights and Forecast - by Types
- 5.2.1. Pitch Reducer
- 5.2.2. Yaw Reducer
- 5.3. Market Analysis, Insights and Forecast - by Region
- 5.3.1. North America
- 5.3.2. South America
- 5.3.3. Europe
- 5.3.4. Middle East & Africa
- 5.3.5. Asia Pacific
- 5.1. Market Analysis, Insights and Forecast - by Application
- 6. North America Gear Speed Reducer for Wind Turbine Analysis, Insights and Forecast, 2019-2031
- 6.1. Market Analysis, Insights and Forecast - by Application
- 6.1.1. Onshore
- 6.1.2. Offshore
- 6.2. Market Analysis, Insights and Forecast - by Types
- 6.2.1. Pitch Reducer
- 6.2.2. Yaw Reducer
- 6.1. Market Analysis, Insights and Forecast - by Application
- 7. South America Gear Speed Reducer for Wind Turbine Analysis, Insights and Forecast, 2019-2031
- 7.1. Market Analysis, Insights and Forecast - by Application
- 7.1.1. Onshore
- 7.1.2. Offshore
- 7.2. Market Analysis, Insights and Forecast - by Types
- 7.2.1. Pitch Reducer
- 7.2.2. Yaw Reducer
- 7.1. Market Analysis, Insights and Forecast - by Application
- 8. Europe Gear Speed Reducer for Wind Turbine Analysis, Insights and Forecast, 2019-2031
- 8.1. Market Analysis, Insights and Forecast - by Application
- 8.1.1. Onshore
- 8.1.2. Offshore
- 8.2. Market Analysis, Insights and Forecast - by Types
- 8.2.1. Pitch Reducer
- 8.2.2. Yaw Reducer
- 8.1. Market Analysis, Insights and Forecast - by Application
- 9. Middle East & Africa Gear Speed Reducer for Wind Turbine Analysis, Insights and Forecast, 2019-2031
- 9.1. Market Analysis, Insights and Forecast - by Application
- 9.1.1. Onshore
- 9.1.2. Offshore
- 9.2. Market Analysis, Insights and Forecast - by Types
- 9.2.1. Pitch Reducer
- 9.2.2. Yaw Reducer
- 9.1. Market Analysis, Insights and Forecast - by Application
- 10. Asia Pacific Gear Speed Reducer for Wind Turbine Analysis, Insights and Forecast, 2019-2031
- 10.1. Market Analysis, Insights and Forecast - by Application
- 10.1.1. Onshore
- 10.1.2. Offshore
- 10.2. Market Analysis, Insights and Forecast - by Types
- 10.2.1. Pitch Reducer
- 10.2.2. Yaw Reducer
- 10.1. Market Analysis, Insights and Forecast - by Application
- 11. Competitive Analysis
- 11.1. Global Market Share Analysis 2024
- 11.2. Company Profiles
- 11.2.1 Bonfiglioli
- 11.2.1.1. Overview
- 11.2.1.2. Products
- 11.2.1.3. SWOT Analysis
- 11.2.1.4. Recent Developments
- 11.2.1.5. Financials (Based on Availability)
- 11.2.2 Comer Industries
- 11.2.2.1. Overview
- 11.2.2.2. Products
- 11.2.2.3. SWOT Analysis
- 11.2.2.4. Recent Developments
- 11.2.2.5. Financials (Based on Availability)
- 11.2.3 Dana
- 11.2.3.1. Overview
- 11.2.3.2. Products
- 11.2.3.3. SWOT Analysis
- 11.2.3.4. Recent Developments
- 11.2.3.5. Financials (Based on Availability)
- 11.2.4 NGC Gears
- 11.2.4.1. Overview
- 11.2.4.2. Products
- 11.2.4.3. SWOT Analysis
- 11.2.4.4. Recent Developments
- 11.2.4.5. Financials (Based on Availability)
- 11.2.5 Liebherr
- 11.2.5.1. Overview
- 11.2.5.2. Products
- 11.2.5.3. SWOT Analysis
- 11.2.5.4. Recent Developments
- 11.2.5.5. Financials (Based on Availability)
- 11.2.6 Chongqing Gearbox
- 11.2.6.1. Overview
- 11.2.6.2. Products
- 11.2.6.3. SWOT Analysis
- 11.2.6.4. Recent Developments
- 11.2.6.5. Financials (Based on Availability)
- 11.2.7 Yinchuan Weili Transmission
- 11.2.7.1. Overview
- 11.2.7.2. Products
- 11.2.7.3. SWOT Analysis
- 11.2.7.4. Recent Developments
- 11.2.7.5. Financials (Based on Availability)
- 11.2.8 Nabtesco
- 11.2.8.1. Overview
- 11.2.8.2. Products
- 11.2.8.3. SWOT Analysis
- 11.2.8.4. Recent Developments
- 11.2.8.5. Financials (Based on Availability)
- 11.2.9 Bosch-Rexroth
- 11.2.9.1. Overview
- 11.2.9.2. Products
- 11.2.9.3. SWOT Analysis
- 11.2.9.4. Recent Developments
- 11.2.9.5. Financials (Based on Availability)
- 11.2.10 Enercon
- 11.2.10.1. Overview
- 11.2.10.2. Products
- 11.2.10.3. SWOT Analysis
- 11.2.10.4. Recent Developments
- 11.2.10.5. Financials (Based on Availability)
- 11.2.11 DHHI
- 11.2.11.1. Overview
- 11.2.11.2. Products
- 11.2.11.3. SWOT Analysis
- 11.2.11.4. Recent Developments
- 11.2.11.5. Financials (Based on Availability)
- 11.2.1 Bonfiglioli
List of Figures
- Figure 1: Global Gear Speed Reducer for Wind Turbine Revenue Breakdown (million, %) by Region 2024 & 2032
- Figure 2: Global Gear Speed Reducer for Wind Turbine Volume Breakdown (K, %) by Region 2024 & 2032
- Figure 3: North America Gear Speed Reducer for Wind Turbine Revenue (million), by Application 2024 & 2032
- Figure 4: North America Gear Speed Reducer for Wind Turbine Volume (K), by Application 2024 & 2032
- Figure 5: North America Gear Speed Reducer for Wind Turbine Revenue Share (%), by Application 2024 & 2032
- Figure 6: North America Gear Speed Reducer for Wind Turbine Volume Share (%), by Application 2024 & 2032
- Figure 7: North America Gear Speed Reducer for Wind Turbine Revenue (million), by Types 2024 & 2032
- Figure 8: North America Gear Speed Reducer for Wind Turbine Volume (K), by Types 2024 & 2032
- Figure 9: North America Gear Speed Reducer for Wind Turbine Revenue Share (%), by Types 2024 & 2032
- Figure 10: North America Gear Speed Reducer for Wind Turbine Volume Share (%), by Types 2024 & 2032
- Figure 11: North America Gear Speed Reducer for Wind Turbine Revenue (million), by Country 2024 & 2032
- Figure 12: North America Gear Speed Reducer for Wind Turbine Volume (K), by Country 2024 & 2032
- Figure 13: North America Gear Speed Reducer for Wind Turbine Revenue Share (%), by Country 2024 & 2032
- Figure 14: North America Gear Speed Reducer for Wind Turbine Volume Share (%), by Country 2024 & 2032
- Figure 15: South America Gear Speed Reducer for Wind Turbine Revenue (million), by Application 2024 & 2032
- Figure 16: South America Gear Speed Reducer for Wind Turbine Volume (K), by Application 2024 & 2032
- Figure 17: South America Gear Speed Reducer for Wind Turbine Revenue Share (%), by Application 2024 & 2032
- Figure 18: South America Gear Speed Reducer for Wind Turbine Volume Share (%), by Application 2024 & 2032
- Figure 19: South America Gear Speed Reducer for Wind Turbine Revenue (million), by Types 2024 & 2032
- Figure 20: South America Gear Speed Reducer for Wind Turbine Volume (K), by Types 2024 & 2032
- Figure 21: South America Gear Speed Reducer for Wind Turbine Revenue Share (%), by Types 2024 & 2032
- Figure 22: South America Gear Speed Reducer for Wind Turbine Volume Share (%), by Types 2024 & 2032
- Figure 23: South America Gear Speed Reducer for Wind Turbine Revenue (million), by Country 2024 & 2032
- Figure 24: South America Gear Speed Reducer for Wind Turbine Volume (K), by Country 2024 & 2032
- Figure 25: South America Gear Speed Reducer for Wind Turbine Revenue Share (%), by Country 2024 & 2032
- Figure 26: South America Gear Speed Reducer for Wind Turbine Volume Share (%), by Country 2024 & 2032
- Figure 27: Europe Gear Speed Reducer for Wind Turbine Revenue (million), by Application 2024 & 2032
- Figure 28: Europe Gear Speed Reducer for Wind Turbine Volume (K), by Application 2024 & 2032
- Figure 29: Europe Gear Speed Reducer for Wind Turbine Revenue Share (%), by Application 2024 & 2032
- Figure 30: Europe Gear Speed Reducer for Wind Turbine Volume Share (%), by Application 2024 & 2032
- Figure 31: Europe Gear Speed Reducer for Wind Turbine Revenue (million), by Types 2024 & 2032
- Figure 32: Europe Gear Speed Reducer for Wind Turbine Volume (K), by Types 2024 & 2032
- Figure 33: Europe Gear Speed Reducer for Wind Turbine Revenue Share (%), by Types 2024 & 2032
- Figure 34: Europe Gear Speed Reducer for Wind Turbine Volume Share (%), by Types 2024 & 2032
- Figure 35: Europe Gear Speed Reducer for Wind Turbine Revenue (million), by Country 2024 & 2032
- Figure 36: Europe Gear Speed Reducer for Wind Turbine Volume (K), by Country 2024 & 2032
- Figure 37: Europe Gear Speed Reducer for Wind Turbine Revenue Share (%), by Country 2024 & 2032
- Figure 38: Europe Gear Speed Reducer for Wind Turbine Volume Share (%), by Country 2024 & 2032
- Figure 39: Middle East & Africa Gear Speed Reducer for Wind Turbine Revenue (million), by Application 2024 & 2032
- Figure 40: Middle East & Africa Gear Speed Reducer for Wind Turbine Volume (K), by Application 2024 & 2032
- Figure 41: Middle East & Africa Gear Speed Reducer for Wind Turbine Revenue Share (%), by Application 2024 & 2032
- Figure 42: Middle East & Africa Gear Speed Reducer for Wind Turbine Volume Share (%), by Application 2024 & 2032
- Figure 43: Middle East & Africa Gear Speed Reducer for Wind Turbine Revenue (million), by Types 2024 & 2032
- Figure 44: Middle East & Africa Gear Speed Reducer for Wind Turbine Volume (K), by Types 2024 & 2032
- Figure 45: Middle East & Africa Gear Speed Reducer for Wind Turbine Revenue Share (%), by Types 2024 & 2032
- Figure 46: Middle East & Africa Gear Speed Reducer for Wind Turbine Volume Share (%), by Types 2024 & 2032
- Figure 47: Middle East & Africa Gear Speed Reducer for Wind Turbine Revenue (million), by Country 2024 & 2032
- Figure 48: Middle East & Africa Gear Speed Reducer for Wind Turbine Volume (K), by Country 2024 & 2032
- Figure 49: Middle East & Africa Gear Speed Reducer for Wind Turbine Revenue Share (%), by Country 2024 & 2032
- Figure 50: Middle East & Africa Gear Speed Reducer for Wind Turbine Volume Share (%), by Country 2024 & 2032
- Figure 51: Asia Pacific Gear Speed Reducer for Wind Turbine Revenue (million), by Application 2024 & 2032
- Figure 52: Asia Pacific Gear Speed Reducer for Wind Turbine Volume (K), by Application 2024 & 2032
- Figure 53: Asia Pacific Gear Speed Reducer for Wind Turbine Revenue Share (%), by Application 2024 & 2032
- Figure 54: Asia Pacific Gear Speed Reducer for Wind Turbine Volume Share (%), by Application 2024 & 2032
- Figure 55: Asia Pacific Gear Speed Reducer for Wind Turbine Revenue (million), by Types 2024 & 2032
- Figure 56: Asia Pacific Gear Speed Reducer for Wind Turbine Volume (K), by Types 2024 & 2032
- Figure 57: Asia Pacific Gear Speed Reducer for Wind Turbine Revenue Share (%), by Types 2024 & 2032
- Figure 58: Asia Pacific Gear Speed Reducer for Wind Turbine Volume Share (%), by Types 2024 & 2032
- Figure 59: Asia Pacific Gear Speed Reducer for Wind Turbine Revenue (million), by Country 2024 & 2032
- Figure 60: Asia Pacific Gear Speed Reducer for Wind Turbine Volume (K), by Country 2024 & 2032
- Figure 61: Asia Pacific Gear Speed Reducer for Wind Turbine Revenue Share (%), by Country 2024 & 2032
- Figure 62: Asia Pacific Gear Speed Reducer for Wind Turbine Volume Share (%), by Country 2024 & 2032
List of Tables
- Table 1: Global Gear Speed Reducer for Wind Turbine Revenue million Forecast, by Region 2019 & 2032
- Table 2: Global Gear Speed Reducer for Wind Turbine Volume K Forecast, by Region 2019 & 2032
- Table 3: Global Gear Speed Reducer for Wind Turbine Revenue million Forecast, by Application 2019 & 2032
- Table 4: Global Gear Speed Reducer for Wind Turbine Volume K Forecast, by Application 2019 & 2032
- Table 5: Global Gear Speed Reducer for Wind Turbine Revenue million Forecast, by Types 2019 & 2032
- Table 6: Global Gear Speed Reducer for Wind Turbine Volume K Forecast, by Types 2019 & 2032
- Table 7: Global Gear Speed Reducer for Wind Turbine Revenue million Forecast, by Region 2019 & 2032
- Table 8: Global Gear Speed Reducer for Wind Turbine Volume K Forecast, by Region 2019 & 2032
- Table 9: Global Gear Speed Reducer for Wind Turbine Revenue million Forecast, by Application 2019 & 2032
- Table 10: Global Gear Speed Reducer for Wind Turbine Volume K Forecast, by Application 2019 & 2032
- Table 11: Global Gear Speed Reducer for Wind Turbine Revenue million Forecast, by Types 2019 & 2032
- Table 12: Global Gear Speed Reducer for Wind Turbine Volume K Forecast, by Types 2019 & 2032
- Table 13: Global Gear Speed Reducer for Wind Turbine Revenue million Forecast, by Country 2019 & 2032
- Table 14: Global Gear Speed Reducer for Wind Turbine Volume K Forecast, by Country 2019 & 2032
- Table 15: United States Gear Speed Reducer for Wind Turbine Revenue (million) Forecast, by Application 2019 & 2032
- Table 16: United States Gear Speed Reducer for Wind Turbine Volume (K) Forecast, by Application 2019 & 2032
- Table 17: Canada Gear Speed Reducer for Wind Turbine Revenue (million) Forecast, by Application 2019 & 2032
- Table 18: Canada Gear Speed Reducer for Wind Turbine Volume (K) Forecast, by Application 2019 & 2032
- Table 19: Mexico Gear Speed Reducer for Wind Turbine Revenue (million) Forecast, by Application 2019 & 2032
- Table 20: Mexico Gear Speed Reducer for Wind Turbine Volume (K) Forecast, by Application 2019 & 2032
- Table 21: Global Gear Speed Reducer for Wind Turbine Revenue million Forecast, by Application 2019 & 2032
- Table 22: Global Gear Speed Reducer for Wind Turbine Volume K Forecast, by Application 2019 & 2032
- Table 23: Global Gear Speed Reducer for Wind Turbine Revenue million Forecast, by Types 2019 & 2032
- Table 24: Global Gear Speed Reducer for Wind Turbine Volume K Forecast, by Types 2019 & 2032
- Table 25: Global Gear Speed Reducer for Wind Turbine Revenue million Forecast, by Country 2019 & 2032
- Table 26: Global Gear Speed Reducer for Wind Turbine Volume K Forecast, by Country 2019 & 2032
- Table 27: Brazil Gear Speed Reducer for Wind Turbine Revenue (million) Forecast, by Application 2019 & 2032
- Table 28: Brazil Gear Speed Reducer for Wind Turbine Volume (K) Forecast, by Application 2019 & 2032
- Table 29: Argentina Gear Speed Reducer for Wind Turbine Revenue (million) Forecast, by Application 2019 & 2032
- Table 30: Argentina Gear Speed Reducer for Wind Turbine Volume (K) Forecast, by Application 2019 & 2032
- Table 31: Rest of South America Gear Speed Reducer for Wind Turbine Revenue (million) Forecast, by Application 2019 & 2032
- Table 32: Rest of South America Gear Speed Reducer for Wind Turbine Volume (K) Forecast, by Application 2019 & 2032
- Table 33: Global Gear Speed Reducer for Wind Turbine Revenue million Forecast, by Application 2019 & 2032
- Table 34: Global Gear Speed Reducer for Wind Turbine Volume K Forecast, by Application 2019 & 2032
- Table 35: Global Gear Speed Reducer for Wind Turbine Revenue million Forecast, by Types 2019 & 2032
- Table 36: Global Gear Speed Reducer for Wind Turbine Volume K Forecast, by Types 2019 & 2032
- Table 37: Global Gear Speed Reducer for Wind Turbine Revenue million Forecast, by Country 2019 & 2032
- Table 38: Global Gear Speed Reducer for Wind Turbine Volume K Forecast, by Country 2019 & 2032
- Table 39: United Kingdom Gear Speed Reducer for Wind Turbine Revenue (million) Forecast, by Application 2019 & 2032
- Table 40: United Kingdom Gear Speed Reducer for Wind Turbine Volume (K) Forecast, by Application 2019 & 2032
- Table 41: Germany Gear Speed Reducer for Wind Turbine Revenue (million) Forecast, by Application 2019 & 2032
- Table 42: Germany Gear Speed Reducer for Wind Turbine Volume (K) Forecast, by Application 2019 & 2032
- Table 43: France Gear Speed Reducer for Wind Turbine Revenue (million) Forecast, by Application 2019 & 2032
- Table 44: France Gear Speed Reducer for Wind Turbine Volume (K) Forecast, by Application 2019 & 2032
- Table 45: Italy Gear Speed Reducer for Wind Turbine Revenue (million) Forecast, by Application 2019 & 2032
- Table 46: Italy Gear Speed Reducer for Wind Turbine Volume (K) Forecast, by Application 2019 & 2032
- Table 47: Spain Gear Speed Reducer for Wind Turbine Revenue (million) Forecast, by Application 2019 & 2032
- Table 48: Spain Gear Speed Reducer for Wind Turbine Volume (K) Forecast, by Application 2019 & 2032
- Table 49: Russia Gear Speed Reducer for Wind Turbine Revenue (million) Forecast, by Application 2019 & 2032
- Table 50: Russia Gear Speed Reducer for Wind Turbine Volume (K) Forecast, by Application 2019 & 2032
- Table 51: Benelux Gear Speed Reducer for Wind Turbine Revenue (million) Forecast, by Application 2019 & 2032
- Table 52: Benelux Gear Speed Reducer for Wind Turbine Volume (K) Forecast, by Application 2019 & 2032
- Table 53: Nordics Gear Speed Reducer for Wind Turbine Revenue (million) Forecast, by Application 2019 & 2032
- Table 54: Nordics Gear Speed Reducer for Wind Turbine Volume (K) Forecast, by Application 2019 & 2032
- Table 55: Rest of Europe Gear Speed Reducer for Wind Turbine Revenue (million) Forecast, by Application 2019 & 2032
- Table 56: Rest of Europe Gear Speed Reducer for Wind Turbine Volume (K) Forecast, by Application 2019 & 2032
- Table 57: Global Gear Speed Reducer for Wind Turbine Revenue million Forecast, by Application 2019 & 2032
- Table 58: Global Gear Speed Reducer for Wind Turbine Volume K Forecast, by Application 2019 & 2032
- Table 59: Global Gear Speed Reducer for Wind Turbine Revenue million Forecast, by Types 2019 & 2032
- Table 60: Global Gear Speed Reducer for Wind Turbine Volume K Forecast, by Types 2019 & 2032
- Table 61: Global Gear Speed Reducer for Wind Turbine Revenue million Forecast, by Country 2019 & 2032
- Table 62: Global Gear Speed Reducer for Wind Turbine Volume K Forecast, by Country 2019 & 2032
- Table 63: Turkey Gear Speed Reducer for Wind Turbine Revenue (million) Forecast, by Application 2019 & 2032
- Table 64: Turkey Gear Speed Reducer for Wind Turbine Volume (K) Forecast, by Application 2019 & 2032
- Table 65: Israel Gear Speed Reducer for Wind Turbine Revenue (million) Forecast, by Application 2019 & 2032
- Table 66: Israel Gear Speed Reducer for Wind Turbine Volume (K) Forecast, by Application 2019 & 2032
- Table 67: GCC Gear Speed Reducer for Wind Turbine Revenue (million) Forecast, by Application 2019 & 2032
- Table 68: GCC Gear Speed Reducer for Wind Turbine Volume (K) Forecast, by Application 2019 & 2032
- Table 69: North Africa Gear Speed Reducer for Wind Turbine Revenue (million) Forecast, by Application 2019 & 2032
- Table 70: North Africa Gear Speed Reducer for Wind Turbine Volume (K) Forecast, by Application 2019 & 2032
- Table 71: South Africa Gear Speed Reducer for Wind Turbine Revenue (million) Forecast, by Application 2019 & 2032
- Table 72: South Africa Gear Speed Reducer for Wind Turbine Volume (K) Forecast, by Application 2019 & 2032
- Table 73: Rest of Middle East & Africa Gear Speed Reducer for Wind Turbine Revenue (million) Forecast, by Application 2019 & 2032
- Table 74: Rest of Middle East & Africa Gear Speed Reducer for Wind Turbine Volume (K) Forecast, by Application 2019 & 2032
- Table 75: Global Gear Speed Reducer for Wind Turbine Revenue million Forecast, by Application 2019 & 2032
- Table 76: Global Gear Speed Reducer for Wind Turbine Volume K Forecast, by Application 2019 & 2032
- Table 77: Global Gear Speed Reducer for Wind Turbine Revenue million Forecast, by Types 2019 & 2032
- Table 78: Global Gear Speed Reducer for Wind Turbine Volume K Forecast, by Types 2019 & 2032
- Table 79: Global Gear Speed Reducer for Wind Turbine Revenue million Forecast, by Country 2019 & 2032
- Table 80: Global Gear Speed Reducer for Wind Turbine Volume K Forecast, by Country 2019 & 2032
- Table 81: China Gear Speed Reducer for Wind Turbine Revenue (million) Forecast, by Application 2019 & 2032
- Table 82: China Gear Speed Reducer for Wind Turbine Volume (K) Forecast, by Application 2019 & 2032
- Table 83: India Gear Speed Reducer for Wind Turbine Revenue (million) Forecast, by Application 2019 & 2032
- Table 84: India Gear Speed Reducer for Wind Turbine Volume (K) Forecast, by Application 2019 & 2032
- Table 85: Japan Gear Speed Reducer for Wind Turbine Revenue (million) Forecast, by Application 2019 & 2032
- Table 86: Japan Gear Speed Reducer for Wind Turbine Volume (K) Forecast, by Application 2019 & 2032
- Table 87: South Korea Gear Speed Reducer for Wind Turbine Revenue (million) Forecast, by Application 2019 & 2032
- Table 88: South Korea Gear Speed Reducer for Wind Turbine Volume (K) Forecast, by Application 2019 & 2032
- Table 89: ASEAN Gear Speed Reducer for Wind Turbine Revenue (million) Forecast, by Application 2019 & 2032
- Table 90: ASEAN Gear Speed Reducer for Wind Turbine Volume (K) Forecast, by Application 2019 & 2032
- Table 91: Oceania Gear Speed Reducer for Wind Turbine Revenue (million) Forecast, by Application 2019 & 2032
- Table 92: Oceania Gear Speed Reducer for Wind Turbine Volume (K) Forecast, by Application 2019 & 2032
- Table 93: Rest of Asia Pacific Gear Speed Reducer for Wind Turbine Revenue (million) Forecast, by Application 2019 & 2032
- Table 94: Rest of Asia Pacific Gear Speed Reducer for Wind Turbine Volume (K) Forecast, by Application 2019 & 2032
Frequently Asked Questions
1. What is the projected Compound Annual Growth Rate (CAGR) of the Gear Speed Reducer for Wind Turbine?
The projected CAGR is approximately XX%.
2. Which companies are prominent players in the Gear Speed Reducer for Wind Turbine?
Key companies in the market include Bonfiglioli, Comer Industries, Dana, NGC Gears, Liebherr, Chongqing Gearbox, Yinchuan Weili Transmission, Nabtesco, Bosch-Rexroth, Enercon, DHHI.
3. What are the main segments of the Gear Speed Reducer for Wind Turbine?
The market segments include Application, Types.
4. Can you provide details about the market size?
The market size is estimated to be USD XXX million as of 2022.
5. What are some drivers contributing to market growth?
N/A
6. What are the notable trends driving market growth?
N/A
7. Are there any restraints impacting market growth?
N/A
8. Can you provide examples of recent developments in the market?
N/A
9. What pricing options are available for accessing the report?
Pricing options include single-user, multi-user, and enterprise licenses priced at USD 3350.00, USD 5025.00, and USD 6700.00 respectively.
10. Is the market size provided in terms of value or volume?
The market size is provided in terms of value, measured in million and volume, measured in K.
11. Are there any specific market keywords associated with the report?
Yes, the market keyword associated with the report is "Gear Speed Reducer for Wind Turbine," which aids in identifying and referencing the specific market segment covered.
12. How do I determine which pricing option suits my needs best?
The pricing options vary based on user requirements and access needs. Individual users may opt for single-user licenses, while businesses requiring broader access may choose multi-user or enterprise licenses for cost-effective access to the report.
13. Are there any additional resources or data provided in the Gear Speed Reducer for Wind Turbine report?
While the report offers comprehensive insights, it's advisable to review the specific contents or supplementary materials provided to ascertain if additional resources or data are available.
14. How can I stay updated on further developments or reports in the Gear Speed Reducer for Wind Turbine?
To stay informed about further developments, trends, and reports in the Gear Speed Reducer for Wind Turbine, consider subscribing to industry newsletters, following relevant companies and organizations, or regularly checking reputable industry news sources and publications.
Methodology
Step 1 - Identification of Relevant Samples Size from Population Database


Step 2 - Approaches for Defining Global Market Size (Value, Volume* & Price*)

Note*: In applicable scenarios
Step 3 - Data Sources
Primary Research
- Web Analytics
- Survey Reports
- Research Institute
- Latest Research Reports
- Opinion Leaders
Secondary Research
- Annual Reports
- White Paper
- Latest Press Release
- Industry Association
- Paid Database
- Investor Presentations

Step 4 - Data Triangulation
Involves using different sources of information in order to increase the validity of a study
These sources are likely to be stakeholders in a program - participants, other researchers, program staff, other community members, and so on.
Then we put all data in single framework & apply various statistical tools to find out the dynamic on the market.
During the analysis stage, feedback from the stakeholder groups would be compared to determine areas of agreement as well as areas of divergence


