
Key Insights
The global power plant uranium market is experiencing a period of moderate growth, driven by the continued reliance on nuclear power as a low-carbon energy source in several regions. The market, valued at approximately $25 billion in 2025, is projected to exhibit a Compound Annual Growth Rate (CAGR) of around 3.5% from 2025 to 2033. This growth is underpinned by several factors, including the increasing demand for energy in developing nations, government policies promoting nuclear energy as a cleaner alternative to fossil fuels, and the ongoing efforts to improve the efficiency and safety of nuclear power plants. However, the market faces challenges including fluctuating uranium prices, environmental concerns associated with nuclear waste disposal, and the inherent risks associated with nuclear power generation. The historical period (2019-2024) likely saw some market volatility, possibly influenced by factors such as the Fukushima Daiichi accident's lingering impact and shifts in global energy policies. The projected growth signifies a steady, though not explosive, expansion for the foreseeable future.
Despite these challenges, the long-term outlook for the power plant uranium market remains relatively positive. Continued investments in nuclear infrastructure, particularly in countries committed to reducing their carbon footprint, are expected to sustain demand. Technological advancements in reactor designs and nuclear waste management are also contributing to a more favorable perception of nuclear power. Regional variations in market growth are anticipated, with established nuclear energy markets (such as North America and Europe) showing moderate growth, while emerging markets (such as Asia) might demonstrate potentially higher growth rates, contingent on infrastructure development and economic conditions. Nevertheless, geopolitical factors and regulatory changes will likely continue to influence market dynamics.
Global Power Plant Uranium Market Report: A Comprehensive Analysis (2019-2033)
This in-depth report provides a comprehensive analysis of the Global Power Plant Uranium Market, offering actionable insights for industry professionals. Covering the period from 2019 to 2033, with a focus on 2025, this report meticulously examines market dynamics, key players, and future trends. The report leverages extensive data analysis and industry expertise to deliver a clear understanding of this critical energy sector. Download now to gain a competitive edge.
Global Power Plant Uranium Market Market Structure & Innovation Trends
The global power plant uranium market exhibits a moderately concentrated structure, with several major players holding significant market share. Key players such as Cameco Corporation, Kazatomprom, and Orano SA dominate the natural uranium segment, while others like General Atomics are prominent in enriched uranium. Market share fluctuations are influenced by factors such as geopolitical events, uranium production levels, and long-term supply contracts.
- Market Concentration: The top five players account for approximately xx% of the global market share (2025).
- Innovation Drivers: Research into advanced reactor designs, improved uranium enrichment technologies, and sustainable mining practices are driving innovation.
- Regulatory Frameworks: Stringent nuclear safety regulations and environmental compliance standards significantly impact market dynamics. Variations in regulatory frameworks across different countries affect investment decisions and market access.
- Product Substitutes: While limited viable substitutes currently exist for uranium in nuclear power generation, research into alternative energy sources presents a long-term competitive challenge.
- End-User Demographics: The primary end-users are utilities and Independent Power Producers (IPPs), with a growing reliance on uranium-based fuel for electricity generation.
- M&A Activities: The market has witnessed xx M&A deals valued at approximately $xx Million in the historical period (2019-2024), primarily driven by strategic acquisitions aimed at securing uranium resources and expanding market reach.
Global Power Plant Uranium Market Market Dynamics & Trends
The global power plant uranium market is projected to experience a CAGR of xx% during the forecast period (2025-2033), driven by a combination of factors. The increasing demand for electricity, particularly in developing economies, coupled with the ongoing reliance on nuclear power, fuels market growth. However, the intermittent nature of renewable energy sources and concerns about climate change continue to support the need for a reliable, low-carbon energy source. The market penetration of uranium-based nuclear power is expected to increase gradually in developing countries despite increasing opposition to nuclear energy in certain regions. Technological advancements in reactor design, improving energy efficiency, and reducing waste further contribute to market expansion. The competitive landscape is characterized by strategic alliances, capacity expansions, and technological advancements by major players.
Dominant Regions & Segments in Global Power Plant Uranium Market
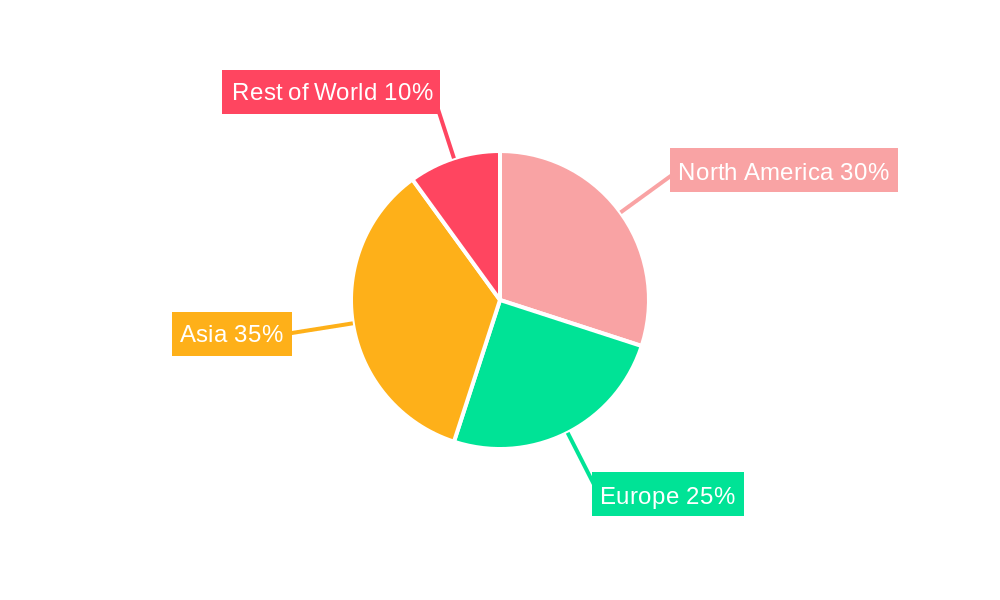
The Asia-Pacific region is expected to be the dominant market for power plant uranium, driven by strong economic growth and increasing nuclear power capacity in countries like India and China.
By Product Type: Natural uranium currently dominates the market, but enriched uranium is expected to witness significant growth due to advanced reactor applications.
By Application: Pressurized Water Reactors (PWRs) hold the largest market share due to their widespread adoption. However, Boiling Water Reactors (BWRs) and Advanced Reactors are gaining traction.
By End-User: Utilities represent the largest end-user segment, with IPPs contributing significantly to market growth, especially in regions with favorable regulatory environments and investment policies.
Key Drivers: Government initiatives promoting nuclear energy, economic growth, and expanding electricity demand are key drivers in dominant regions. Furthermore, stable policy and regulatory frameworks are crucial for attracting investments in nuclear power infrastructure.
The detailed dominance analysis reveals strong correlation between the regions having high GDP growth and government support for nuclear energy. Investments in nuclear power infrastructure significantly influence the uptake of uranium in these regions.
Global Power Plant Uranium Market Product Innovations
Recent innovations focus on improving uranium enrichment processes, enhancing reactor efficiency, and minimizing waste. Advanced reactor designs, such as small modular reactors (SMRs), offer improved safety, cost-effectiveness, and flexibility, driving market growth and influencing future product development. These advancements aim to enhance the safety, efficiency, and sustainability of nuclear power generation, solidifying the long-term market viability of uranium as a fuel source.
Report Scope & Segmentation Analysis
This report segments the global power plant uranium market comprehensively across product type (natural uranium, enriched uranium), application (PWRs, BWRs, advanced reactors), and end-user (utilities, IPPs). Each segment is analyzed for market size, growth projections, and competitive dynamics. The report examines the market from 2019 to 2033, providing historical data and forecasting future trends. The study also provides a detailed competitive landscape and key player analysis.
By Product Type: The market is segmented into natural uranium and enriched uranium, with projected growth rates driven by respective application demands and technological advancements.
By Application: The report analyzes PWR, BWR, and advanced reactors detailing their individual market shares and future growth potential.
By End-User: Utilities and IPPs are assessed for their consumption patterns, growth projections, and impact on market trends.
Key Drivers of Global Power Plant Uranium Market Growth
Several factors contribute to the growth of the global power plant uranium market. The rising global energy demand, particularly in emerging economies, is a major driver. Government initiatives promoting nuclear power as a low-carbon energy source further stimulate market expansion. Advancements in reactor technology, enhancing safety and efficiency, also contribute significantly. Finally, stable and supportive regulatory frameworks in certain regions attract substantial investment in nuclear power infrastructure, bolstering the demand for uranium.
Challenges in the Global Power Plant Uranium Market Sector
The global power plant uranium market faces several challenges. Fluctuations in uranium prices due to supply chain disruptions and geopolitical factors present significant risks. Strict environmental regulations and nuclear safety concerns can impede expansion. Furthermore, public perception and opposition to nuclear power in some regions pose a significant constraint to market growth. Competition from renewable energy sources also exerts pressure on uranium's market share. The overall impact of these challenges is quantified through reduced investment in new nuclear projects and slowed market expansion in certain regions.
Emerging Opportunities in Global Power Plant Uranium Market
Emerging opportunities exist in the development and deployment of advanced reactor technologies. Small Modular Reactors (SMRs) offer significant advantages in terms of safety, cost-effectiveness, and reduced waste. Furthermore, expanding nuclear power infrastructure in developing economies presents a considerable growth opportunity. Finally, improvements in uranium exploration and extraction technologies promise to enhance efficiency and reduce environmental impact.
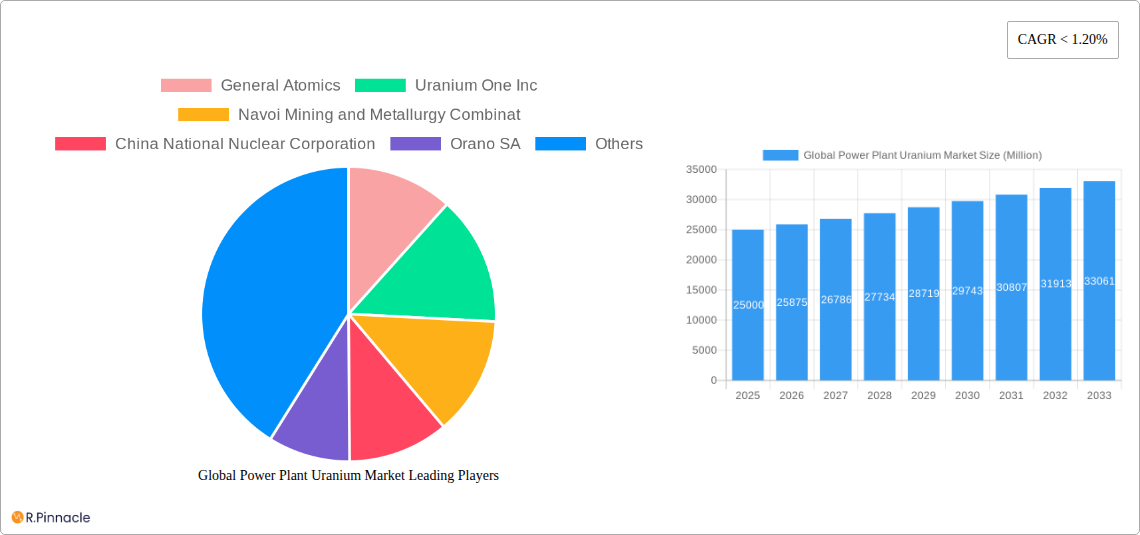
Leading Players in the Global Power Plant Uranium Market Market
- General Atomics
- Uranium One Inc
- Navoi Mining and Metallurgy Combinat
- China National Nuclear Corporation
- Orano SA
- China General Nuclear Power Group (CGN)
- ARMZ Uranium Holding Co
- Cameco Corporation
- NAC Kazatomprom JSC
- BHP Group Ltd
Key Developments in Global Power Plant Uranium Market Industry
- March 2022: India announced the import of nearly 100 tonnes of natural uranium and 133 fuel assemblies for FY 2022-23, sourcing from Canada, Kazakhstan, Russia, and Uzbekistan. This significantly boosted demand for uranium in the short-term.
- April 2022: The Indian Minister of State for Atomic Energy approved the construction of 10 indigenous 700 MW Pressurized Heavy Water Reactors. This long-term commitment underscores India's commitment to nuclear energy and its future uranium demand.
Future Outlook for Global Power Plant Uranium Market Market
The future outlook for the global power plant uranium market remains positive, driven by sustained global energy demand, particularly in developing economies. The increasing adoption of advanced reactor designs, enhanced safety measures, and focused government policies promoting nuclear power are key growth accelerators. Furthermore, technological advancements in uranium extraction and enrichment techniques will boost market efficiency and sustainability. The potential for growth is further amplified by the strategic importance of nuclear energy in ensuring energy security and reducing carbon emissions. These factors point to a robust and growing market for uranium in the coming decade.
Global Power Plant Uranium Market Segmentation
- 1. North America
- 2. Asia-Pacific
- 3. Europe
- 4. Middle-East and Africa
- 5. South America
Global Power Plant Uranium Market Segmentation By Geography
-
1. North America
- 1.1. United States
- 1.2. Canada
- 1.3. Mexico
-
2. South America
- 2.1. Brazil
- 2.2. Argentina
- 2.3. Rest of South America
-
3. Europe
- 3.1. United Kingdom
- 3.2. Germany
- 3.3. France
- 3.4. Italy
- 3.5. Spain
- 3.6. Russia
- 3.7. Benelux
- 3.8. Nordics
- 3.9. Rest of Europe
-
4. Middle East & Africa
- 4.1. Turkey
- 4.2. Israel
- 4.3. GCC
- 4.4. North Africa
- 4.5. South Africa
- 4.6. Rest of Middle East & Africa
-
5. Asia Pacific
- 5.1. China
- 5.2. India
- 5.3. Japan
- 5.4. South Korea
- 5.5. ASEAN
- 5.6. Oceania
- 5.7. Rest of Asia Pacific
Global Power Plant Uranium Market REPORT HIGHLIGHTS
| Aspects | Details |
|---|---|
| Study Period | 2019-2033 |
| Base Year | 2024 |
| Estimated Year | 2025 |
| Forecast Period | 2025-2033 |
| Historical Period | 2019-2024 |
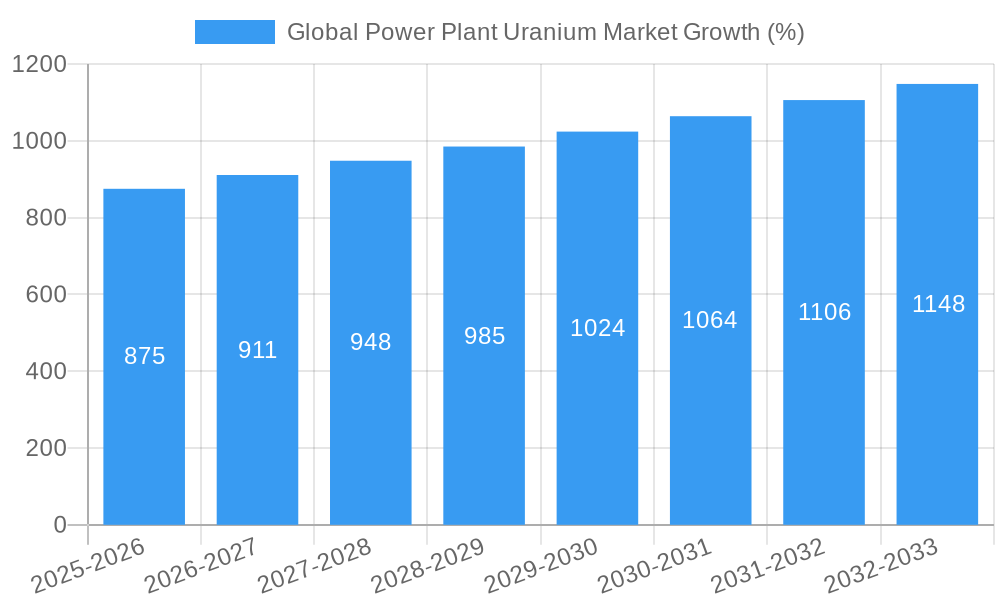
| Growth Rate | CAGR of < 1.20% from 2019-2033 |
| Segmentation |
|
Table of Contents
- 1. Introduction
- 1.1. Research Scope
- 1.2. Market Segmentation
- 1.3. Research Methodology
- 1.4. Definitions and Assumptions
- 2. Executive Summary
- 2.1. Introduction
- 3. Market Dynamics
- 3.1. Introduction
- 3.2. Market Drivers
- 3.2.1 4.; Increasing Amount of Waste Generation
- 3.2.2 Growing Concern for Waste Management to Meet the Needs for Sustainable Urban Living4.; Increasing Focus on Non-fossil Fuel Sources of Energy
- 3.3. Market Restrains
- 3.3.1. 4.; Expensive Nature of Incinerators
- 3.4. Market Trends
- 3.4.1. Renewable Energy Likely to Restraint the Market Growth
- 4. Market Factor Analysis
- 4.1. Porters Five Forces
- 4.2. Supply/Value Chain
- 4.3. PESTEL analysis
- 4.4. Market Entropy
- 4.5. Patent/Trademark Analysis
- 5. Global Power Plant Uranium Market Analysis, Insights and Forecast, 2019-2031
- 5.1. Market Analysis, Insights and Forecast - by North America
- 5.2. Market Analysis, Insights and Forecast - by Asia-Pacific
- 5.3. Market Analysis, Insights and Forecast - by Europe
- 5.4. Market Analysis, Insights and Forecast - by Middle-East and Africa
- 5.5. Market Analysis, Insights and Forecast - by South America
- 5.6. Market Analysis, Insights and Forecast - by Region
- 5.6.1. North America
- 5.6.2. South America
- 5.6.3. Europe
- 5.6.4. Middle East & Africa
- 5.6.5. Asia Pacific
- 5.1. Market Analysis, Insights and Forecast - by North America
- 6. North America Global Power Plant Uranium Market Analysis, Insights and Forecast, 2019-2031
- 6.1. Market Analysis, Insights and Forecast - by North America
- 6.2. Market Analysis, Insights and Forecast - by Asia-Pacific
- 6.3. Market Analysis, Insights and Forecast - by Europe
- 6.4. Market Analysis, Insights and Forecast - by Middle-East and Africa
- 6.5. Market Analysis, Insights and Forecast - by South America
- 6.1. Market Analysis, Insights and Forecast - by North America
- 7. South America Global Power Plant Uranium Market Analysis, Insights and Forecast, 2019-2031
- 7.1. Market Analysis, Insights and Forecast - by North America
- 7.2. Market Analysis, Insights and Forecast - by Asia-Pacific
- 7.3. Market Analysis, Insights and Forecast - by Europe
- 7.4. Market Analysis, Insights and Forecast - by Middle-East and Africa
- 7.5. Market Analysis, Insights and Forecast - by South America
- 7.1. Market Analysis, Insights and Forecast - by North America
- 8. Europe Global Power Plant Uranium Market Analysis, Insights and Forecast, 2019-2031
- 8.1. Market Analysis, Insights and Forecast - by North America
- 8.2. Market Analysis, Insights and Forecast - by Asia-Pacific
- 8.3. Market Analysis, Insights and Forecast - by Europe
- 8.4. Market Analysis, Insights and Forecast - by Middle-East and Africa
- 8.5. Market Analysis, Insights and Forecast - by South America
- 8.1. Market Analysis, Insights and Forecast - by North America
- 9. Middle East & Africa Global Power Plant Uranium Market Analysis, Insights and Forecast, 2019-2031
- 9.1. Market Analysis, Insights and Forecast - by North America
- 9.2. Market Analysis, Insights and Forecast - by Asia-Pacific
- 9.3. Market Analysis, Insights and Forecast - by Europe
- 9.4. Market Analysis, Insights and Forecast - by Middle-East and Africa
- 9.5. Market Analysis, Insights and Forecast - by South America
- 9.1. Market Analysis, Insights and Forecast - by North America
- 10. Asia Pacific Global Power Plant Uranium Market Analysis, Insights and Forecast, 2019-2031
- 10.1. Market Analysis, Insights and Forecast - by North America
- 10.2. Market Analysis, Insights and Forecast - by Asia-Pacific
- 10.3. Market Analysis, Insights and Forecast - by Europe
- 10.4. Market Analysis, Insights and Forecast - by Middle-East and Africa
- 10.5. Market Analysis, Insights and Forecast - by South America
- 10.1. Market Analysis, Insights and Forecast - by North America
- 11. North America Global Power Plant Uranium Market Analysis, Insights and Forecast, 2019-2031
- 11.1. Market Analysis, Insights and Forecast - By Country/Sub-region
- 11.1.1 United States
- 11.1.2 Canada
- 11.1.3 Mexico
- 12. Europe Global Power Plant Uranium Market Analysis, Insights and Forecast, 2019-2031
- 12.1. Market Analysis, Insights and Forecast - By Country/Sub-region
- 12.1.1 Germany
- 12.1.2 United Kingdom
- 12.1.3 France
- 12.1.4 Spain
- 12.1.5 Italy
- 12.1.6 Spain
- 12.1.7 Belgium
- 12.1.8 Netherland
- 12.1.9 Nordics
- 12.1.10 Rest of Europe
- 13. Asia Pacific Global Power Plant Uranium Market Analysis, Insights and Forecast, 2019-2031
- 13.1. Market Analysis, Insights and Forecast - By Country/Sub-region
- 13.1.1 China
- 13.1.2 Japan
- 13.1.3 India
- 13.1.4 South Korea
- 13.1.5 Southeast Asia
- 13.1.6 Australia
- 13.1.7 Indonesia
- 13.1.8 Phillipes
- 13.1.9 Singapore
- 13.1.10 Thailandc
- 13.1.11 Rest of Asia Pacific
- 14. South America Global Power Plant Uranium Market Analysis, Insights and Forecast, 2019-2031
- 14.1. Market Analysis, Insights and Forecast - By Country/Sub-region
- 14.1.1 Brazil
- 14.1.2 Argentina
- 14.1.3 Peru
- 14.1.4 Chile
- 14.1.5 Colombia
- 14.1.6 Ecuador
- 14.1.7 Venezuela
- 14.1.8 Rest of South America
- 15. MEA Global Power Plant Uranium Market Analysis, Insights and Forecast, 2019-2031
- 15.1. Market Analysis, Insights and Forecast - By Country/Sub-region
- 15.1.1 United Arab Emirates
- 15.1.2 Saudi Arabia
- 15.1.3 South Africa
- 15.1.4 Rest of Middle East and Africa
- 16. Competitive Analysis
- 16.1. Market Share Analysis 2024
- 16.2. Company Profiles
- 16.2.1 General Atomics
- 16.2.1.1. Overview
- 16.2.1.2. Products
- 16.2.1.3. SWOT Analysis
- 16.2.1.4. Recent Developments
- 16.2.1.5. Financials (Based on Availability)
- 16.2.2 Uranium One Inc
- 16.2.2.1. Overview
- 16.2.2.2. Products
- 16.2.2.3. SWOT Analysis
- 16.2.2.4. Recent Developments
- 16.2.2.5. Financials (Based on Availability)
- 16.2.3 Navoi Mining and Metallurgy Combinat
- 16.2.3.1. Overview
- 16.2.3.2. Products
- 16.2.3.3. SWOT Analysis
- 16.2.3.4. Recent Developments
- 16.2.3.5. Financials (Based on Availability)
- 16.2.4 China National Nuclear Corporation
- 16.2.4.1. Overview
- 16.2.4.2. Products
- 16.2.4.3. SWOT Analysis
- 16.2.4.4. Recent Developments
- 16.2.4.5. Financials (Based on Availability)
- 16.2.5 Orano SA
- 16.2.5.1. Overview
- 16.2.5.2. Products
- 16.2.5.3. SWOT Analysis
- 16.2.5.4. Recent Developments
- 16.2.5.5. Financials (Based on Availability)
- 16.2.6 China General Nuclear Power Group (CGN)
- 16.2.6.1. Overview
- 16.2.6.2. Products
- 16.2.6.3. SWOT Analysis
- 16.2.6.4. Recent Developments
- 16.2.6.5. Financials (Based on Availability)
- 16.2.7 ARMZ Uranium Holding Co
- 16.2.7.1. Overview
- 16.2.7.2. Products
- 16.2.7.3. SWOT Analysis
- 16.2.7.4. Recent Developments
- 16.2.7.5. Financials (Based on Availability)
- 16.2.8 Cameco Corporation
- 16.2.8.1. Overview
- 16.2.8.2. Products
- 16.2.8.3. SWOT Analysis
- 16.2.8.4. Recent Developments
- 16.2.8.5. Financials (Based on Availability)
- 16.2.9 NAC Kazatomprom JSC
- 16.2.9.1. Overview
- 16.2.9.2. Products
- 16.2.9.3. SWOT Analysis
- 16.2.9.4. Recent Developments
- 16.2.9.5. Financials (Based on Availability)
- 16.2.10 BHP Group Ltd
- 16.2.10.1. Overview
- 16.2.10.2. Products
- 16.2.10.3. SWOT Analysis
- 16.2.10.4. Recent Developments
- 16.2.10.5. Financials (Based on Availability)
- 16.2.1 General Atomics
List of Figures
- Figure 1: Global Global Power Plant Uranium Market Revenue Breakdown (Million, %) by Region 2024 & 2032
- Figure 2: North America Global Power Plant Uranium Market Revenue (Million), by Country 2024 & 2032
- Figure 3: North America Global Power Plant Uranium Market Revenue Share (%), by Country 2024 & 2032
- Figure 4: Europe Global Power Plant Uranium Market Revenue (Million), by Country 2024 & 2032
- Figure 5: Europe Global Power Plant Uranium Market Revenue Share (%), by Country 2024 & 2032
- Figure 6: Asia Pacific Global Power Plant Uranium Market Revenue (Million), by Country 2024 & 2032
- Figure 7: Asia Pacific Global Power Plant Uranium Market Revenue Share (%), by Country 2024 & 2032
- Figure 8: South America Global Power Plant Uranium Market Revenue (Million), by Country 2024 & 2032
- Figure 9: South America Global Power Plant Uranium Market Revenue Share (%), by Country 2024 & 2032
- Figure 10: MEA Global Power Plant Uranium Market Revenue (Million), by Country 2024 & 2032
- Figure 11: MEA Global Power Plant Uranium Market Revenue Share (%), by Country 2024 & 2032
- Figure 12: North America Global Power Plant Uranium Market Revenue (Million), by North America 2024 & 2032
- Figure 13: North America Global Power Plant Uranium Market Revenue Share (%), by North America 2024 & 2032
- Figure 14: North America Global Power Plant Uranium Market Revenue (Million), by Asia-Pacific 2024 & 2032
- Figure 15: North America Global Power Plant Uranium Market Revenue Share (%), by Asia-Pacific 2024 & 2032
- Figure 16: North America Global Power Plant Uranium Market Revenue (Million), by Europe 2024 & 2032
- Figure 17: North America Global Power Plant Uranium Market Revenue Share (%), by Europe 2024 & 2032
- Figure 18: North America Global Power Plant Uranium Market Revenue (Million), by Middle-East and Africa 2024 & 2032
- Figure 19: North America Global Power Plant Uranium Market Revenue Share (%), by Middle-East and Africa 2024 & 2032
- Figure 20: North America Global Power Plant Uranium Market Revenue (Million), by South America 2024 & 2032
- Figure 21: North America Global Power Plant Uranium Market Revenue Share (%), by South America 2024 & 2032
- Figure 22: North America Global Power Plant Uranium Market Revenue (Million), by Country 2024 & 2032
- Figure 23: North America Global Power Plant Uranium Market Revenue Share (%), by Country 2024 & 2032
- Figure 24: South America Global Power Plant Uranium Market Revenue (Million), by North America 2024 & 2032
- Figure 25: South America Global Power Plant Uranium Market Revenue Share (%), by North America 2024 & 2032
- Figure 26: South America Global Power Plant Uranium Market Revenue (Million), by Asia-Pacific 2024 & 2032
- Figure 27: South America Global Power Plant Uranium Market Revenue Share (%), by Asia-Pacific 2024 & 2032
- Figure 28: South America Global Power Plant Uranium Market Revenue (Million), by Europe 2024 & 2032
- Figure 29: South America Global Power Plant Uranium Market Revenue Share (%), by Europe 2024 & 2032
- Figure 30: South America Global Power Plant Uranium Market Revenue (Million), by Middle-East and Africa 2024 & 2032
- Figure 31: South America Global Power Plant Uranium Market Revenue Share (%), by Middle-East and Africa 2024 & 2032
- Figure 32: South America Global Power Plant Uranium Market Revenue (Million), by South America 2024 & 2032
- Figure 33: South America Global Power Plant Uranium Market Revenue Share (%), by South America 2024 & 2032
- Figure 34: South America Global Power Plant Uranium Market Revenue (Million), by Country 2024 & 2032
- Figure 35: South America Global Power Plant Uranium Market Revenue Share (%), by Country 2024 & 2032
- Figure 36: Europe Global Power Plant Uranium Market Revenue (Million), by North America 2024 & 2032
- Figure 37: Europe Global Power Plant Uranium Market Revenue Share (%), by North America 2024 & 2032
- Figure 38: Europe Global Power Plant Uranium Market Revenue (Million), by Asia-Pacific 2024 & 2032
- Figure 39: Europe Global Power Plant Uranium Market Revenue Share (%), by Asia-Pacific 2024 & 2032
- Figure 40: Europe Global Power Plant Uranium Market Revenue (Million), by Europe 2024 & 2032
- Figure 41: Europe Global Power Plant Uranium Market Revenue Share (%), by Europe 2024 & 2032
- Figure 42: Europe Global Power Plant Uranium Market Revenue (Million), by Middle-East and Africa 2024 & 2032
- Figure 43: Europe Global Power Plant Uranium Market Revenue Share (%), by Middle-East and Africa 2024 & 2032
- Figure 44: Europe Global Power Plant Uranium Market Revenue (Million), by South America 2024 & 2032
- Figure 45: Europe Global Power Plant Uranium Market Revenue Share (%), by South America 2024 & 2032
- Figure 46: Europe Global Power Plant Uranium Market Revenue (Million), by Country 2024 & 2032
- Figure 47: Europe Global Power Plant Uranium Market Revenue Share (%), by Country 2024 & 2032
- Figure 48: Middle East & Africa Global Power Plant Uranium Market Revenue (Million), by North America 2024 & 2032
- Figure 49: Middle East & Africa Global Power Plant Uranium Market Revenue Share (%), by North America 2024 & 2032
- Figure 50: Middle East & Africa Global Power Plant Uranium Market Revenue (Million), by Asia-Pacific 2024 & 2032
- Figure 51: Middle East & Africa Global Power Plant Uranium Market Revenue Share (%), by Asia-Pacific 2024 & 2032
- Figure 52: Middle East & Africa Global Power Plant Uranium Market Revenue (Million), by Europe 2024 & 2032
- Figure 53: Middle East & Africa Global Power Plant Uranium Market Revenue Share (%), by Europe 2024 & 2032
- Figure 54: Middle East & Africa Global Power Plant Uranium Market Revenue (Million), by Middle-East and Africa 2024 & 2032
- Figure 55: Middle East & Africa Global Power Plant Uranium Market Revenue Share (%), by Middle-East and Africa 2024 & 2032
- Figure 56: Middle East & Africa Global Power Plant Uranium Market Revenue (Million), by South America 2024 & 2032
- Figure 57: Middle East & Africa Global Power Plant Uranium Market Revenue Share (%), by South America 2024 & 2032
- Figure 58: Middle East & Africa Global Power Plant Uranium Market Revenue (Million), by Country 2024 & 2032
- Figure 59: Middle East & Africa Global Power Plant Uranium Market Revenue Share (%), by Country 2024 & 2032
- Figure 60: Asia Pacific Global Power Plant Uranium Market Revenue (Million), by North America 2024 & 2032
- Figure 61: Asia Pacific Global Power Plant Uranium Market Revenue Share (%), by North America 2024 & 2032
- Figure 62: Asia Pacific Global Power Plant Uranium Market Revenue (Million), by Asia-Pacific 2024 & 2032
- Figure 63: Asia Pacific Global Power Plant Uranium Market Revenue Share (%), by Asia-Pacific 2024 & 2032
- Figure 64: Asia Pacific Global Power Plant Uranium Market Revenue (Million), by Europe 2024 & 2032
- Figure 65: Asia Pacific Global Power Plant Uranium Market Revenue Share (%), by Europe 2024 & 2032
- Figure 66: Asia Pacific Global Power Plant Uranium Market Revenue (Million), by Middle-East and Africa 2024 & 2032
- Figure 67: Asia Pacific Global Power Plant Uranium Market Revenue Share (%), by Middle-East and Africa 2024 & 2032
- Figure 68: Asia Pacific Global Power Plant Uranium Market Revenue (Million), by South America 2024 & 2032
- Figure 69: Asia Pacific Global Power Plant Uranium Market Revenue Share (%), by South America 2024 & 2032
- Figure 70: Asia Pacific Global Power Plant Uranium Market Revenue (Million), by Country 2024 & 2032
- Figure 71: Asia Pacific Global Power Plant Uranium Market Revenue Share (%), by Country 2024 & 2032
List of Tables
- Table 1: Global Power Plant Uranium Market Revenue Million Forecast, by Region 2019 & 2032
- Table 2: Global Power Plant Uranium Market Revenue Million Forecast, by North America 2019 & 2032
- Table 3: Global Power Plant Uranium Market Revenue Million Forecast, by Asia-Pacific 2019 & 2032
- Table 4: Global Power Plant Uranium Market Revenue Million Forecast, by Europe 2019 & 2032
- Table 5: Global Power Plant Uranium Market Revenue Million Forecast, by Middle-East and Africa 2019 & 2032
- Table 6: Global Power Plant Uranium Market Revenue Million Forecast, by South America 2019 & 2032
- Table 7: Global Power Plant Uranium Market Revenue Million Forecast, by Region 2019 & 2032
- Table 8: Global Power Plant Uranium Market Revenue Million Forecast, by Country 2019 & 2032
- Table 9: United States Global Power Plant Uranium Market Revenue (Million) Forecast, by Application 2019 & 2032
- Table 10: Canada Global Power Plant Uranium Market Revenue (Million) Forecast, by Application 2019 & 2032
- Table 11: Mexico Global Power Plant Uranium Market Revenue (Million) Forecast, by Application 2019 & 2032
- Table 12: Global Power Plant Uranium Market Revenue Million Forecast, by Country 2019 & 2032
- Table 13: Germany Global Power Plant Uranium Market Revenue (Million) Forecast, by Application 2019 & 2032
- Table 14: United Kingdom Global Power Plant Uranium Market Revenue (Million) Forecast, by Application 2019 & 2032
- Table 15: France Global Power Plant Uranium Market Revenue (Million) Forecast, by Application 2019 & 2032
- Table 16: Spain Global Power Plant Uranium Market Revenue (Million) Forecast, by Application 2019 & 2032
- Table 17: Italy Global Power Plant Uranium Market Revenue (Million) Forecast, by Application 2019 & 2032
- Table 18: Spain Global Power Plant Uranium Market Revenue (Million) Forecast, by Application 2019 & 2032
- Table 19: Belgium Global Power Plant Uranium Market Revenue (Million) Forecast, by Application 2019 & 2032
- Table 20: Netherland Global Power Plant Uranium Market Revenue (Million) Forecast, by Application 2019 & 2032
- Table 21: Nordics Global Power Plant Uranium Market Revenue (Million) Forecast, by Application 2019 & 2032
- Table 22: Rest of Europe Global Power Plant Uranium Market Revenue (Million) Forecast, by Application 2019 & 2032
- Table 23: Global Power Plant Uranium Market Revenue Million Forecast, by Country 2019 & 2032
- Table 24: China Global Power Plant Uranium Market Revenue (Million) Forecast, by Application 2019 & 2032
- Table 25: Japan Global Power Plant Uranium Market Revenue (Million) Forecast, by Application 2019 & 2032
- Table 26: India Global Power Plant Uranium Market Revenue (Million) Forecast, by Application 2019 & 2032
- Table 27: South Korea Global Power Plant Uranium Market Revenue (Million) Forecast, by Application 2019 & 2032
- Table 28: Southeast Asia Global Power Plant Uranium Market Revenue (Million) Forecast, by Application 2019 & 2032
- Table 29: Australia Global Power Plant Uranium Market Revenue (Million) Forecast, by Application 2019 & 2032
- Table 30: Indonesia Global Power Plant Uranium Market Revenue (Million) Forecast, by Application 2019 & 2032
- Table 31: Phillipes Global Power Plant Uranium Market Revenue (Million) Forecast, by Application 2019 & 2032
- Table 32: Singapore Global Power Plant Uranium Market Revenue (Million) Forecast, by Application 2019 & 2032
- Table 33: Thailandc Global Power Plant Uranium Market Revenue (Million) Forecast, by Application 2019 & 2032
- Table 34: Rest of Asia Pacific Global Power Plant Uranium Market Revenue (Million) Forecast, by Application 2019 & 2032
- Table 35: Global Power Plant Uranium Market Revenue Million Forecast, by Country 2019 & 2032
- Table 36: Brazil Global Power Plant Uranium Market Revenue (Million) Forecast, by Application 2019 & 2032
- Table 37: Argentina Global Power Plant Uranium Market Revenue (Million) Forecast, by Application 2019 & 2032
- Table 38: Peru Global Power Plant Uranium Market Revenue (Million) Forecast, by Application 2019 & 2032
- Table 39: Chile Global Power Plant Uranium Market Revenue (Million) Forecast, by Application 2019 & 2032
- Table 40: Colombia Global Power Plant Uranium Market Revenue (Million) Forecast, by Application 2019 & 2032
- Table 41: Ecuador Global Power Plant Uranium Market Revenue (Million) Forecast, by Application 2019 & 2032
- Table 42: Venezuela Global Power Plant Uranium Market Revenue (Million) Forecast, by Application 2019 & 2032
- Table 43: Rest of South America Global Power Plant Uranium Market Revenue (Million) Forecast, by Application 2019 & 2032
- Table 44: Global Power Plant Uranium Market Revenue Million Forecast, by Country 2019 & 2032
- Table 45: United Arab Emirates Global Power Plant Uranium Market Revenue (Million) Forecast, by Application 2019 & 2032
- Table 46: Saudi Arabia Global Power Plant Uranium Market Revenue (Million) Forecast, by Application 2019 & 2032
- Table 47: South Africa Global Power Plant Uranium Market Revenue (Million) Forecast, by Application 2019 & 2032
- Table 48: Rest of Middle East and Africa Global Power Plant Uranium Market Revenue (Million) Forecast, by Application 2019 & 2032
- Table 49: Global Power Plant Uranium Market Revenue Million Forecast, by North America 2019 & 2032
- Table 50: Global Power Plant Uranium Market Revenue Million Forecast, by Asia-Pacific 2019 & 2032
- Table 51: Global Power Plant Uranium Market Revenue Million Forecast, by Europe 2019 & 2032
- Table 52: Global Power Plant Uranium Market Revenue Million Forecast, by Middle-East and Africa 2019 & 2032
- Table 53: Global Power Plant Uranium Market Revenue Million Forecast, by South America 2019 & 2032
- Table 54: Global Power Plant Uranium Market Revenue Million Forecast, by Country 2019 & 2032
- Table 55: United States Global Power Plant Uranium Market Revenue (Million) Forecast, by Application 2019 & 2032
- Table 56: Canada Global Power Plant Uranium Market Revenue (Million) Forecast, by Application 2019 & 2032
- Table 57: Mexico Global Power Plant Uranium Market Revenue (Million) Forecast, by Application 2019 & 2032
- Table 58: Global Power Plant Uranium Market Revenue Million Forecast, by North America 2019 & 2032
- Table 59: Global Power Plant Uranium Market Revenue Million Forecast, by Asia-Pacific 2019 & 2032
- Table 60: Global Power Plant Uranium Market Revenue Million Forecast, by Europe 2019 & 2032
- Table 61: Global Power Plant Uranium Market Revenue Million Forecast, by Middle-East and Africa 2019 & 2032
- Table 62: Global Power Plant Uranium Market Revenue Million Forecast, by South America 2019 & 2032
- Table 63: Global Power Plant Uranium Market Revenue Million Forecast, by Country 2019 & 2032
- Table 64: Brazil Global Power Plant Uranium Market Revenue (Million) Forecast, by Application 2019 & 2032
- Table 65: Argentina Global Power Plant Uranium Market Revenue (Million) Forecast, by Application 2019 & 2032
- Table 66: Rest of South America Global Power Plant Uranium Market Revenue (Million) Forecast, by Application 2019 & 2032
- Table 67: Global Power Plant Uranium Market Revenue Million Forecast, by North America 2019 & 2032
- Table 68: Global Power Plant Uranium Market Revenue Million Forecast, by Asia-Pacific 2019 & 2032
- Table 69: Global Power Plant Uranium Market Revenue Million Forecast, by Europe 2019 & 2032
- Table 70: Global Power Plant Uranium Market Revenue Million Forecast, by Middle-East and Africa 2019 & 2032
- Table 71: Global Power Plant Uranium Market Revenue Million Forecast, by South America 2019 & 2032
- Table 72: Global Power Plant Uranium Market Revenue Million Forecast, by Country 2019 & 2032
- Table 73: United Kingdom Global Power Plant Uranium Market Revenue (Million) Forecast, by Application 2019 & 2032
- Table 74: Germany Global Power Plant Uranium Market Revenue (Million) Forecast, by Application 2019 & 2032
- Table 75: France Global Power Plant Uranium Market Revenue (Million) Forecast, by Application 2019 & 2032
- Table 76: Italy Global Power Plant Uranium Market Revenue (Million) Forecast, by Application 2019 & 2032
- Table 77: Spain Global Power Plant Uranium Market Revenue (Million) Forecast, by Application 2019 & 2032
- Table 78: Russia Global Power Plant Uranium Market Revenue (Million) Forecast, by Application 2019 & 2032
- Table 79: Benelux Global Power Plant Uranium Market Revenue (Million) Forecast, by Application 2019 & 2032
- Table 80: Nordics Global Power Plant Uranium Market Revenue (Million) Forecast, by Application 2019 & 2032
- Table 81: Rest of Europe Global Power Plant Uranium Market Revenue (Million) Forecast, by Application 2019 & 2032
- Table 82: Global Power Plant Uranium Market Revenue Million Forecast, by North America 2019 & 2032
- Table 83: Global Power Plant Uranium Market Revenue Million Forecast, by Asia-Pacific 2019 & 2032
- Table 84: Global Power Plant Uranium Market Revenue Million Forecast, by Europe 2019 & 2032
- Table 85: Global Power Plant Uranium Market Revenue Million Forecast, by Middle-East and Africa 2019 & 2032
- Table 86: Global Power Plant Uranium Market Revenue Million Forecast, by South America 2019 & 2032
- Table 87: Global Power Plant Uranium Market Revenue Million Forecast, by Country 2019 & 2032
- Table 88: Turkey Global Power Plant Uranium Market Revenue (Million) Forecast, by Application 2019 & 2032
- Table 89: Israel Global Power Plant Uranium Market Revenue (Million) Forecast, by Application 2019 & 2032
- Table 90: GCC Global Power Plant Uranium Market Revenue (Million) Forecast, by Application 2019 & 2032
- Table 91: North Africa Global Power Plant Uranium Market Revenue (Million) Forecast, by Application 2019 & 2032
- Table 92: South Africa Global Power Plant Uranium Market Revenue (Million) Forecast, by Application 2019 & 2032
- Table 93: Rest of Middle East & Africa Global Power Plant Uranium Market Revenue (Million) Forecast, by Application 2019 & 2032
- Table 94: Global Power Plant Uranium Market Revenue Million Forecast, by North America 2019 & 2032
- Table 95: Global Power Plant Uranium Market Revenue Million Forecast, by Asia-Pacific 2019 & 2032
- Table 96: Global Power Plant Uranium Market Revenue Million Forecast, by Europe 2019 & 2032
- Table 97: Global Power Plant Uranium Market Revenue Million Forecast, by Middle-East and Africa 2019 & 2032
- Table 98: Global Power Plant Uranium Market Revenue Million Forecast, by South America 2019 & 2032
- Table 99: Global Power Plant Uranium Market Revenue Million Forecast, by Country 2019 & 2032
- Table 100: China Global Power Plant Uranium Market Revenue (Million) Forecast, by Application 2019 & 2032
- Table 101: India Global Power Plant Uranium Market Revenue (Million) Forecast, by Application 2019 & 2032
- Table 102: Japan Global Power Plant Uranium Market Revenue (Million) Forecast, by Application 2019 & 2032
- Table 103: South Korea Global Power Plant Uranium Market Revenue (Million) Forecast, by Application 2019 & 2032
- Table 104: ASEAN Global Power Plant Uranium Market Revenue (Million) Forecast, by Application 2019 & 2032
- Table 105: Oceania Global Power Plant Uranium Market Revenue (Million) Forecast, by Application 2019 & 2032
- Table 106: Rest of Asia Pacific Global Power Plant Uranium Market Revenue (Million) Forecast, by Application 2019 & 2032
Frequently Asked Questions
1. What is the projected Compound Annual Growth Rate (CAGR) of the Global Power Plant Uranium Market?
The projected CAGR is approximately < 1.20%.
2. Which companies are prominent players in the Global Power Plant Uranium Market?
Key companies in the market include General Atomics, Uranium One Inc, Navoi Mining and Metallurgy Combinat, China National Nuclear Corporation, Orano SA, China General Nuclear Power Group (CGN), ARMZ Uranium Holding Co, Cameco Corporation, NAC Kazatomprom JSC, BHP Group Ltd.
3. What are the main segments of the Global Power Plant Uranium Market?
The market segments include North America, Asia-Pacific, Europe, Middle-East and Africa, South America.
4. Can you provide details about the market size?
The market size is estimated to be USD XX Million as of 2022.
5. What are some drivers contributing to market growth?
4.; Increasing Amount of Waste Generation. Growing Concern for Waste Management to Meet the Needs for Sustainable Urban Living4.; Increasing Focus on Non-fossil Fuel Sources of Energy.
6. What are the notable trends driving market growth?
Renewable Energy Likely to Restraint the Market Growth.
7. Are there any restraints impacting market growth?
4.; Expensive Nature of Incinerators.
8. Can you provide examples of recent developments in the market?
In March 2022, India announced to import nearly 100 tonnes of natural uranium and 133 units of fuel assemblies in the FY 2022-23. The uranium is likely to be imported from Canada, Kazakhstan, Russia, and Uzbekistan.
9. What pricing options are available for accessing the report?
Pricing options include single-user, multi-user, and enterprise licenses priced at USD 4750, USD 5250, and USD 8750 respectively.
10. Is the market size provided in terms of value or volume?
The market size is provided in terms of value, measured in Million.
11. Are there any specific market keywords associated with the report?
Yes, the market keyword associated with the report is "Global Power Plant Uranium Market," which aids in identifying and referencing the specific market segment covered.
12. How do I determine which pricing option suits my needs best?
The pricing options vary based on user requirements and access needs. Individual users may opt for single-user licenses, while businesses requiring broader access may choose multi-user or enterprise licenses for cost-effective access to the report.
13. Are there any additional resources or data provided in the Global Power Plant Uranium Market report?
While the report offers comprehensive insights, it's advisable to review the specific contents or supplementary materials provided to ascertain if additional resources or data are available.
14. How can I stay updated on further developments or reports in the Global Power Plant Uranium Market?
To stay informed about further developments, trends, and reports in the Global Power Plant Uranium Market, consider subscribing to industry newsletters, following relevant companies and organizations, or regularly checking reputable industry news sources and publications.
Methodology
Step 1 - Identification of Relevant Samples Size from Population Database


Step 2 - Approaches for Defining Global Market Size (Value, Volume* & Price*)

Note*: In applicable scenarios
Step 3 - Data Sources
Primary Research
- Web Analytics
- Survey Reports
- Research Institute
- Latest Research Reports
- Opinion Leaders
Secondary Research
- Annual Reports
- White Paper
- Latest Press Release
- Industry Association
- Paid Database
- Investor Presentations

Step 4 - Data Triangulation
Involves using different sources of information in order to increase the validity of a study
These sources are likely to be stakeholders in a program - participants, other researchers, program staff, other community members, and so on.
Then we put all data in single framework & apply various statistical tools to find out the dynamic on the market.
During the analysis stage, feedback from the stakeholder groups would be compared to determine areas of agreement as well as areas of divergence


