
Key Insights
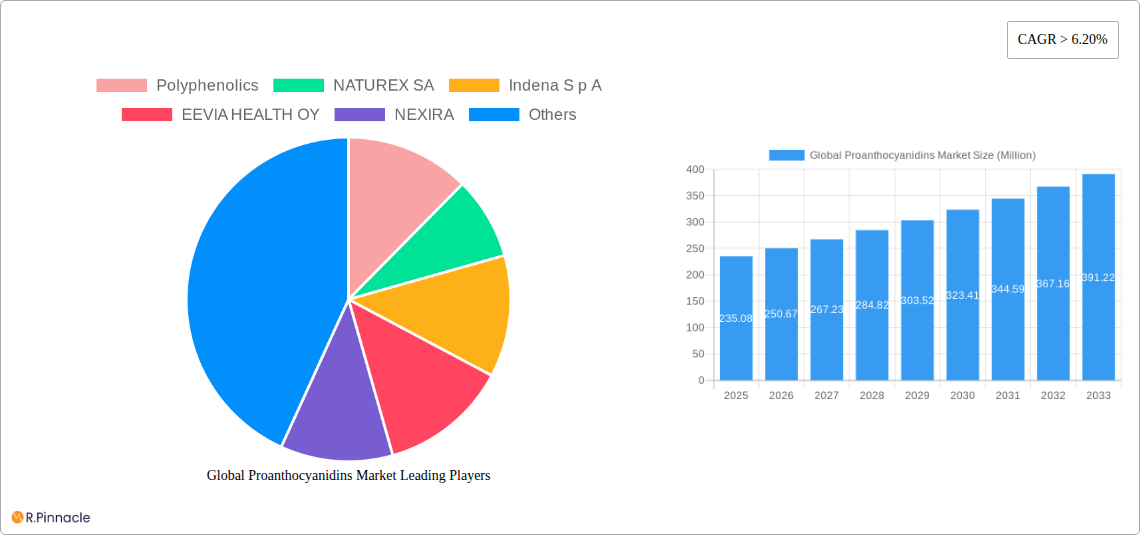
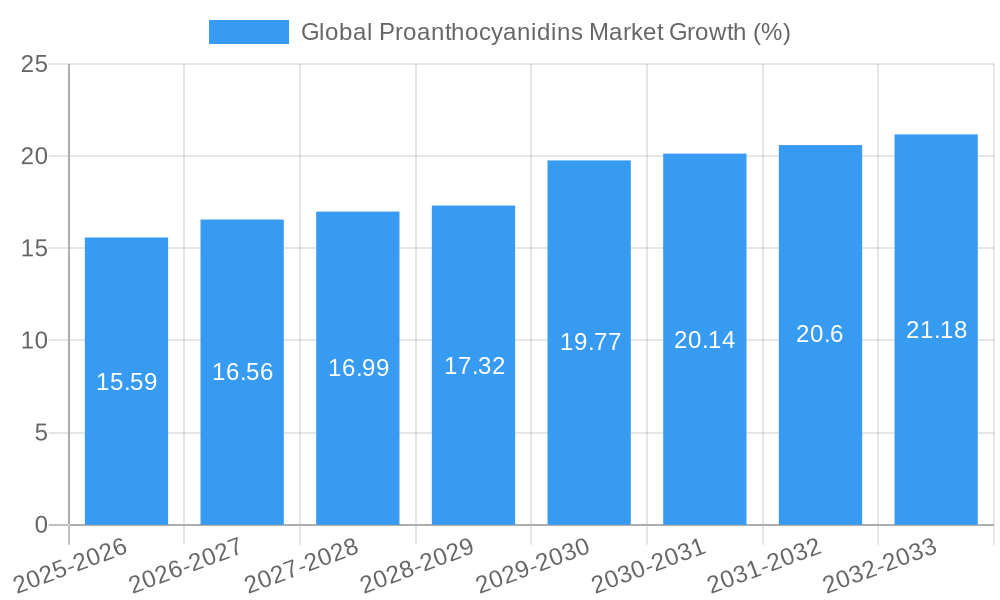
The global proanthocyanidins market is experiencing robust growth, projected to reach \$235.08 million in 2025 and maintain a Compound Annual Growth Rate (CAGR) exceeding 6.20% from 2025 to 2033. This expansion is fueled by the increasing demand for natural antioxidants in the food and beverage, dietary supplement, pharmaceutical, and personal care industries. Consumer awareness of the health benefits associated with proanthocyanidins, such as their potent antioxidant and anti-inflammatory properties, is a key driver. The growing prevalence of chronic diseases further boosts market demand, as proanthocyanidins are being increasingly explored for their potential in preventing and managing various health conditions. The market is segmented by source (cranberry, grape seed, and others) and application, with the food and beverage sector currently dominating due to the widespread use of proanthocyanidins as natural colorants and preservatives. However, the dietary supplements and pharmaceutical segments are poised for significant growth driven by the increasing popularity of functional foods and nutraceuticals. While supply chain challenges and price fluctuations in raw materials might pose some restraints, the overall market outlook remains positive, driven by innovation in extraction technologies and the development of new proanthocyanidin-based products.
The competitive landscape is characterized by a mix of established players and emerging companies, with both large multinational corporations and smaller specialized firms vying for market share. Companies like Polyphenolics, Naturex SA, Indena S.p.A., and others are actively involved in research and development to enhance the quality, efficacy, and applications of proanthocyanidins. Geographic expansion, particularly in developing economies with rising disposable incomes and health consciousness, presents significant opportunities. North America and Europe currently hold substantial market shares, but Asia-Pacific is expected to witness faster growth in the coming years owing to increasing health awareness and changing dietary habits. Strategic partnerships, mergers and acquisitions, and product diversification strategies will likely shape the future competitive dynamics within this burgeoning market.
Global Proanthocyanidins Market Report: A Comprehensive Analysis (2019-2033)
This comprehensive report provides an in-depth analysis of the global proanthocyanidins market, offering valuable insights for industry professionals, investors, and stakeholders. Covering the period from 2019 to 2033, with a focus on 2025 (base and estimated year), this report meticulously examines market dynamics, key players, and future growth prospects. The market is projected to reach xx Million by 2033, exhibiting a CAGR of xx% during the forecast period (2025-2033).
Global Proanthocyanidins Market Market Structure & Innovation Trends
This section analyzes the competitive landscape of the global proanthocyanidins market, encompassing market concentration, innovation drivers, regulatory frameworks, and M&A activities. The market exhibits a moderately concentrated structure, with key players like Polyphenolics, NATUREX SA, Indena S p A, EEVIA HEALTH OY, NEXIRA, and Xian Yuensun Biological Technology Co Ltd holding significant market share. However, several smaller players and emerging companies are also contributing to market growth.
- Market Concentration: The Herfindahl-Hirschman Index (HHI) is estimated at xx, indicating a moderately concentrated market.
- Innovation Drivers: Ongoing research into the health benefits of proanthocyanidins, coupled with the development of new extraction and purification technologies, are key innovation drivers.
- Regulatory Framework: Varying regulatory landscapes across different regions impact market growth. Compliance with food safety and labeling regulations is crucial.
- Product Substitutes: Other antioxidant-rich ingredients pose some competitive pressure.
- End-User Demographics: Growing health-conscious consumer base fuels demand for proanthocyanidin-rich products.
- M&A Activities: Strategic mergers and acquisitions are expected to increase market consolidation in the coming years. The total value of M&A deals in the last 5 years is estimated at xx Million.
Global Proanthocyanidins Market Market Dynamics & Trends
The global proanthocyanidins market is experiencing robust growth, driven by several factors. Increasing consumer awareness regarding the health benefits of antioxidants, coupled with the rising demand for natural and functional ingredients in food, beverages, and dietary supplements, is a major contributing factor. Technological advancements in extraction and purification methods are also enhancing the quality and availability of proanthocyanidins. The increasing prevalence of chronic diseases is further driving demand for products with antioxidant properties. However, price fluctuations in raw materials and supply chain disruptions can pose challenges to market growth. Competitive dynamics are characterized by both established players and new entrants, leading to innovation and diversification of product offerings. The market is expected to witness a significant expansion, driven by the growing demand for natural health solutions and functional foods. The CAGR during the forecast period is expected to remain significant, reflecting the market's robust growth trajectory. Market penetration is increasing steadily across different segments and regions.
Dominant Regions & Segments in Global Proanthocyanidins Market
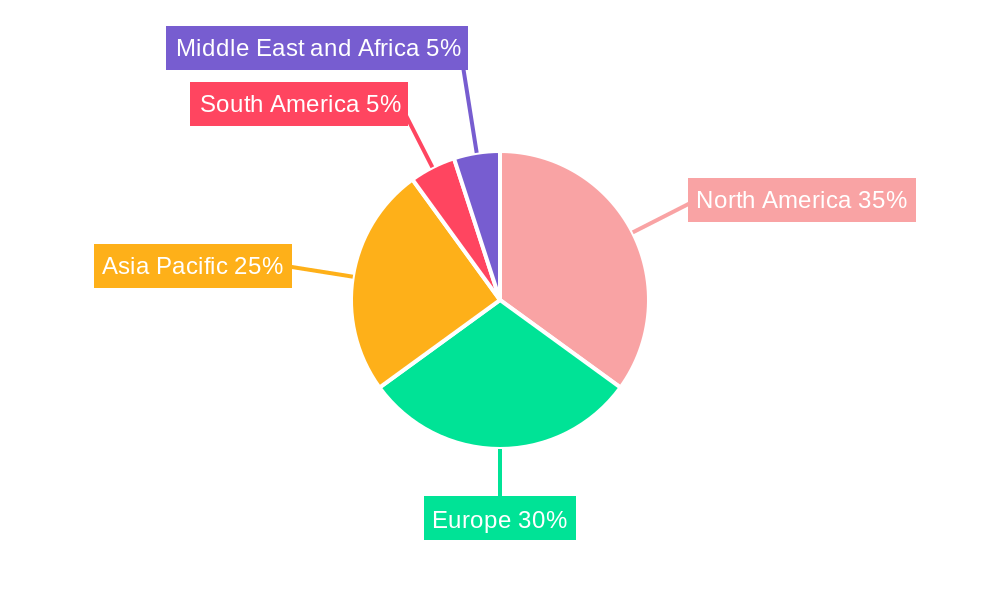
The North American and European regions currently dominate the global proanthocyanidins market, driven by high consumer awareness of health and wellness, robust regulatory frameworks, and a well-established market infrastructure. However, Asia-Pacific is experiencing rapid growth due to increasing disposable incomes and rising health consciousness.
By Source:
- Cranberry: High demand for cranberry-based proanthocyanidins due to their established health benefits.
- Grape Seed: Grape seed extract is a significant source, benefiting from established extraction technologies and extensive research.
- Others: Other sources are emerging, driven by research into novel proanthocyanidin sources.
By Application:
- Food & Beverage: Proanthocyanidins are widely used as natural food colorants and antioxidants.
- Dietary Supplements: Significant demand for proanthocyanidin supplements due to perceived health benefits.
- Pharmaceuticals: Growing applications in pharmaceuticals as an active ingredient or excipient.
- Personal Care & Cosmetics: Use in skincare and cosmetic products for their antioxidant and anti-aging properties.
Key Drivers (Regional):
- North America: Strong consumer demand for health and wellness products, well-established distribution networks.
- Europe: High adoption rates in food and beverage applications, stringent quality and safety regulations.
- Asia-Pacific: Rapidly growing middle class, increasing disposable income, rising health consciousness.
Global Proanthocyanidins Market Product Innovations
Recent product innovations include the development of novel extraction methods for higher purity and yield, resulting in improved efficacy and cost-effectiveness. The focus is on enhancing product stability and bioavailability. New formulations are emerging, targeting specific health benefits and consumer preferences. This includes incorporating proanthocyanidins into functional foods and beverages with enhanced taste and appeal.
Report Scope & Segmentation Analysis
This report offers a comprehensive segmentation analysis of the global proanthocyanidins market based on source (cranberry, grape seed, others) and application (food & beverage, dietary supplements, pharmaceuticals, personal care & cosmetics). Each segment is analyzed in terms of growth projections, market size, and competitive dynamics. The market is expected to grow significantly across all segments due to increasing health awareness and changing consumer preferences. Competitive dynamics vary across segments, with some exhibiting high concentration while others are more fragmented.
Key Drivers of Global Proanthocyanidins Market Growth
The market's growth is driven by several factors, including the growing awareness of the health benefits of proanthocyanidins, particularly their antioxidant properties. Increased demand for natural and functional foods and supplements is another key driver. Technological advancements in extraction and purification techniques have improved product quality and availability, further stimulating market expansion.
Challenges in the Global Proanthocyanidins Market Sector
Challenges include the variability in the quality and purity of proanthocyanidins from different sources, requiring stringent quality control measures. Fluctuations in raw material prices can impact profitability. Stringent regulations surrounding food additives and supplements pose another challenge. Competitive pressure from substitute products also affects market growth. Furthermore, supply chain complexities, especially regarding sourcing and logistics, pose additional hurdles to market expansion.
Emerging Opportunities in Global Proanthocyanidins Market
Emerging opportunities include expanding into new markets, particularly in developing economies, where the demand for affordable, high-quality health products is growing. Innovations in product delivery and formulation, such as nano-encapsulation or liposomal delivery systems, can enhance bioavailability and efficacy. Utilizing proanthocyanidins in novel applications, such as cosmetics and pharmaceuticals, presents significant growth prospects. Capitalizing on personalized nutrition trends, by tailoring proanthocyanidin products to specific health needs and dietary preferences, also offers significant potential.
Leading Players in the Global Proanthocyanidins Market Market
- Polyphenolics
- NATUREX SA (NATUREX SA)
- Indena S p A (Indena S p A)
- EEVIA HEALTH OY (EEVIA HEALTH OY)
- NEXIRA (NEXIRA)
- Xian Yuensun Biological Technology Co Ltd
- Botaniex Inc
- Artemis International
- Ginkgo BioWorks
- Natural Remedies
Key Developments in Global Proanthocyanidins Market Industry
- 2023: Launch of a new proanthocyanidin-rich supplement by a major player.
- 2022: Strategic partnership between two leading companies to expand market reach.
- 2021: Significant investment in research to explore the health benefits of proanthocyanidins for specific conditions.
Future Outlook for Global Proanthocyanidins Market Market
The future of the global proanthocyanidins market appears promising. Continued investment in research and development, coupled with the increasing consumer demand for natural health solutions, will drive significant growth. The development of innovative formulations and product applications will further expand market opportunities. Strategic partnerships and acquisitions are anticipated, further consolidating the market and fostering innovation. The market is poised for significant expansion, fueled by a growing health-conscious population and ongoing advancements in technology and product development.
Global Proanthocyanidins Market Segmentation
-
1. Source
- 1.1. Cranberry
- 1.2. Grape Seed
- 1.3. Others
-
2. Application
- 2.1. Food & Beverage
- 2.2. Dietary Supplements
- 2.3. Pharmaceuticals
- 2.4. Personal care & cosmetics
Global Proanthocyanidins Market Segmentation By Geography
-
1. North America
- 1.1. United States
- 1.2. Canada
- 1.3. Mexico
- 1.4. Rest of North America
-
2. Europe
- 2.1. Spain
- 2.2. United Kingdom
- 2.3. Germany
- 2.4. France
- 2.5. Italy
- 2.6. Russia
- 2.7. Rest of Europe
-
3. Asia Pacific
- 3.1. China
- 3.2. Japan
- 3.3. India
- 3.4. Australia
- 3.5. Rest of Asia Pacific
-
4. South America
- 4.1. Brazil
- 4.2. Argentina
- 4.3. Rest of South America
-
5. Middle East and Africa
- 5.1. South Africa
- 5.2. Saudi Arabia
- 5.3. Rest of Middle East and Africa
Global Proanthocyanidins Market REPORT HIGHLIGHTS
| Aspects | Details |
|---|---|
| Study Period | 2019-2033 |
| Base Year | 2024 |
| Estimated Year | 2025 |
| Forecast Period | 2025-2033 |
| Historical Period | 2019-2024 |
| Growth Rate | CAGR of > 6.20% from 2019-2033 |
| Segmentation |
|
Table of Contents
- 1. Introduction
- 1.1. Research Scope
- 1.2. Market Segmentation
- 1.3. Research Methodology
- 1.4. Definitions and Assumptions
- 2. Executive Summary
- 2.1. Introduction
- 3. Market Dynamics
- 3.1. Introduction
- 3.2. Market Drivers
- 3.2.1. Increasing awareness towards fitness among consumers; Demand for convenient fortified foods
- 3.3. Market Restrains
- 3.3.1. Increasing vegan culture in the market
- 3.4. Market Trends
- 3.4.1. Surge in Demand for Dietary Supplements Derived from Natural Extracts
- 4. Market Factor Analysis
- 4.1. Porters Five Forces
- 4.2. Supply/Value Chain
- 4.3. PESTEL analysis
- 4.4. Market Entropy
- 4.5. Patent/Trademark Analysis
- 5. Global Proanthocyanidins Market Analysis, Insights and Forecast, 2019-2031
- 5.1. Market Analysis, Insights and Forecast - by Source
- 5.1.1. Cranberry
- 5.1.2. Grape Seed
- 5.1.3. Others
- 5.2. Market Analysis, Insights and Forecast - by Application
- 5.2.1. Food & Beverage
- 5.2.2. Dietary Supplements
- 5.2.3. Pharmaceuticals
- 5.2.4. Personal care & cosmetics
- 5.3. Market Analysis, Insights and Forecast - by Region
- 5.3.1. North America
- 5.3.2. Europe
- 5.3.3. Asia Pacific
- 5.3.4. South America
- 5.3.5. Middle East and Africa
- 5.1. Market Analysis, Insights and Forecast - by Source
- 6. North America Global Proanthocyanidins Market Analysis, Insights and Forecast, 2019-2031
- 6.1. Market Analysis, Insights and Forecast - by Source
- 6.1.1. Cranberry
- 6.1.2. Grape Seed
- 6.1.3. Others
- 6.2. Market Analysis, Insights and Forecast - by Application
- 6.2.1. Food & Beverage
- 6.2.2. Dietary Supplements
- 6.2.3. Pharmaceuticals
- 6.2.4. Personal care & cosmetics
- 6.1. Market Analysis, Insights and Forecast - by Source
- 7. Europe Global Proanthocyanidins Market Analysis, Insights and Forecast, 2019-2031
- 7.1. Market Analysis, Insights and Forecast - by Source
- 7.1.1. Cranberry
- 7.1.2. Grape Seed
- 7.1.3. Others
- 7.2. Market Analysis, Insights and Forecast - by Application
- 7.2.1. Food & Beverage
- 7.2.2. Dietary Supplements
- 7.2.3. Pharmaceuticals
- 7.2.4. Personal care & cosmetics
- 7.1. Market Analysis, Insights and Forecast - by Source
- 8. Asia Pacific Global Proanthocyanidins Market Analysis, Insights and Forecast, 2019-2031
- 8.1. Market Analysis, Insights and Forecast - by Source
- 8.1.1. Cranberry
- 8.1.2. Grape Seed
- 8.1.3. Others
- 8.2. Market Analysis, Insights and Forecast - by Application
- 8.2.1. Food & Beverage
- 8.2.2. Dietary Supplements
- 8.2.3. Pharmaceuticals
- 8.2.4. Personal care & cosmetics
- 8.1. Market Analysis, Insights and Forecast - by Source
- 9. South America Global Proanthocyanidins Market Analysis, Insights and Forecast, 2019-2031
- 9.1. Market Analysis, Insights and Forecast - by Source
- 9.1.1. Cranberry
- 9.1.2. Grape Seed
- 9.1.3. Others
- 9.2. Market Analysis, Insights and Forecast - by Application
- 9.2.1. Food & Beverage
- 9.2.2. Dietary Supplements
- 9.2.3. Pharmaceuticals
- 9.2.4. Personal care & cosmetics
- 9.1. Market Analysis, Insights and Forecast - by Source
- 10. Middle East and Africa Global Proanthocyanidins Market Analysis, Insights and Forecast, 2019-2031
- 10.1. Market Analysis, Insights and Forecast - by Source
- 10.1.1. Cranberry
- 10.1.2. Grape Seed
- 10.1.3. Others
- 10.2. Market Analysis, Insights and Forecast - by Application
- 10.2.1. Food & Beverage
- 10.2.2. Dietary Supplements
- 10.2.3. Pharmaceuticals
- 10.2.4. Personal care & cosmetics
- 10.1. Market Analysis, Insights and Forecast - by Source
- 11. North America Global Proanthocyanidins Market Analysis, Insights and Forecast, 2019-2031
- 11.1. Market Analysis, Insights and Forecast - By Country/Sub-region
- 11.1.1 United States
- 11.1.2 Canada
- 11.1.3 Mexico
- 11.1.4 Rest of North America
- 12. Europe Global Proanthocyanidins Market Analysis, Insights and Forecast, 2019-2031
- 12.1. Market Analysis, Insights and Forecast - By Country/Sub-region
- 12.1.1 Spain
- 12.1.2 United Kingdom
- 12.1.3 Germany
- 12.1.4 France
- 12.1.5 Italy
- 12.1.6 Russia
- 12.1.7 Rest of Europe
- 13. Asia Pacific Global Proanthocyanidins Market Analysis, Insights and Forecast, 2019-2031
- 13.1. Market Analysis, Insights and Forecast - By Country/Sub-region
- 13.1.1 China
- 13.1.2 Japan
- 13.1.3 India
- 13.1.4 Australia
- 13.1.5 Rest of Asia Pacific
- 14. South America Global Proanthocyanidins Market Analysis, Insights and Forecast, 2019-2031
- 14.1. Market Analysis, Insights and Forecast - By Country/Sub-region
- 14.1.1 Brazil
- 14.1.2 Argentina
- 14.1.3 Rest of South America
- 15. Middle East and Africa Global Proanthocyanidins Market Analysis, Insights and Forecast, 2019-2031
- 15.1. Market Analysis, Insights and Forecast - By Country/Sub-region
- 15.1.1 South Africa
- 15.1.2 Saudi Arabia
- 15.1.3 Rest of Middle East and Africa
- 16. Competitive Analysis
- 16.1. Market Share Analysis 2024
- 16.2. Company Profiles
- 16.2.1 Polyphenolics
- 16.2.1.1. Overview
- 16.2.1.2. Products
- 16.2.1.3. SWOT Analysis
- 16.2.1.4. Recent Developments
- 16.2.1.5. Financials (Based on Availability)
- 16.2.2 NATUREX SA
- 16.2.2.1. Overview
- 16.2.2.2. Products
- 16.2.2.3. SWOT Analysis
- 16.2.2.4. Recent Developments
- 16.2.2.5. Financials (Based on Availability)
- 16.2.3 Indena S p A
- 16.2.3.1. Overview
- 16.2.3.2. Products
- 16.2.3.3. SWOT Analysis
- 16.2.3.4. Recent Developments
- 16.2.3.5. Financials (Based on Availability)
- 16.2.4 EEVIA HEALTH OY
- 16.2.4.1. Overview
- 16.2.4.2. Products
- 16.2.4.3. SWOT Analysis
- 16.2.4.4. Recent Developments
- 16.2.4.5. Financials (Based on Availability)
- 16.2.5 NEXIRA
- 16.2.5.1. Overview
- 16.2.5.2. Products
- 16.2.5.3. SWOT Analysis
- 16.2.5.4. Recent Developments
- 16.2.5.5. Financials (Based on Availability)
- 16.2.6 Xian Yuensun Biological Technology Co Ltd *List Not Exhaustive
- 16.2.6.1. Overview
- 16.2.6.2. Products
- 16.2.6.3. SWOT Analysis
- 16.2.6.4. Recent Developments
- 16.2.6.5. Financials (Based on Availability)
- 16.2.7 Botaniex Inc
- 16.2.7.1. Overview
- 16.2.7.2. Products
- 16.2.7.3. SWOT Analysis
- 16.2.7.4. Recent Developments
- 16.2.7.5. Financials (Based on Availability)
- 16.2.8 Artemis International
- 16.2.8.1. Overview
- 16.2.8.2. Products
- 16.2.8.3. SWOT Analysis
- 16.2.8.4. Recent Developments
- 16.2.8.5. Financials (Based on Availability)
- 16.2.9 Ginkgo BioWorks
- 16.2.9.1. Overview
- 16.2.9.2. Products
- 16.2.9.3. SWOT Analysis
- 16.2.9.4. Recent Developments
- 16.2.9.5. Financials (Based on Availability)
- 16.2.10 Natural Remedies
- 16.2.10.1. Overview
- 16.2.10.2. Products
- 16.2.10.3. SWOT Analysis
- 16.2.10.4. Recent Developments
- 16.2.10.5. Financials (Based on Availability)
- 16.2.1 Polyphenolics
List of Figures
- Figure 1: Global Global Proanthocyanidins Market Revenue Breakdown (Million, %) by Region 2024 & 2032
- Figure 2: Global Global Proanthocyanidins Market Volume Breakdown (K Tons, %) by Region 2024 & 2032
- Figure 3: North America Global Proanthocyanidins Market Revenue (Million), by Country 2024 & 2032
- Figure 4: North America Global Proanthocyanidins Market Volume (K Tons), by Country 2024 & 2032
- Figure 5: North America Global Proanthocyanidins Market Revenue Share (%), by Country 2024 & 2032
- Figure 6: North America Global Proanthocyanidins Market Volume Share (%), by Country 2024 & 2032
- Figure 7: Europe Global Proanthocyanidins Market Revenue (Million), by Country 2024 & 2032
- Figure 8: Europe Global Proanthocyanidins Market Volume (K Tons), by Country 2024 & 2032
- Figure 9: Europe Global Proanthocyanidins Market Revenue Share (%), by Country 2024 & 2032
- Figure 10: Europe Global Proanthocyanidins Market Volume Share (%), by Country 2024 & 2032
- Figure 11: Asia Pacific Global Proanthocyanidins Market Revenue (Million), by Country 2024 & 2032
- Figure 12: Asia Pacific Global Proanthocyanidins Market Volume (K Tons), by Country 2024 & 2032
- Figure 13: Asia Pacific Global Proanthocyanidins Market Revenue Share (%), by Country 2024 & 2032
- Figure 14: Asia Pacific Global Proanthocyanidins Market Volume Share (%), by Country 2024 & 2032
- Figure 15: South America Global Proanthocyanidins Market Revenue (Million), by Country 2024 & 2032
- Figure 16: South America Global Proanthocyanidins Market Volume (K Tons), by Country 2024 & 2032
- Figure 17: South America Global Proanthocyanidins Market Revenue Share (%), by Country 2024 & 2032
- Figure 18: South America Global Proanthocyanidins Market Volume Share (%), by Country 2024 & 2032
- Figure 19: Middle East and Africa Global Proanthocyanidins Market Revenue (Million), by Country 2024 & 2032
- Figure 20: Middle East and Africa Global Proanthocyanidins Market Volume (K Tons), by Country 2024 & 2032
- Figure 21: Middle East and Africa Global Proanthocyanidins Market Revenue Share (%), by Country 2024 & 2032
- Figure 22: Middle East and Africa Global Proanthocyanidins Market Volume Share (%), by Country 2024 & 2032
- Figure 23: North America Global Proanthocyanidins Market Revenue (Million), by Source 2024 & 2032
- Figure 24: North America Global Proanthocyanidins Market Volume (K Tons), by Source 2024 & 2032
- Figure 25: North America Global Proanthocyanidins Market Revenue Share (%), by Source 2024 & 2032
- Figure 26: North America Global Proanthocyanidins Market Volume Share (%), by Source 2024 & 2032
- Figure 27: North America Global Proanthocyanidins Market Revenue (Million), by Application 2024 & 2032
- Figure 28: North America Global Proanthocyanidins Market Volume (K Tons), by Application 2024 & 2032
- Figure 29: North America Global Proanthocyanidins Market Revenue Share (%), by Application 2024 & 2032
- Figure 30: North America Global Proanthocyanidins Market Volume Share (%), by Application 2024 & 2032
- Figure 31: North America Global Proanthocyanidins Market Revenue (Million), by Country 2024 & 2032
- Figure 32: North America Global Proanthocyanidins Market Volume (K Tons), by Country 2024 & 2032
- Figure 33: North America Global Proanthocyanidins Market Revenue Share (%), by Country 2024 & 2032
- Figure 34: North America Global Proanthocyanidins Market Volume Share (%), by Country 2024 & 2032
- Figure 35: Europe Global Proanthocyanidins Market Revenue (Million), by Source 2024 & 2032
- Figure 36: Europe Global Proanthocyanidins Market Volume (K Tons), by Source 2024 & 2032
- Figure 37: Europe Global Proanthocyanidins Market Revenue Share (%), by Source 2024 & 2032
- Figure 38: Europe Global Proanthocyanidins Market Volume Share (%), by Source 2024 & 2032
- Figure 39: Europe Global Proanthocyanidins Market Revenue (Million), by Application 2024 & 2032
- Figure 40: Europe Global Proanthocyanidins Market Volume (K Tons), by Application 2024 & 2032
- Figure 41: Europe Global Proanthocyanidins Market Revenue Share (%), by Application 2024 & 2032
- Figure 42: Europe Global Proanthocyanidins Market Volume Share (%), by Application 2024 & 2032
- Figure 43: Europe Global Proanthocyanidins Market Revenue (Million), by Country 2024 & 2032
- Figure 44: Europe Global Proanthocyanidins Market Volume (K Tons), by Country 2024 & 2032
- Figure 45: Europe Global Proanthocyanidins Market Revenue Share (%), by Country 2024 & 2032
- Figure 46: Europe Global Proanthocyanidins Market Volume Share (%), by Country 2024 & 2032
- Figure 47: Asia Pacific Global Proanthocyanidins Market Revenue (Million), by Source 2024 & 2032
- Figure 48: Asia Pacific Global Proanthocyanidins Market Volume (K Tons), by Source 2024 & 2032
- Figure 49: Asia Pacific Global Proanthocyanidins Market Revenue Share (%), by Source 2024 & 2032
- Figure 50: Asia Pacific Global Proanthocyanidins Market Volume Share (%), by Source 2024 & 2032
- Figure 51: Asia Pacific Global Proanthocyanidins Market Revenue (Million), by Application 2024 & 2032
- Figure 52: Asia Pacific Global Proanthocyanidins Market Volume (K Tons), by Application 2024 & 2032
- Figure 53: Asia Pacific Global Proanthocyanidins Market Revenue Share (%), by Application 2024 & 2032
- Figure 54: Asia Pacific Global Proanthocyanidins Market Volume Share (%), by Application 2024 & 2032
- Figure 55: Asia Pacific Global Proanthocyanidins Market Revenue (Million), by Country 2024 & 2032
- Figure 56: Asia Pacific Global Proanthocyanidins Market Volume (K Tons), by Country 2024 & 2032
- Figure 57: Asia Pacific Global Proanthocyanidins Market Revenue Share (%), by Country 2024 & 2032
- Figure 58: Asia Pacific Global Proanthocyanidins Market Volume Share (%), by Country 2024 & 2032
- Figure 59: South America Global Proanthocyanidins Market Revenue (Million), by Source 2024 & 2032
- Figure 60: South America Global Proanthocyanidins Market Volume (K Tons), by Source 2024 & 2032
- Figure 61: South America Global Proanthocyanidins Market Revenue Share (%), by Source 2024 & 2032
- Figure 62: South America Global Proanthocyanidins Market Volume Share (%), by Source 2024 & 2032
- Figure 63: South America Global Proanthocyanidins Market Revenue (Million), by Application 2024 & 2032
- Figure 64: South America Global Proanthocyanidins Market Volume (K Tons), by Application 2024 & 2032
- Figure 65: South America Global Proanthocyanidins Market Revenue Share (%), by Application 2024 & 2032
- Figure 66: South America Global Proanthocyanidins Market Volume Share (%), by Application 2024 & 2032
- Figure 67: South America Global Proanthocyanidins Market Revenue (Million), by Country 2024 & 2032
- Figure 68: South America Global Proanthocyanidins Market Volume (K Tons), by Country 2024 & 2032
- Figure 69: South America Global Proanthocyanidins Market Revenue Share (%), by Country 2024 & 2032
- Figure 70: South America Global Proanthocyanidins Market Volume Share (%), by Country 2024 & 2032
- Figure 71: Middle East and Africa Global Proanthocyanidins Market Revenue (Million), by Source 2024 & 2032
- Figure 72: Middle East and Africa Global Proanthocyanidins Market Volume (K Tons), by Source 2024 & 2032
- Figure 73: Middle East and Africa Global Proanthocyanidins Market Revenue Share (%), by Source 2024 & 2032
- Figure 74: Middle East and Africa Global Proanthocyanidins Market Volume Share (%), by Source 2024 & 2032
- Figure 75: Middle East and Africa Global Proanthocyanidins Market Revenue (Million), by Application 2024 & 2032
- Figure 76: Middle East and Africa Global Proanthocyanidins Market Volume (K Tons), by Application 2024 & 2032
- Figure 77: Middle East and Africa Global Proanthocyanidins Market Revenue Share (%), by Application 2024 & 2032
- Figure 78: Middle East and Africa Global Proanthocyanidins Market Volume Share (%), by Application 2024 & 2032
- Figure 79: Middle East and Africa Global Proanthocyanidins Market Revenue (Million), by Country 2024 & 2032
- Figure 80: Middle East and Africa Global Proanthocyanidins Market Volume (K Tons), by Country 2024 & 2032
- Figure 81: Middle East and Africa Global Proanthocyanidins Market Revenue Share (%), by Country 2024 & 2032
- Figure 82: Middle East and Africa Global Proanthocyanidins Market Volume Share (%), by Country 2024 & 2032
List of Tables
- Table 1: Global Proanthocyanidins Market Revenue Million Forecast, by Region 2019 & 2032
- Table 2: Global Proanthocyanidins Market Volume K Tons Forecast, by Region 2019 & 2032
- Table 3: Global Proanthocyanidins Market Revenue Million Forecast, by Source 2019 & 2032
- Table 4: Global Proanthocyanidins Market Volume K Tons Forecast, by Source 2019 & 2032
- Table 5: Global Proanthocyanidins Market Revenue Million Forecast, by Application 2019 & 2032
- Table 6: Global Proanthocyanidins Market Volume K Tons Forecast, by Application 2019 & 2032
- Table 7: Global Proanthocyanidins Market Revenue Million Forecast, by Region 2019 & 2032
- Table 8: Global Proanthocyanidins Market Volume K Tons Forecast, by Region 2019 & 2032
- Table 9: Global Proanthocyanidins Market Revenue Million Forecast, by Country 2019 & 2032
- Table 10: Global Proanthocyanidins Market Volume K Tons Forecast, by Country 2019 & 2032
- Table 11: United States Global Proanthocyanidins Market Revenue (Million) Forecast, by Application 2019 & 2032
- Table 12: United States Global Proanthocyanidins Market Volume (K Tons) Forecast, by Application 2019 & 2032
- Table 13: Canada Global Proanthocyanidins Market Revenue (Million) Forecast, by Application 2019 & 2032
- Table 14: Canada Global Proanthocyanidins Market Volume (K Tons) Forecast, by Application 2019 & 2032
- Table 15: Mexico Global Proanthocyanidins Market Revenue (Million) Forecast, by Application 2019 & 2032
- Table 16: Mexico Global Proanthocyanidins Market Volume (K Tons) Forecast, by Application 2019 & 2032
- Table 17: Rest of North America Global Proanthocyanidins Market Revenue (Million) Forecast, by Application 2019 & 2032
- Table 18: Rest of North America Global Proanthocyanidins Market Volume (K Tons) Forecast, by Application 2019 & 2032
- Table 19: Global Proanthocyanidins Market Revenue Million Forecast, by Country 2019 & 2032
- Table 20: Global Proanthocyanidins Market Volume K Tons Forecast, by Country 2019 & 2032
- Table 21: Spain Global Proanthocyanidins Market Revenue (Million) Forecast, by Application 2019 & 2032
- Table 22: Spain Global Proanthocyanidins Market Volume (K Tons) Forecast, by Application 2019 & 2032
- Table 23: United Kingdom Global Proanthocyanidins Market Revenue (Million) Forecast, by Application 2019 & 2032
- Table 24: United Kingdom Global Proanthocyanidins Market Volume (K Tons) Forecast, by Application 2019 & 2032
- Table 25: Germany Global Proanthocyanidins Market Revenue (Million) Forecast, by Application 2019 & 2032
- Table 26: Germany Global Proanthocyanidins Market Volume (K Tons) Forecast, by Application 2019 & 2032
- Table 27: France Global Proanthocyanidins Market Revenue (Million) Forecast, by Application 2019 & 2032
- Table 28: France Global Proanthocyanidins Market Volume (K Tons) Forecast, by Application 2019 & 2032
- Table 29: Italy Global Proanthocyanidins Market Revenue (Million) Forecast, by Application 2019 & 2032
- Table 30: Italy Global Proanthocyanidins Market Volume (K Tons) Forecast, by Application 2019 & 2032
- Table 31: Russia Global Proanthocyanidins Market Revenue (Million) Forecast, by Application 2019 & 2032
- Table 32: Russia Global Proanthocyanidins Market Volume (K Tons) Forecast, by Application 2019 & 2032
- Table 33: Rest of Europe Global Proanthocyanidins Market Revenue (Million) Forecast, by Application 2019 & 2032
- Table 34: Rest of Europe Global Proanthocyanidins Market Volume (K Tons) Forecast, by Application 2019 & 2032
- Table 35: Global Proanthocyanidins Market Revenue Million Forecast, by Country 2019 & 2032
- Table 36: Global Proanthocyanidins Market Volume K Tons Forecast, by Country 2019 & 2032
- Table 37: China Global Proanthocyanidins Market Revenue (Million) Forecast, by Application 2019 & 2032
- Table 38: China Global Proanthocyanidins Market Volume (K Tons) Forecast, by Application 2019 & 2032
- Table 39: Japan Global Proanthocyanidins Market Revenue (Million) Forecast, by Application 2019 & 2032
- Table 40: Japan Global Proanthocyanidins Market Volume (K Tons) Forecast, by Application 2019 & 2032
- Table 41: India Global Proanthocyanidins Market Revenue (Million) Forecast, by Application 2019 & 2032
- Table 42: India Global Proanthocyanidins Market Volume (K Tons) Forecast, by Application 2019 & 2032
- Table 43: Australia Global Proanthocyanidins Market Revenue (Million) Forecast, by Application 2019 & 2032
- Table 44: Australia Global Proanthocyanidins Market Volume (K Tons) Forecast, by Application 2019 & 2032
- Table 45: Rest of Asia Pacific Global Proanthocyanidins Market Revenue (Million) Forecast, by Application 2019 & 2032
- Table 46: Rest of Asia Pacific Global Proanthocyanidins Market Volume (K Tons) Forecast, by Application 2019 & 2032
- Table 47: Global Proanthocyanidins Market Revenue Million Forecast, by Country 2019 & 2032
- Table 48: Global Proanthocyanidins Market Volume K Tons Forecast, by Country 2019 & 2032
- Table 49: Brazil Global Proanthocyanidins Market Revenue (Million) Forecast, by Application 2019 & 2032
- Table 50: Brazil Global Proanthocyanidins Market Volume (K Tons) Forecast, by Application 2019 & 2032
- Table 51: Argentina Global Proanthocyanidins Market Revenue (Million) Forecast, by Application 2019 & 2032
- Table 52: Argentina Global Proanthocyanidins Market Volume (K Tons) Forecast, by Application 2019 & 2032
- Table 53: Rest of South America Global Proanthocyanidins Market Revenue (Million) Forecast, by Application 2019 & 2032
- Table 54: Rest of South America Global Proanthocyanidins Market Volume (K Tons) Forecast, by Application 2019 & 2032
- Table 55: Global Proanthocyanidins Market Revenue Million Forecast, by Country 2019 & 2032
- Table 56: Global Proanthocyanidins Market Volume K Tons Forecast, by Country 2019 & 2032
- Table 57: South Africa Global Proanthocyanidins Market Revenue (Million) Forecast, by Application 2019 & 2032
- Table 58: South Africa Global Proanthocyanidins Market Volume (K Tons) Forecast, by Application 2019 & 2032
- Table 59: Saudi Arabia Global Proanthocyanidins Market Revenue (Million) Forecast, by Application 2019 & 2032
- Table 60: Saudi Arabia Global Proanthocyanidins Market Volume (K Tons) Forecast, by Application 2019 & 2032
- Table 61: Rest of Middle East and Africa Global Proanthocyanidins Market Revenue (Million) Forecast, by Application 2019 & 2032
- Table 62: Rest of Middle East and Africa Global Proanthocyanidins Market Volume (K Tons) Forecast, by Application 2019 & 2032
- Table 63: Global Proanthocyanidins Market Revenue Million Forecast, by Source 2019 & 2032
- Table 64: Global Proanthocyanidins Market Volume K Tons Forecast, by Source 2019 & 2032
- Table 65: Global Proanthocyanidins Market Revenue Million Forecast, by Application 2019 & 2032
- Table 66: Global Proanthocyanidins Market Volume K Tons Forecast, by Application 2019 & 2032
- Table 67: Global Proanthocyanidins Market Revenue Million Forecast, by Country 2019 & 2032
- Table 68: Global Proanthocyanidins Market Volume K Tons Forecast, by Country 2019 & 2032
- Table 69: United States Global Proanthocyanidins Market Revenue (Million) Forecast, by Application 2019 & 2032
- Table 70: United States Global Proanthocyanidins Market Volume (K Tons) Forecast, by Application 2019 & 2032
- Table 71: Canada Global Proanthocyanidins Market Revenue (Million) Forecast, by Application 2019 & 2032
- Table 72: Canada Global Proanthocyanidins Market Volume (K Tons) Forecast, by Application 2019 & 2032
- Table 73: Mexico Global Proanthocyanidins Market Revenue (Million) Forecast, by Application 2019 & 2032
- Table 74: Mexico Global Proanthocyanidins Market Volume (K Tons) Forecast, by Application 2019 & 2032
- Table 75: Rest of North America Global Proanthocyanidins Market Revenue (Million) Forecast, by Application 2019 & 2032
- Table 76: Rest of North America Global Proanthocyanidins Market Volume (K Tons) Forecast, by Application 2019 & 2032
- Table 77: Global Proanthocyanidins Market Revenue Million Forecast, by Source 2019 & 2032
- Table 78: Global Proanthocyanidins Market Volume K Tons Forecast, by Source 2019 & 2032
- Table 79: Global Proanthocyanidins Market Revenue Million Forecast, by Application 2019 & 2032
- Table 80: Global Proanthocyanidins Market Volume K Tons Forecast, by Application 2019 & 2032
- Table 81: Global Proanthocyanidins Market Revenue Million Forecast, by Country 2019 & 2032
- Table 82: Global Proanthocyanidins Market Volume K Tons Forecast, by Country 2019 & 2032
- Table 83: Spain Global Proanthocyanidins Market Revenue (Million) Forecast, by Application 2019 & 2032
- Table 84: Spain Global Proanthocyanidins Market Volume (K Tons) Forecast, by Application 2019 & 2032
- Table 85: United Kingdom Global Proanthocyanidins Market Revenue (Million) Forecast, by Application 2019 & 2032
- Table 86: United Kingdom Global Proanthocyanidins Market Volume (K Tons) Forecast, by Application 2019 & 2032
- Table 87: Germany Global Proanthocyanidins Market Revenue (Million) Forecast, by Application 2019 & 2032
- Table 88: Germany Global Proanthocyanidins Market Volume (K Tons) Forecast, by Application 2019 & 2032
- Table 89: France Global Proanthocyanidins Market Revenue (Million) Forecast, by Application 2019 & 2032
- Table 90: France Global Proanthocyanidins Market Volume (K Tons) Forecast, by Application 2019 & 2032
- Table 91: Italy Global Proanthocyanidins Market Revenue (Million) Forecast, by Application 2019 & 2032
- Table 92: Italy Global Proanthocyanidins Market Volume (K Tons) Forecast, by Application 2019 & 2032
- Table 93: Russia Global Proanthocyanidins Market Revenue (Million) Forecast, by Application 2019 & 2032
- Table 94: Russia Global Proanthocyanidins Market Volume (K Tons) Forecast, by Application 2019 & 2032
- Table 95: Rest of Europe Global Proanthocyanidins Market Revenue (Million) Forecast, by Application 2019 & 2032
- Table 96: Rest of Europe Global Proanthocyanidins Market Volume (K Tons) Forecast, by Application 2019 & 2032
- Table 97: Global Proanthocyanidins Market Revenue Million Forecast, by Source 2019 & 2032
- Table 98: Global Proanthocyanidins Market Volume K Tons Forecast, by Source 2019 & 2032
- Table 99: Global Proanthocyanidins Market Revenue Million Forecast, by Application 2019 & 2032
- Table 100: Global Proanthocyanidins Market Volume K Tons Forecast, by Application 2019 & 2032
- Table 101: Global Proanthocyanidins Market Revenue Million Forecast, by Country 2019 & 2032
- Table 102: Global Proanthocyanidins Market Volume K Tons Forecast, by Country 2019 & 2032
- Table 103: China Global Proanthocyanidins Market Revenue (Million) Forecast, by Application 2019 & 2032
- Table 104: China Global Proanthocyanidins Market Volume (K Tons) Forecast, by Application 2019 & 2032
- Table 105: Japan Global Proanthocyanidins Market Revenue (Million) Forecast, by Application 2019 & 2032
- Table 106: Japan Global Proanthocyanidins Market Volume (K Tons) Forecast, by Application 2019 & 2032
- Table 107: India Global Proanthocyanidins Market Revenue (Million) Forecast, by Application 2019 & 2032
- Table 108: India Global Proanthocyanidins Market Volume (K Tons) Forecast, by Application 2019 & 2032
- Table 109: Australia Global Proanthocyanidins Market Revenue (Million) Forecast, by Application 2019 & 2032
- Table 110: Australia Global Proanthocyanidins Market Volume (K Tons) Forecast, by Application 2019 & 2032
- Table 111: Rest of Asia Pacific Global Proanthocyanidins Market Revenue (Million) Forecast, by Application 2019 & 2032
- Table 112: Rest of Asia Pacific Global Proanthocyanidins Market Volume (K Tons) Forecast, by Application 2019 & 2032
- Table 113: Global Proanthocyanidins Market Revenue Million Forecast, by Source 2019 & 2032
- Table 114: Global Proanthocyanidins Market Volume K Tons Forecast, by Source 2019 & 2032
- Table 115: Global Proanthocyanidins Market Revenue Million Forecast, by Application 2019 & 2032
- Table 116: Global Proanthocyanidins Market Volume K Tons Forecast, by Application 2019 & 2032
- Table 117: Global Proanthocyanidins Market Revenue Million Forecast, by Country 2019 & 2032
- Table 118: Global Proanthocyanidins Market Volume K Tons Forecast, by Country 2019 & 2032
- Table 119: Brazil Global Proanthocyanidins Market Revenue (Million) Forecast, by Application 2019 & 2032
- Table 120: Brazil Global Proanthocyanidins Market Volume (K Tons) Forecast, by Application 2019 & 2032
- Table 121: Argentina Global Proanthocyanidins Market Revenue (Million) Forecast, by Application 2019 & 2032
- Table 122: Argentina Global Proanthocyanidins Market Volume (K Tons) Forecast, by Application 2019 & 2032
- Table 123: Rest of South America Global Proanthocyanidins Market Revenue (Million) Forecast, by Application 2019 & 2032
- Table 124: Rest of South America Global Proanthocyanidins Market Volume (K Tons) Forecast, by Application 2019 & 2032
- Table 125: Global Proanthocyanidins Market Revenue Million Forecast, by Source 2019 & 2032
- Table 126: Global Proanthocyanidins Market Volume K Tons Forecast, by Source 2019 & 2032
- Table 127: Global Proanthocyanidins Market Revenue Million Forecast, by Application 2019 & 2032
- Table 128: Global Proanthocyanidins Market Volume K Tons Forecast, by Application 2019 & 2032
- Table 129: Global Proanthocyanidins Market Revenue Million Forecast, by Country 2019 & 2032
- Table 130: Global Proanthocyanidins Market Volume K Tons Forecast, by Country 2019 & 2032
- Table 131: South Africa Global Proanthocyanidins Market Revenue (Million) Forecast, by Application 2019 & 2032
- Table 132: South Africa Global Proanthocyanidins Market Volume (K Tons) Forecast, by Application 2019 & 2032
- Table 133: Saudi Arabia Global Proanthocyanidins Market Revenue (Million) Forecast, by Application 2019 & 2032
- Table 134: Saudi Arabia Global Proanthocyanidins Market Volume (K Tons) Forecast, by Application 2019 & 2032
- Table 135: Rest of Middle East and Africa Global Proanthocyanidins Market Revenue (Million) Forecast, by Application 2019 & 2032
- Table 136: Rest of Middle East and Africa Global Proanthocyanidins Market Volume (K Tons) Forecast, by Application 2019 & 2032
Frequently Asked Questions
1. What is the projected Compound Annual Growth Rate (CAGR) of the Global Proanthocyanidins Market?
The projected CAGR is approximately > 6.20%.
2. Which companies are prominent players in the Global Proanthocyanidins Market?
Key companies in the market include Polyphenolics, NATUREX SA, Indena S p A, EEVIA HEALTH OY, NEXIRA, Xian Yuensun Biological Technology Co Ltd *List Not Exhaustive, Botaniex Inc, Artemis International, Ginkgo BioWorks , Natural Remedies.
3. What are the main segments of the Global Proanthocyanidins Market?
The market segments include Source, Application.
4. Can you provide details about the market size?
The market size is estimated to be USD 235.08 Million as of 2022.
5. What are some drivers contributing to market growth?
Increasing awareness towards fitness among consumers; Demand for convenient fortified foods.
6. What are the notable trends driving market growth?
Surge in Demand for Dietary Supplements Derived from Natural Extracts.
7. Are there any restraints impacting market growth?
Increasing vegan culture in the market.
8. Can you provide examples of recent developments in the market?
Ongoing developments include the launch of new proanthocyanidin-rich products, strategic partnerships among market players, and increased research activities to explore the potential health benefits of proanthocyanidins.
9. What pricing options are available for accessing the report?
Pricing options include single-user, multi-user, and enterprise licenses priced at USD 4750, USD 5250, and USD 8750 respectively.
10. Is the market size provided in terms of value or volume?
The market size is provided in terms of value, measured in Million and volume, measured in K Tons.
11. Are there any specific market keywords associated with the report?
Yes, the market keyword associated with the report is "Global Proanthocyanidins Market," which aids in identifying and referencing the specific market segment covered.
12. How do I determine which pricing option suits my needs best?
The pricing options vary based on user requirements and access needs. Individual users may opt for single-user licenses, while businesses requiring broader access may choose multi-user or enterprise licenses for cost-effective access to the report.
13. Are there any additional resources or data provided in the Global Proanthocyanidins Market report?
While the report offers comprehensive insights, it's advisable to review the specific contents or supplementary materials provided to ascertain if additional resources or data are available.
14. How can I stay updated on further developments or reports in the Global Proanthocyanidins Market?
To stay informed about further developments, trends, and reports in the Global Proanthocyanidins Market, consider subscribing to industry newsletters, following relevant companies and organizations, or regularly checking reputable industry news sources and publications.
Methodology
Step 1 - Identification of Relevant Samples Size from Population Database


Step 2 - Approaches for Defining Global Market Size (Value, Volume* & Price*)

Note*: In applicable scenarios
Step 3 - Data Sources
Primary Research
- Web Analytics
- Survey Reports
- Research Institute
- Latest Research Reports
- Opinion Leaders
Secondary Research
- Annual Reports
- White Paper
- Latest Press Release
- Industry Association
- Paid Database
- Investor Presentations

Step 4 - Data Triangulation
Involves using different sources of information in order to increase the validity of a study
These sources are likely to be stakeholders in a program - participants, other researchers, program staff, other community members, and so on.
Then we put all data in single framework & apply various statistical tools to find out the dynamic on the market.
During the analysis stage, feedback from the stakeholder groups would be compared to determine areas of agreement as well as areas of divergence


