
Key Insights
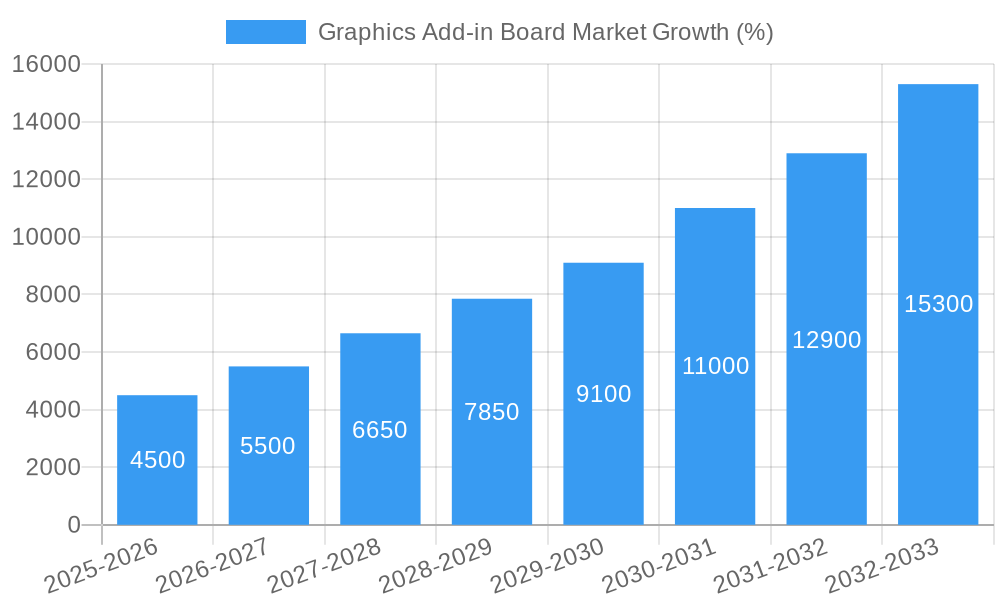
The Graphics Add-in Board (GAB) market is experiencing robust growth, driven by the increasing demand for high-performance computing across diverse sectors. A compound annual growth rate (CAGR) of 18% from 2019 to 2024 suggests a significant expansion, projected to continue in the forecast period (2025-2033). Key market drivers include the surging popularity of gaming, advancements in artificial intelligence and machine learning requiring powerful GPUs, and the growth of data centers demanding high processing capabilities. The gaming segment is a major contributor, with the rise of esports and increasingly sophisticated game titles fueling demand for high-end GABs. The design and visualization segment is also expanding rapidly, driven by professional applications in architecture, engineering, and media production. Furthermore, the increasing adoption of cloud computing and the growing need for edge computing are creating new opportunities within the data center segment. While supply chain constraints and component shortages have presented challenges in recent years, the long-term outlook remains positive due to the ongoing technological advancements and the diverse application landscape.
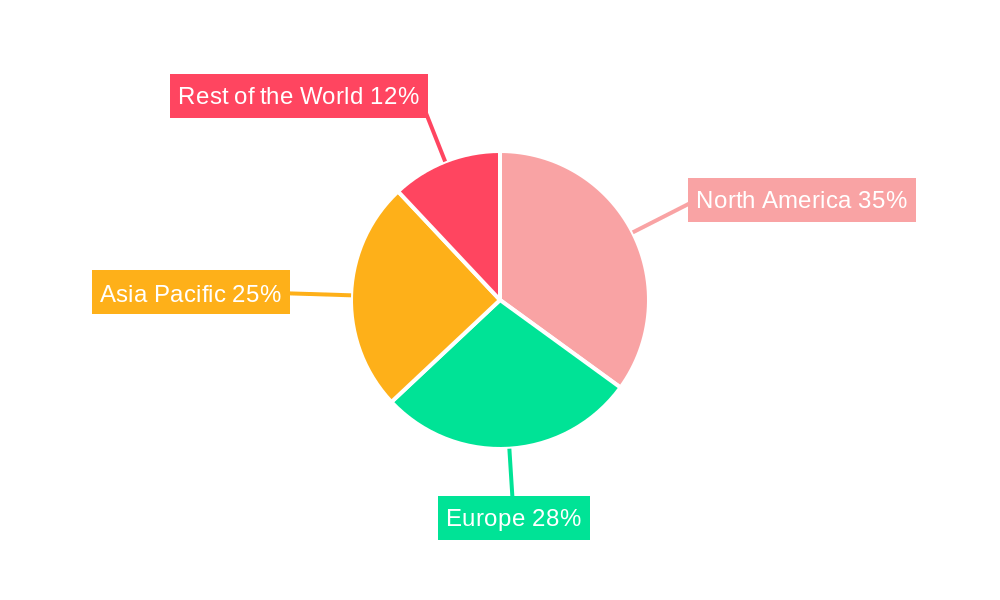
Market segmentation reveals a strong reliance on desktop and notebook computers, though workstations are demonstrating substantial growth. The leading players in the market, including Nvidia, AMD, Intel, and various board partners like ASUS, MSI, and Gigabyte, are actively investing in research and development to improve performance, energy efficiency, and affordability. Regional analysis indicates that North America and Asia Pacific are currently the largest markets, fueled by high consumer spending power and technological adoption rates. Europe follows closely, and the Rest of the World segment is expected to show promising growth in the coming years, driven by increasing digitalization and infrastructure investments. The market's evolution is expected to continue to be influenced by breakthroughs in GPU architecture, the rise of AI-accelerated computing, and the demands of increasingly data-intensive applications.
Graphics Add-in Board Market: A Comprehensive Report (2019-2033)
This comprehensive report provides an in-depth analysis of the Graphics Add-in Board (GAB) market, offering valuable insights for industry professionals, investors, and strategic decision-makers. Covering the period from 2019 to 2033, with a focus on 2025, this report meticulously examines market structure, dynamics, leading players, and future growth potential. The report leverages extensive data analysis and expert insights to provide a clear and actionable understanding of this dynamic market.
Graphics Add-in Board Market Market Structure & Innovation Trends
This section delves into the competitive landscape of the GAB market, analyzing market concentration, key innovation drivers, and regulatory influences. We examine the impact of mergers and acquisitions (M&A) activities, assessing their effects on market share and competitive dynamics. The analysis includes a detailed overview of product substitutes and their impact on market growth. End-user demographics are analyzed to understand market segmentation and future demand.
- Market Concentration: The market exhibits a moderately concentrated structure, with a few key players holding significant market share. The top 5 players account for approximately xx% of the global market in 2025.
- Innovation Drivers: Key drivers include advancements in GPU technology, increasing demand for high-resolution displays, and the growth of data-intensive applications.
- Regulatory Frameworks: Government regulations concerning energy efficiency and environmental standards impact the design and manufacturing of GABs.
- Product Substitutes: Cloud-based gaming services and integrated graphics solutions represent potential substitutes, though their market penetration remains limited.
- M&A Activities: Significant M&A activity has been observed in the historical period (2019-2024), with deal values exceeding xx Million. These activities have reshaped the competitive landscape and fostered innovation.
Graphics Add-in Board Market Market Dynamics & Trends
This section examines the key factors driving market growth, including technological advancements, evolving consumer preferences, and the competitive dynamics among key players. The analysis incorporates a detailed examination of market penetration rates and Compound Annual Growth Rate (CAGR).
The market is experiencing strong growth driven by the increasing adoption of high-performance computing in various sectors, including gaming, design and visualization, and data centers. The rising demand for enhanced visual experiences in gaming and the expanding use of AI and machine learning are key growth drivers. Technological advancements in GPU architecture, memory bandwidth, and power efficiency are continuously improving the performance and capabilities of GABs, fueling market expansion. However, the market is also facing challenges from fluctuating component prices and supply chain disruptions. The CAGR for the forecast period (2025-2033) is estimated to be xx%. Market penetration is expected to increase from xx% in 2025 to xx% by 2033.
Dominant Regions & Segments in Graphics Add-in Board Market
This section identifies the leading regions and segments within the GAB market. We analyze market dominance based on factors such as economic strength, technological infrastructure, and consumer demand.
- Leading Region: North America is currently the dominant region, followed by Asia-Pacific.
- Leading Application Segment: The Gaming segment holds the largest market share, driven by the increasing popularity of esports and high-end gaming PCs.
- Leading End-User Segment: The Desktop segment currently dominates the market due to its wider adoption in gaming and professional applications.
Key Drivers for Leading Regions and Segments:
- North America: Strong demand for high-performance computing in various industries, robust technological infrastructure, and high disposable income.
- Asia-Pacific: Rapid economic growth, expanding gaming market, and increasing adoption of high-end PCs in professional fields.
- Gaming Segment: Rising popularity of esports, the release of new high-end games, and the increasing demand for enhanced visual experiences.
- Desktop Segment: Widespread adoption in gaming, design, and professional applications, offering greater expandability and customization compared to other segments.
Graphics Add-in Board Market Product Innovations
Recent years have witnessed significant advancements in GAB technology, including the introduction of new GPU architectures, improved memory technologies, and enhanced cooling solutions. These innovations aim to improve performance, reduce power consumption, and enhance user experience. The market is seeing a shift towards more efficient and powerful GPUs that cater to the demands of high-resolution gaming, professional visualization, and data-intensive applications. This aligns perfectly with growing market trends favoring higher performance at lower power consumption.
Report Scope & Segmentation Analysis
This report segments the GAB market by application (Gaming, Design and Visualization, High-performance Computing, Data Center, Others) and end-user (Desktop, Notebooks and Tablets, Workstations, Others). Each segment's growth projections, market size, and competitive dynamics are analyzed in detail. Growth projections vary significantly across segments, reflecting differing demand drivers and technological advancements. The Gaming segment is expected to maintain strong growth throughout the forecast period.
Key Drivers of Graphics Add-in Board Market Growth
The GAB market is fueled by several key drivers, including the increasing demand for enhanced visual experiences in gaming and professional applications, advancements in GPU technology, and the rising adoption of high-performance computing across various industries. Government initiatives promoting digitalization and the expansion of high-speed internet infrastructure are also contributing to market growth. The growing popularity of virtual reality (VR) and augmented reality (AR) technologies is driving demand for high-performance GABs.
Challenges in the Graphics Add-in Board Market Sector
The GAB market faces several challenges including fluctuations in component prices, supply chain disruptions, and intense competition among key players. Stringent regulatory requirements related to energy efficiency and environmental impact also present hurdles. These factors can lead to price volatility and impact profitability for manufacturers.
Emerging Opportunities in Graphics Add-in Board Market
Emerging opportunities in the GAB market include the growth of cloud gaming, the increasing demand for AI and machine learning applications, and the expansion of the metaverse. New markets in developing economies also present significant potential for growth. Advancements in miniaturization and power efficiency will open new opportunities in mobile and embedded systems.
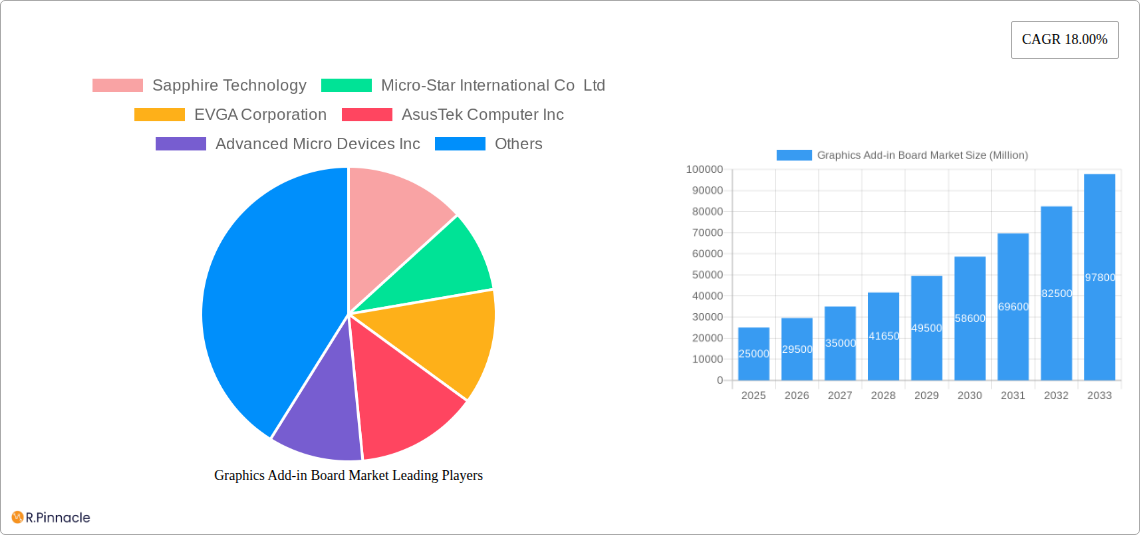
Leading Players in the Graphics Add-in Board Market Market
- Sapphire Technology
- Micro-Star International Co Ltd
- EVGA Corporation
- AsusTek Computer Inc
- Advanced Micro Devices Inc
- Zotac
- Nvidia Corporation
- INNO3D
- Gigabyte Technology
- Intel Corporation
Key Developments in Graphics Add-in Board Market Industry
- 2023-Q3: Nvidia launched the RTX 4090, significantly boosting high-end gaming performance.
- 2022-Q4: AMD released the RX 7000 series, increasing competition in the mid-range segment.
- 2021-Q1: A major supply chain disruption impacted GAB production globally.
Future Outlook for Graphics Add-in Board Market Market
The GAB market is poised for continued growth, driven by technological advancements, expanding applications, and increasing demand in emerging markets. Strategic partnerships, innovation in GPU architectures, and focus on sustainability will be crucial for success in the coming years. The market is expected to witness a robust expansion, fueled by the increasing adoption of high-performance computing across diverse sectors and the rising demand for immersive visual experiences.
Graphics Add-in Board Market Segmentation
-
1. Application
- 1.1. Gaming
- 1.2. Design and Visualization
- 1.3. High-performance Computing
- 1.4. Data Center
- 1.5. Others
-
2. End-Users
- 2.1. Desktop
- 2.2. Notebooks and Tablets
- 2.3. Workstations
- 2.4. Others
Graphics Add-in Board Market Segmentation By Geography
- 1. North America
- 2. Europe
- 3. Asia Pacific
- 4. Rest of the World
Graphics Add-in Board Market REPORT HIGHLIGHTS
| Aspects | Details |
|---|---|
| Study Period | 2019-2033 |
| Base Year | 2024 |
| Estimated Year | 2025 |
| Forecast Period | 2025-2033 |
| Historical Period | 2019-2024 |
| Growth Rate | CAGR of 18.00% from 2019-2033 |
| Segmentation |
|
Table of Contents
- 1. Introduction
- 1.1. Research Scope
- 1.2. Market Segmentation
- 1.3. Research Methodology
- 1.4. Definitions and Assumptions
- 2. Executive Summary
- 2.1. Introduction
- 3. Market Dynamics
- 3.1. Introduction
- 3.2. Market Drivers
- 3.2.1 Rising Penetration of Smartphones; Growing Adoption of Cloud Computing
- 3.2.2 Big Data Analytics
- 3.2.3 and AI
- 3.3. Market Restrains
- 3.3.1. Cyber Security concerns may hinder the growth of the sports betting kiosk market
- 3.4. Market Trends
- 3.4.1. Gaming Industry to Augment the Market Growth
- 4. Market Factor Analysis
- 4.1. Porters Five Forces
- 4.2. Supply/Value Chain
- 4.3. PESTEL analysis
- 4.4. Market Entropy
- 4.5. Patent/Trademark Analysis
- 5. Global Graphics Add-in Board Market Analysis, Insights and Forecast, 2019-2031
- 5.1. Market Analysis, Insights and Forecast - by Application
- 5.1.1. Gaming
- 5.1.2. Design and Visualization
- 5.1.3. High-performance Computing
- 5.1.4. Data Center
- 5.1.5. Others
- 5.2. Market Analysis, Insights and Forecast - by End-Users
- 5.2.1. Desktop
- 5.2.2. Notebooks and Tablets
- 5.2.3. Workstations
- 5.2.4. Others
- 5.3. Market Analysis, Insights and Forecast - by Region
- 5.3.1. North America
- 5.3.2. Europe
- 5.3.3. Asia Pacific
- 5.3.4. Rest of the World
- 5.1. Market Analysis, Insights and Forecast - by Application
- 6. North America Graphics Add-in Board Market Analysis, Insights and Forecast, 2019-2031
- 6.1. Market Analysis, Insights and Forecast - by Application
- 6.1.1. Gaming
- 6.1.2. Design and Visualization
- 6.1.3. High-performance Computing
- 6.1.4. Data Center
- 6.1.5. Others
- 6.2. Market Analysis, Insights and Forecast - by End-Users
- 6.2.1. Desktop
- 6.2.2. Notebooks and Tablets
- 6.2.3. Workstations
- 6.2.4. Others
- 6.1. Market Analysis, Insights and Forecast - by Application
- 7. Europe Graphics Add-in Board Market Analysis, Insights and Forecast, 2019-2031
- 7.1. Market Analysis, Insights and Forecast - by Application
- 7.1.1. Gaming
- 7.1.2. Design and Visualization
- 7.1.3. High-performance Computing
- 7.1.4. Data Center
- 7.1.5. Others
- 7.2. Market Analysis, Insights and Forecast - by End-Users
- 7.2.1. Desktop
- 7.2.2. Notebooks and Tablets
- 7.2.3. Workstations
- 7.2.4. Others
- 7.1. Market Analysis, Insights and Forecast - by Application
- 8. Asia Pacific Graphics Add-in Board Market Analysis, Insights and Forecast, 2019-2031
- 8.1. Market Analysis, Insights and Forecast - by Application
- 8.1.1. Gaming
- 8.1.2. Design and Visualization
- 8.1.3. High-performance Computing
- 8.1.4. Data Center
- 8.1.5. Others
- 8.2. Market Analysis, Insights and Forecast - by End-Users
- 8.2.1. Desktop
- 8.2.2. Notebooks and Tablets
- 8.2.3. Workstations
- 8.2.4. Others
- 8.1. Market Analysis, Insights and Forecast - by Application
- 9. Rest of the World Graphics Add-in Board Market Analysis, Insights and Forecast, 2019-2031
- 9.1. Market Analysis, Insights and Forecast - by Application
- 9.1.1. Gaming
- 9.1.2. Design and Visualization
- 9.1.3. High-performance Computing
- 9.1.4. Data Center
- 9.1.5. Others
- 9.2. Market Analysis, Insights and Forecast - by End-Users
- 9.2.1. Desktop
- 9.2.2. Notebooks and Tablets
- 9.2.3. Workstations
- 9.2.4. Others
- 9.1. Market Analysis, Insights and Forecast - by Application
- 10. North America Graphics Add-in Board Market Analysis, Insights and Forecast, 2019-2031
- 10.1. Market Analysis, Insights and Forecast - By Country/Sub-region
- 10.1.1.
- 11. Europe Graphics Add-in Board Market Analysis, Insights and Forecast, 2019-2031
- 11.1. Market Analysis, Insights and Forecast - By Country/Sub-region
- 11.1.1.
- 12. Asia Pacific Graphics Add-in Board Market Analysis, Insights and Forecast, 2019-2031
- 12.1. Market Analysis, Insights and Forecast - By Country/Sub-region
- 12.1.1.
- 13. Rest of the World Graphics Add-in Board Market Analysis, Insights and Forecast, 2019-2031
- 13.1. Market Analysis, Insights and Forecast - By Country/Sub-region
- 13.1.1.
- 14. Competitive Analysis
- 14.1. Global Market Share Analysis 2024
- 14.2. Company Profiles
- 14.2.1 Sapphire Technology
- 14.2.1.1. Overview
- 14.2.1.2. Products
- 14.2.1.3. SWOT Analysis
- 14.2.1.4. Recent Developments
- 14.2.1.5. Financials (Based on Availability)
- 14.2.2 Micro-Star International Co Ltd
- 14.2.2.1. Overview
- 14.2.2.2. Products
- 14.2.2.3. SWOT Analysis
- 14.2.2.4. Recent Developments
- 14.2.2.5. Financials (Based on Availability)
- 14.2.3 EVGA Corporation
- 14.2.3.1. Overview
- 14.2.3.2. Products
- 14.2.3.3. SWOT Analysis
- 14.2.3.4. Recent Developments
- 14.2.3.5. Financials (Based on Availability)
- 14.2.4 AsusTek Computer Inc
- 14.2.4.1. Overview
- 14.2.4.2. Products
- 14.2.4.3. SWOT Analysis
- 14.2.4.4. Recent Developments
- 14.2.4.5. Financials (Based on Availability)
- 14.2.5 Advanced Micro Devices Inc
- 14.2.5.1. Overview
- 14.2.5.2. Products
- 14.2.5.3. SWOT Analysis
- 14.2.5.4. Recent Developments
- 14.2.5.5. Financials (Based on Availability)
- 14.2.6 Zotac
- 14.2.6.1. Overview
- 14.2.6.2. Products
- 14.2.6.3. SWOT Analysis
- 14.2.6.4. Recent Developments
- 14.2.6.5. Financials (Based on Availability)
- 14.2.7 Nvidia Corporation
- 14.2.7.1. Overview
- 14.2.7.2. Products
- 14.2.7.3. SWOT Analysis
- 14.2.7.4. Recent Developments
- 14.2.7.5. Financials (Based on Availability)
- 14.2.8 INNO3D*List Not Exhaustive
- 14.2.8.1. Overview
- 14.2.8.2. Products
- 14.2.8.3. SWOT Analysis
- 14.2.8.4. Recent Developments
- 14.2.8.5. Financials (Based on Availability)
- 14.2.9 Gigabyte Technology
- 14.2.9.1. Overview
- 14.2.9.2. Products
- 14.2.9.3. SWOT Analysis
- 14.2.9.4. Recent Developments
- 14.2.9.5. Financials (Based on Availability)
- 14.2.10 Intel Corporation
- 14.2.10.1. Overview
- 14.2.10.2. Products
- 14.2.10.3. SWOT Analysis
- 14.2.10.4. Recent Developments
- 14.2.10.5. Financials (Based on Availability)
- 14.2.1 Sapphire Technology
List of Figures
- Figure 1: Global Graphics Add-in Board Market Revenue Breakdown (Million, %) by Region 2024 & 2032
- Figure 2: North America Graphics Add-in Board Market Revenue (Million), by Country 2024 & 2032
- Figure 3: North America Graphics Add-in Board Market Revenue Share (%), by Country 2024 & 2032
- Figure 4: Europe Graphics Add-in Board Market Revenue (Million), by Country 2024 & 2032
- Figure 5: Europe Graphics Add-in Board Market Revenue Share (%), by Country 2024 & 2032
- Figure 6: Asia Pacific Graphics Add-in Board Market Revenue (Million), by Country 2024 & 2032
- Figure 7: Asia Pacific Graphics Add-in Board Market Revenue Share (%), by Country 2024 & 2032
- Figure 8: Rest of the World Graphics Add-in Board Market Revenue (Million), by Country 2024 & 2032
- Figure 9: Rest of the World Graphics Add-in Board Market Revenue Share (%), by Country 2024 & 2032
- Figure 10: North America Graphics Add-in Board Market Revenue (Million), by Application 2024 & 2032
- Figure 11: North America Graphics Add-in Board Market Revenue Share (%), by Application 2024 & 2032
- Figure 12: North America Graphics Add-in Board Market Revenue (Million), by End-Users 2024 & 2032
- Figure 13: North America Graphics Add-in Board Market Revenue Share (%), by End-Users 2024 & 2032
- Figure 14: North America Graphics Add-in Board Market Revenue (Million), by Country 2024 & 2032
- Figure 15: North America Graphics Add-in Board Market Revenue Share (%), by Country 2024 & 2032
- Figure 16: Europe Graphics Add-in Board Market Revenue (Million), by Application 2024 & 2032
- Figure 17: Europe Graphics Add-in Board Market Revenue Share (%), by Application 2024 & 2032
- Figure 18: Europe Graphics Add-in Board Market Revenue (Million), by End-Users 2024 & 2032
- Figure 19: Europe Graphics Add-in Board Market Revenue Share (%), by End-Users 2024 & 2032
- Figure 20: Europe Graphics Add-in Board Market Revenue (Million), by Country 2024 & 2032
- Figure 21: Europe Graphics Add-in Board Market Revenue Share (%), by Country 2024 & 2032
- Figure 22: Asia Pacific Graphics Add-in Board Market Revenue (Million), by Application 2024 & 2032
- Figure 23: Asia Pacific Graphics Add-in Board Market Revenue Share (%), by Application 2024 & 2032
- Figure 24: Asia Pacific Graphics Add-in Board Market Revenue (Million), by End-Users 2024 & 2032
- Figure 25: Asia Pacific Graphics Add-in Board Market Revenue Share (%), by End-Users 2024 & 2032
- Figure 26: Asia Pacific Graphics Add-in Board Market Revenue (Million), by Country 2024 & 2032
- Figure 27: Asia Pacific Graphics Add-in Board Market Revenue Share (%), by Country 2024 & 2032
- Figure 28: Rest of the World Graphics Add-in Board Market Revenue (Million), by Application 2024 & 2032
- Figure 29: Rest of the World Graphics Add-in Board Market Revenue Share (%), by Application 2024 & 2032
- Figure 30: Rest of the World Graphics Add-in Board Market Revenue (Million), by End-Users 2024 & 2032
- Figure 31: Rest of the World Graphics Add-in Board Market Revenue Share (%), by End-Users 2024 & 2032
- Figure 32: Rest of the World Graphics Add-in Board Market Revenue (Million), by Country 2024 & 2032
- Figure 33: Rest of the World Graphics Add-in Board Market Revenue Share (%), by Country 2024 & 2032
List of Tables
- Table 1: Global Graphics Add-in Board Market Revenue Million Forecast, by Region 2019 & 2032
- Table 2: Global Graphics Add-in Board Market Revenue Million Forecast, by Application 2019 & 2032
- Table 3: Global Graphics Add-in Board Market Revenue Million Forecast, by End-Users 2019 & 2032
- Table 4: Global Graphics Add-in Board Market Revenue Million Forecast, by Region 2019 & 2032
- Table 5: Global Graphics Add-in Board Market Revenue Million Forecast, by Country 2019 & 2032
- Table 6: Graphics Add-in Board Market Revenue (Million) Forecast, by Application 2019 & 2032
- Table 7: Global Graphics Add-in Board Market Revenue Million Forecast, by Country 2019 & 2032
- Table 8: Graphics Add-in Board Market Revenue (Million) Forecast, by Application 2019 & 2032
- Table 9: Global Graphics Add-in Board Market Revenue Million Forecast, by Country 2019 & 2032
- Table 10: Graphics Add-in Board Market Revenue (Million) Forecast, by Application 2019 & 2032
- Table 11: Global Graphics Add-in Board Market Revenue Million Forecast, by Country 2019 & 2032
- Table 12: Graphics Add-in Board Market Revenue (Million) Forecast, by Application 2019 & 2032
- Table 13: Global Graphics Add-in Board Market Revenue Million Forecast, by Application 2019 & 2032
- Table 14: Global Graphics Add-in Board Market Revenue Million Forecast, by End-Users 2019 & 2032
- Table 15: Global Graphics Add-in Board Market Revenue Million Forecast, by Country 2019 & 2032
- Table 16: Global Graphics Add-in Board Market Revenue Million Forecast, by Application 2019 & 2032
- Table 17: Global Graphics Add-in Board Market Revenue Million Forecast, by End-Users 2019 & 2032
- Table 18: Global Graphics Add-in Board Market Revenue Million Forecast, by Country 2019 & 2032
- Table 19: Global Graphics Add-in Board Market Revenue Million Forecast, by Application 2019 & 2032
- Table 20: Global Graphics Add-in Board Market Revenue Million Forecast, by End-Users 2019 & 2032
- Table 21: Global Graphics Add-in Board Market Revenue Million Forecast, by Country 2019 & 2032
- Table 22: Global Graphics Add-in Board Market Revenue Million Forecast, by Application 2019 & 2032
- Table 23: Global Graphics Add-in Board Market Revenue Million Forecast, by End-Users 2019 & 2032
- Table 24: Global Graphics Add-in Board Market Revenue Million Forecast, by Country 2019 & 2032
Frequently Asked Questions
1. What is the projected Compound Annual Growth Rate (CAGR) of the Graphics Add-in Board Market?
The projected CAGR is approximately 18.00%.
2. Which companies are prominent players in the Graphics Add-in Board Market?
Key companies in the market include Sapphire Technology, Micro-Star International Co Ltd, EVGA Corporation, AsusTek Computer Inc, Advanced Micro Devices Inc, Zotac, Nvidia Corporation, INNO3D*List Not Exhaustive, Gigabyte Technology, Intel Corporation.
3. What are the main segments of the Graphics Add-in Board Market?
The market segments include Application, End-Users.
4. Can you provide details about the market size?
The market size is estimated to be USD XX Million as of 2022.
5. What are some drivers contributing to market growth?
Rising Penetration of Smartphones; Growing Adoption of Cloud Computing. Big Data Analytics. and AI.
6. What are the notable trends driving market growth?
Gaming Industry to Augment the Market Growth.
7. Are there any restraints impacting market growth?
Cyber Security concerns may hinder the growth of the sports betting kiosk market.
8. Can you provide examples of recent developments in the market?
N/A
9. What pricing options are available for accessing the report?
Pricing options include single-user, multi-user, and enterprise licenses priced at USD 4750, USD 5250, and USD 8750 respectively.
10. Is the market size provided in terms of value or volume?
The market size is provided in terms of value, measured in Million.
11. Are there any specific market keywords associated with the report?
Yes, the market keyword associated with the report is "Graphics Add-in Board Market," which aids in identifying and referencing the specific market segment covered.
12. How do I determine which pricing option suits my needs best?
The pricing options vary based on user requirements and access needs. Individual users may opt for single-user licenses, while businesses requiring broader access may choose multi-user or enterprise licenses for cost-effective access to the report.
13. Are there any additional resources or data provided in the Graphics Add-in Board Market report?
While the report offers comprehensive insights, it's advisable to review the specific contents or supplementary materials provided to ascertain if additional resources or data are available.
14. How can I stay updated on further developments or reports in the Graphics Add-in Board Market?
To stay informed about further developments, trends, and reports in the Graphics Add-in Board Market, consider subscribing to industry newsletters, following relevant companies and organizations, or regularly checking reputable industry news sources and publications.
Methodology
Step 1 - Identification of Relevant Samples Size from Population Database


Step 2 - Approaches for Defining Global Market Size (Value, Volume* & Price*)

Note*: In applicable scenarios
Step 3 - Data Sources
Primary Research
- Web Analytics
- Survey Reports
- Research Institute
- Latest Research Reports
- Opinion Leaders
Secondary Research
- Annual Reports
- White Paper
- Latest Press Release
- Industry Association
- Paid Database
- Investor Presentations

Step 4 - Data Triangulation
Involves using different sources of information in order to increase the validity of a study
These sources are likely to be stakeholders in a program - participants, other researchers, program staff, other community members, and so on.
Then we put all data in single framework & apply various statistical tools to find out the dynamic on the market.
During the analysis stage, feedback from the stakeholder groups would be compared to determine areas of agreement as well as areas of divergence


