
Key Insights
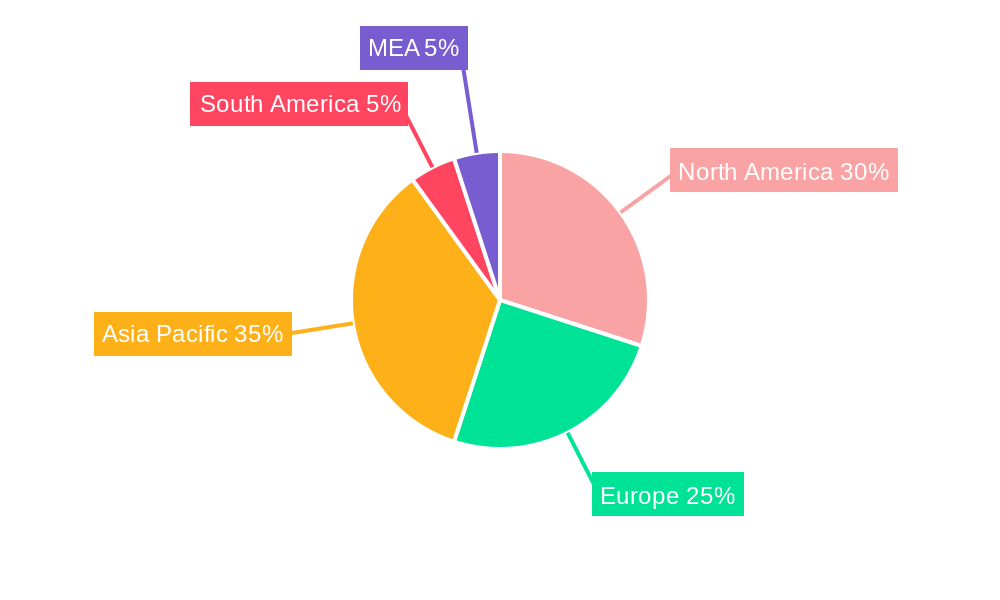
The global Green and Bio Polyols market is experiencing robust growth, driven by the increasing demand for sustainable and environmentally friendly materials across various industries. The market's Compound Annual Growth Rate (CAGR) exceeding 5% signifies a strong trajectory, projected to continue through 2033. Key drivers include stringent environmental regulations promoting bio-based alternatives to traditional petrochemical-based polyols, coupled with rising consumer awareness of sustainable consumption. The automotive industry, a major end-user, is significantly contributing to this growth, as manufacturers integrate bio-based polyols into foams, coatings, and other components to reduce their carbon footprint. Similarly, the building and construction sector is adopting green polyols for insulation and other applications, driven by initiatives promoting energy efficiency and sustainable building practices. The furniture and packaging industries are also witnessing increased adoption, fueled by the growing demand for eco-friendly products. Market segmentation reveals that polyether polyols currently hold a significant market share, but polyester polyols are gaining traction due to their superior properties in certain applications. While the market faces restraints such as higher initial costs compared to conventional polyols and potential supply chain challenges associated with sourcing sustainable raw materials, technological advancements and supportive government policies are mitigating these factors. Geographic analysis reveals strong growth in Asia-Pacific, driven by rapid industrialization and increasing disposable incomes, while North America and Europe maintain significant market presence due to established eco-conscious consumer bases and regulatory frameworks.
The competitive landscape is characterized by a mix of large multinational corporations and specialized chemical manufacturers. Major players are actively investing in research and development to improve the performance and cost-effectiveness of green and bio polyols. Strategic partnerships, mergers, and acquisitions are also expected to shape the market dynamics in the coming years. The continued focus on sustainability, coupled with technological innovations, will further propel the growth of this market segment, presenting lucrative opportunities for both established and emerging players. The forecast period (2025-2033) anticipates continued expansion, driven by a broadening range of applications and escalating demand from various end-use sectors committed to environmentally responsible practices. The market's trajectory points towards a significant shift towards bio-based solutions, ultimately contributing to a more sustainable future.
Green and Bio Polyols Market Report: A Comprehensive Analysis (2019-2033)
This comprehensive report provides an in-depth analysis of the Green and Bio Polyols market, offering actionable insights for industry professionals and stakeholders. Covering the period from 2019 to 2033, with a focus on 2025, this report meticulously examines market dynamics, competitive landscapes, and future growth potential. The study encompasses detailed segment analysis by material type (Polyether Polyols, Polyester Polyols, Other Types) and end-user industry (Automotive, Building and Construction, Furniture, Packaging, Other End-user Industries), revealing key trends and opportunities.
Green and Bio Polyols Market Structure & Innovation Trends
This section analyzes the competitive landscape of the Green and Bio Polyols market, evaluating market concentration, innovation drivers, and regulatory influences. We examine the impact of mergers and acquisitions (M&A) activity, identifying key players and their strategic moves. The analysis includes:
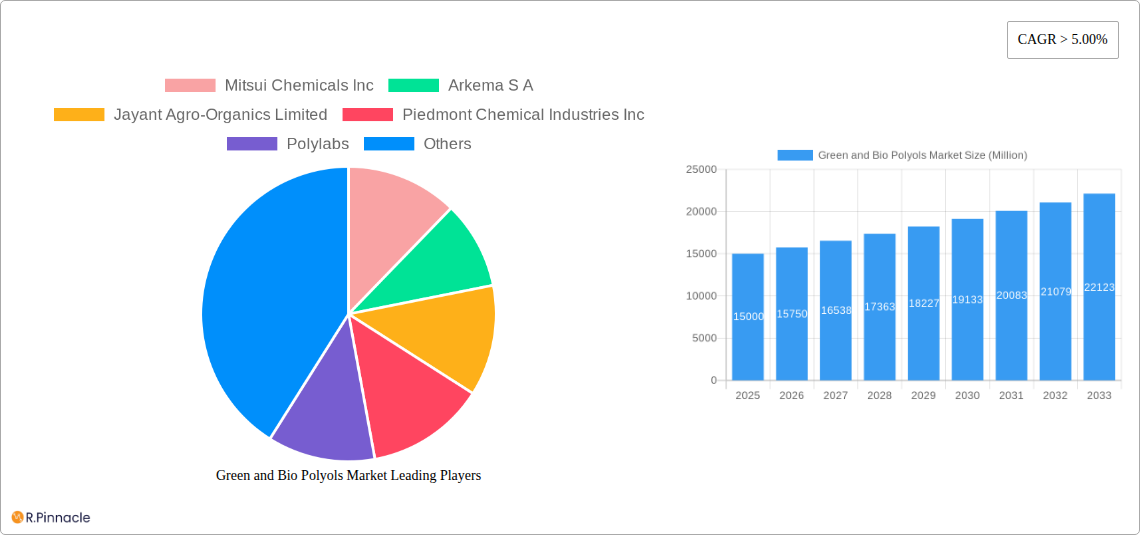
- Market Concentration: Assessment of market share held by key players like Mitsui Chemicals Inc, Arkema S A, BASF SE, and Huntsman International LLC, revealing the level of competition and potential for consolidation. We estimate the top 5 players hold approximately xx% of the market share in 2025.
- Innovation Drivers: Examination of factors driving innovation, such as the increasing demand for sustainable materials and stricter environmental regulations. Specific examples of innovative products and technologies will be detailed.
- Regulatory Frameworks: Analysis of relevant regulations impacting the market, including those related to bio-based content and environmental sustainability. The impact of these regulations on market growth and product development will be assessed.
- Product Substitutes: Identification and evaluation of potential substitute materials and their impact on market competition. We will analyze the advantages and disadvantages of these substitutes compared to Green and Bio Polyols.
- End-User Demographics: Profiling the key end-user industries and their evolving needs, highlighting growth opportunities and challenges. This includes analysis of growth in specific sectors and regional variations.
- M&A Activities: Review of recent M&A activities, including deal values and strategic implications for market players. Analysis of the impact on market concentration and future competitive dynamics. We estimate xx Million in M&A deal value in the past 5 years.
Green and Bio Polyols Market Dynamics & Trends
This section delves into the market's dynamic forces, analyzing growth drivers, technological advancements, and evolving consumer preferences. We explore the competitive landscape and provide a forecast for market growth, including:
- Market Growth Drivers: Examination of factors like increasing demand for sustainable and renewable resources, stricter environmental regulations promoting bio-based materials, and the expanding automotive and construction sectors.
- Technological Disruptions: Analysis of new technologies impacting the market, such as advancements in bio-based polyol production processes and the development of novel polyol formulations with enhanced properties.
- Consumer Preferences: Evaluation of changing consumer preferences toward environmentally friendly and sustainable products, influencing demand for Green and Bio Polyols.
- Competitive Dynamics: Analysis of competitive strategies employed by key market players, including pricing strategies, product differentiation, and innovation. The impact of these strategies on market share and profitability will be assessed. The CAGR for the forecast period (2025-2033) is estimated at xx%. Market penetration is expected to reach xx% by 2033.
Dominant Regions & Segments in Green and Bio Polyols Market
This section identifies the leading geographical regions and market segments. A detailed analysis of market dominance is provided, focusing on key growth drivers within each region and segment.
- Leading Regions: Analysis of regional market performance, identifying the dominant region(s) based on market size, growth rate, and key drivers. [Specific regions will be named and analyzed here, including key drivers such as economic policies and infrastructure development for each.]
- Dominant Segments: Analysis of market segmentation by material type (Polyether Polyols, Polyester Polyols, Other Types) and end-user industry (Automotive, Building and Construction, Furniture, Packaging, Other End-user Industries). We will highlight the fastest-growing and most lucrative segments and explain the reasons for their dominance. [Detailed analysis of each segment will be provided using bullet points outlining key drivers and paragraphs providing detailed dominance analysis.]
Green and Bio Polyols Market Product Innovations
This section summarizes recent product developments, highlighting technological advancements and their market fit. The emphasis will be on novel applications, performance enhancements, and competitive advantages offered by the latest innovations in Green and Bio Polyols.
Report Scope & Segmentation Analysis
This report comprehensively segments the Green and Bio Polyols market by material type and end-user industry. Each segment is analyzed in detail, considering growth projections, market size, and competitive dynamics. [Detailed analysis of each segment (Polyether Polyols, Polyester Polyols, Other Types; Automotive, Building and Construction, Furniture, Packaging, Other End-user Industries) will be provided here, including growth projections, market sizes, and competitive dynamics for each. Each paragraph will address a specific segment.]
Key Drivers of Green and Bio Polyols Market Growth
This section outlines the key factors driving market expansion. We will explore technological advancements, economic factors, and regulatory changes that fuel the growth of the Green and Bio Polyols market. [Detailed explanation of key drivers will be provided here.]
Challenges in the Green and Bio Polyols Market Sector
This section discusses the challenges and restraints impacting the Green and Bio Polyols market. We address regulatory hurdles, supply chain issues, and competitive pressures. [Detailed explanation of challenges will be provided here, including quantifiable impacts whenever possible.]
Emerging Opportunities in Green and Bio Polyols Market
This section highlights emerging trends and growth opportunities in the Green and Bio Polyols market, including new market segments, technologies, and consumer preferences. [Detailed explanation of emerging opportunities will be provided here.]
Leading Players in the Green and Bio Polyols Market Market
- Mitsui Chemicals Inc
- Arkema S A
- Jayant Agro-Organics Limited
- Piedmont Chemical Industries Inc
- Polylabs
- Kemipex
- Emery Oleochemicals
- BASF SE
- Huntsman International LLC
- Cargill Inc
- Bayer
Key Developments in Green and Bio Polyols Market Industry
- [List of key developments with year/month, emphasizing their impact on market dynamics. Examples: new product launches, mergers and acquisitions, regulatory changes.]
Future Outlook for Green and Bio Polyols Market Market
This section summarizes the growth accelerators and future market potential for Green and Bio Polyols. We will highlight strategic opportunities for market players to capitalize on the predicted growth. [Detailed summary of future market potential and strategic opportunities will be provided here.]
Green and Bio Polyols Market Segmentation
-
1. Material Type
- 1.1. Polyether Polyols
- 1.2. Polyester Polyols
- 1.3. Other Types
-
2. End-user Industry
- 2.1. Automotive
- 2.2. Building and Construction
- 2.3. Furniture
- 2.4. Packaging
- 2.5. Other End-user Industries
Green and Bio Polyols Market Segmentation By Geography
-
1. Asia Pacific
- 1.1. China
- 1.2. India
- 1.3. Japan
- 1.4. South Korea
- 1.5. Rest of Asia Pacific
-
2. North America
- 2.1. United States
- 2.2. Canada
- 2.3. Mexico
-
3. Europe
- 3.1. Germany
- 3.2. United Kingdom
- 3.3. France
- 3.4. Italy
- 3.5. Rest of Europe
-
4. South America
- 4.1. Brazil
- 4.2. Argentina
- 4.3. Rest of South America
-
5. Middle East and Africa
- 5.1. Saudi Arabia
- 5.2. South Africa
- 5.3. Rest of Middle East and Africa
Green and Bio Polyols Market REPORT HIGHLIGHTS
| Aspects | Details |
|---|---|
| Study Period | 2019-2033 |
| Base Year | 2024 |
| Estimated Year | 2025 |
| Forecast Period | 2025-2033 |
| Historical Period | 2019-2024 |
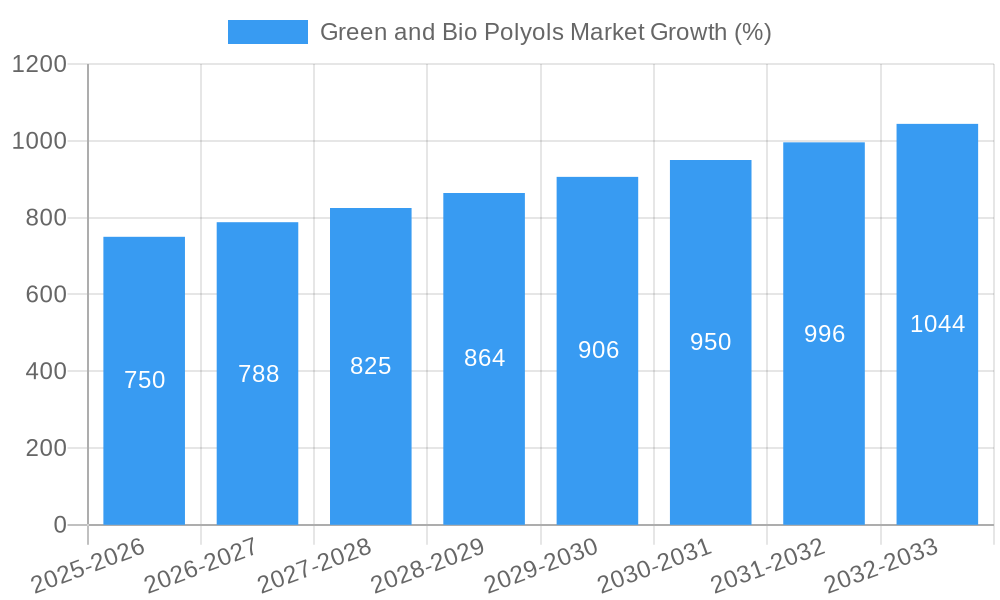
| Growth Rate | CAGR of > 5.00% from 2019-2033 |
| Segmentation |
|
Table of Contents
- 1. Introduction
- 1.1. Research Scope
- 1.2. Market Segmentation
- 1.3. Research Methodology
- 1.4. Definitions and Assumptions
- 2. Executive Summary
- 2.1. Introduction
- 3. Market Dynamics
- 3.1. Introduction
- 3.2. Market Drivers
- 3.2.1. ; Increasing Applications for Bio-Friendly Organic Compounds; Growing Demand from the Construction Industry
- 3.3. Market Restrains
- 3.3.1. ; High cost and Impact of COVID-19; Other Restraints
- 3.4. Market Trends
- 3.4.1. Growing Demand from Construction and Automotive Sectors
- 4. Market Factor Analysis
- 4.1. Porters Five Forces
- 4.2. Supply/Value Chain
- 4.3. PESTEL analysis
- 4.4. Market Entropy
- 4.5. Patent/Trademark Analysis
- 5. Global Green and Bio Polyols Market Analysis, Insights and Forecast, 2019-2031
- 5.1. Market Analysis, Insights and Forecast - by Material Type
- 5.1.1. Polyether Polyols
- 5.1.2. Polyester Polyols
- 5.1.3. Other Types
- 5.2. Market Analysis, Insights and Forecast - by End-user Industry
- 5.2.1. Automotive
- 5.2.2. Building and Construction
- 5.2.3. Furniture
- 5.2.4. Packaging
- 5.2.5. Other End-user Industries
- 5.3. Market Analysis, Insights and Forecast - by Region
- 5.3.1. Asia Pacific
- 5.3.2. North America
- 5.3.3. Europe
- 5.3.4. South America
- 5.3.5. Middle East and Africa
- 5.1. Market Analysis, Insights and Forecast - by Material Type
- 6. Asia Pacific Green and Bio Polyols Market Analysis, Insights and Forecast, 2019-2031
- 6.1. Market Analysis, Insights and Forecast - by Material Type
- 6.1.1. Polyether Polyols
- 6.1.2. Polyester Polyols
- 6.1.3. Other Types
- 6.2. Market Analysis, Insights and Forecast - by End-user Industry
- 6.2.1. Automotive
- 6.2.2. Building and Construction
- 6.2.3. Furniture
- 6.2.4. Packaging
- 6.2.5. Other End-user Industries
- 6.1. Market Analysis, Insights and Forecast - by Material Type
- 7. North America Green and Bio Polyols Market Analysis, Insights and Forecast, 2019-2031
- 7.1. Market Analysis, Insights and Forecast - by Material Type
- 7.1.1. Polyether Polyols
- 7.1.2. Polyester Polyols
- 7.1.3. Other Types
- 7.2. Market Analysis, Insights and Forecast - by End-user Industry
- 7.2.1. Automotive
- 7.2.2. Building and Construction
- 7.2.3. Furniture
- 7.2.4. Packaging
- 7.2.5. Other End-user Industries
- 7.1. Market Analysis, Insights and Forecast - by Material Type
- 8. Europe Green and Bio Polyols Market Analysis, Insights and Forecast, 2019-2031
- 8.1. Market Analysis, Insights and Forecast - by Material Type
- 8.1.1. Polyether Polyols
- 8.1.2. Polyester Polyols
- 8.1.3. Other Types
- 8.2. Market Analysis, Insights and Forecast - by End-user Industry
- 8.2.1. Automotive
- 8.2.2. Building and Construction
- 8.2.3. Furniture
- 8.2.4. Packaging
- 8.2.5. Other End-user Industries
- 8.1. Market Analysis, Insights and Forecast - by Material Type
- 9. South America Green and Bio Polyols Market Analysis, Insights and Forecast, 2019-2031
- 9.1. Market Analysis, Insights and Forecast - by Material Type
- 9.1.1. Polyether Polyols
- 9.1.2. Polyester Polyols
- 9.1.3. Other Types
- 9.2. Market Analysis, Insights and Forecast - by End-user Industry
- 9.2.1. Automotive
- 9.2.2. Building and Construction
- 9.2.3. Furniture
- 9.2.4. Packaging
- 9.2.5. Other End-user Industries
- 9.1. Market Analysis, Insights and Forecast - by Material Type
- 10. Middle East and Africa Green and Bio Polyols Market Analysis, Insights and Forecast, 2019-2031
- 10.1. Market Analysis, Insights and Forecast - by Material Type
- 10.1.1. Polyether Polyols
- 10.1.2. Polyester Polyols
- 10.1.3. Other Types
- 10.2. Market Analysis, Insights and Forecast - by End-user Industry
- 10.2.1. Automotive
- 10.2.2. Building and Construction
- 10.2.3. Furniture
- 10.2.4. Packaging
- 10.2.5. Other End-user Industries
- 10.1. Market Analysis, Insights and Forecast - by Material Type
- 11. North America Green and Bio Polyols Market Analysis, Insights and Forecast, 2019-2031
- 11.1. Market Analysis, Insights and Forecast - By Country/Sub-region
- 11.1.1 United States
- 11.1.2 Canada
- 11.1.3 Mexico
- 12. Europe Green and Bio Polyols Market Analysis, Insights and Forecast, 2019-2031
- 12.1. Market Analysis, Insights and Forecast - By Country/Sub-region
- 12.1.1 Germany
- 12.1.2 France
- 12.1.3 Italy
- 12.1.4 United Kingdom
- 12.1.5 Netherlands
- 12.1.6 Rest of Europe
- 13. Asia Pacific Green and Bio Polyols Market Analysis, Insights and Forecast, 2019-2031
- 13.1. Market Analysis, Insights and Forecast - By Country/Sub-region
- 13.1.1 China
- 13.1.2 Japan
- 13.1.3 India
- 13.1.4 South Korea
- 13.1.5 Taiwan
- 13.1.6 Australia
- 13.1.7 Rest of Asia-Pacific
- 14. South America Green and Bio Polyols Market Analysis, Insights and Forecast, 2019-2031
- 14.1. Market Analysis, Insights and Forecast - By Country/Sub-region
- 14.1.1 Brazil
- 14.1.2 Argentina
- 14.1.3 Rest of South America
- 15. MEA Green and Bio Polyols Market Analysis, Insights and Forecast, 2019-2031
- 15.1. Market Analysis, Insights and Forecast - By Country/Sub-region
- 15.1.1 Middle East
- 15.1.2 Africa
- 16. Competitive Analysis
- 16.1. Global Market Share Analysis 2024
- 16.2. Company Profiles
- 16.2.1 Mitsui Chemicals Inc
- 16.2.1.1. Overview
- 16.2.1.2. Products
- 16.2.1.3. SWOT Analysis
- 16.2.1.4. Recent Developments
- 16.2.1.5. Financials (Based on Availability)
- 16.2.2 Arkema S A
- 16.2.2.1. Overview
- 16.2.2.2. Products
- 16.2.2.3. SWOT Analysis
- 16.2.2.4. Recent Developments
- 16.2.2.5. Financials (Based on Availability)
- 16.2.3 Jayant Agro-Organics Limited
- 16.2.3.1. Overview
- 16.2.3.2. Products
- 16.2.3.3. SWOT Analysis
- 16.2.3.4. Recent Developments
- 16.2.3.5. Financials (Based on Availability)
- 16.2.4 Piedmont Chemical Industries Inc
- 16.2.4.1. Overview
- 16.2.4.2. Products
- 16.2.4.3. SWOT Analysis
- 16.2.4.4. Recent Developments
- 16.2.4.5. Financials (Based on Availability)
- 16.2.5 Polylabs
- 16.2.5.1. Overview
- 16.2.5.2. Products
- 16.2.5.3. SWOT Analysis
- 16.2.5.4. Recent Developments
- 16.2.5.5. Financials (Based on Availability)
- 16.2.6 Kemipex
- 16.2.6.1. Overview
- 16.2.6.2. Products
- 16.2.6.3. SWOT Analysis
- 16.2.6.4. Recent Developments
- 16.2.6.5. Financials (Based on Availability)
- 16.2.7 Emery Oleochemicals
- 16.2.7.1. Overview
- 16.2.7.2. Products
- 16.2.7.3. SWOT Analysis
- 16.2.7.4. Recent Developments
- 16.2.7.5. Financials (Based on Availability)
- 16.2.8 BASF SE
- 16.2.8.1. Overview
- 16.2.8.2. Products
- 16.2.8.3. SWOT Analysis
- 16.2.8.4. Recent Developments
- 16.2.8.5. Financials (Based on Availability)
- 16.2.9 Huntsman International LLC
- 16.2.9.1. Overview
- 16.2.9.2. Products
- 16.2.9.3. SWOT Analysis
- 16.2.9.4. Recent Developments
- 16.2.9.5. Financials (Based on Availability)
- 16.2.10 Cargill Inc
- 16.2.10.1. Overview
- 16.2.10.2. Products
- 16.2.10.3. SWOT Analysis
- 16.2.10.4. Recent Developments
- 16.2.10.5. Financials (Based on Availability)
- 16.2.11 Bayer
- 16.2.11.1. Overview
- 16.2.11.2. Products
- 16.2.11.3. SWOT Analysis
- 16.2.11.4. Recent Developments
- 16.2.11.5. Financials (Based on Availability)
- 16.2.1 Mitsui Chemicals Inc
List of Figures
- Figure 1: Global Green and Bio Polyols Market Revenue Breakdown (Million, %) by Region 2024 & 2032
- Figure 2: Global Green and Bio Polyols Market Volume Breakdown (K Tons, %) by Region 2024 & 2032
- Figure 3: North America Green and Bio Polyols Market Revenue (Million), by Country 2024 & 2032
- Figure 4: North America Green and Bio Polyols Market Volume (K Tons), by Country 2024 & 2032
- Figure 5: North America Green and Bio Polyols Market Revenue Share (%), by Country 2024 & 2032
- Figure 6: North America Green and Bio Polyols Market Volume Share (%), by Country 2024 & 2032
- Figure 7: Europe Green and Bio Polyols Market Revenue (Million), by Country 2024 & 2032
- Figure 8: Europe Green and Bio Polyols Market Volume (K Tons), by Country 2024 & 2032
- Figure 9: Europe Green and Bio Polyols Market Revenue Share (%), by Country 2024 & 2032
- Figure 10: Europe Green and Bio Polyols Market Volume Share (%), by Country 2024 & 2032
- Figure 11: Asia Pacific Green and Bio Polyols Market Revenue (Million), by Country 2024 & 2032
- Figure 12: Asia Pacific Green and Bio Polyols Market Volume (K Tons), by Country 2024 & 2032
- Figure 13: Asia Pacific Green and Bio Polyols Market Revenue Share (%), by Country 2024 & 2032
- Figure 14: Asia Pacific Green and Bio Polyols Market Volume Share (%), by Country 2024 & 2032
- Figure 15: South America Green and Bio Polyols Market Revenue (Million), by Country 2024 & 2032
- Figure 16: South America Green and Bio Polyols Market Volume (K Tons), by Country 2024 & 2032
- Figure 17: South America Green and Bio Polyols Market Revenue Share (%), by Country 2024 & 2032
- Figure 18: South America Green and Bio Polyols Market Volume Share (%), by Country 2024 & 2032
- Figure 19: MEA Green and Bio Polyols Market Revenue (Million), by Country 2024 & 2032
- Figure 20: MEA Green and Bio Polyols Market Volume (K Tons), by Country 2024 & 2032
- Figure 21: MEA Green and Bio Polyols Market Revenue Share (%), by Country 2024 & 2032
- Figure 22: MEA Green and Bio Polyols Market Volume Share (%), by Country 2024 & 2032
- Figure 23: Asia Pacific Green and Bio Polyols Market Revenue (Million), by Material Type 2024 & 2032
- Figure 24: Asia Pacific Green and Bio Polyols Market Volume (K Tons), by Material Type 2024 & 2032
- Figure 25: Asia Pacific Green and Bio Polyols Market Revenue Share (%), by Material Type 2024 & 2032
- Figure 26: Asia Pacific Green and Bio Polyols Market Volume Share (%), by Material Type 2024 & 2032
- Figure 27: Asia Pacific Green and Bio Polyols Market Revenue (Million), by End-user Industry 2024 & 2032
- Figure 28: Asia Pacific Green and Bio Polyols Market Volume (K Tons), by End-user Industry 2024 & 2032
- Figure 29: Asia Pacific Green and Bio Polyols Market Revenue Share (%), by End-user Industry 2024 & 2032
- Figure 30: Asia Pacific Green and Bio Polyols Market Volume Share (%), by End-user Industry 2024 & 2032
- Figure 31: Asia Pacific Green and Bio Polyols Market Revenue (Million), by Country 2024 & 2032
- Figure 32: Asia Pacific Green and Bio Polyols Market Volume (K Tons), by Country 2024 & 2032
- Figure 33: Asia Pacific Green and Bio Polyols Market Revenue Share (%), by Country 2024 & 2032
- Figure 34: Asia Pacific Green and Bio Polyols Market Volume Share (%), by Country 2024 & 2032
- Figure 35: North America Green and Bio Polyols Market Revenue (Million), by Material Type 2024 & 2032
- Figure 36: North America Green and Bio Polyols Market Volume (K Tons), by Material Type 2024 & 2032
- Figure 37: North America Green and Bio Polyols Market Revenue Share (%), by Material Type 2024 & 2032
- Figure 38: North America Green and Bio Polyols Market Volume Share (%), by Material Type 2024 & 2032
- Figure 39: North America Green and Bio Polyols Market Revenue (Million), by End-user Industry 2024 & 2032
- Figure 40: North America Green and Bio Polyols Market Volume (K Tons), by End-user Industry 2024 & 2032
- Figure 41: North America Green and Bio Polyols Market Revenue Share (%), by End-user Industry 2024 & 2032
- Figure 42: North America Green and Bio Polyols Market Volume Share (%), by End-user Industry 2024 & 2032
- Figure 43: North America Green and Bio Polyols Market Revenue (Million), by Country 2024 & 2032
- Figure 44: North America Green and Bio Polyols Market Volume (K Tons), by Country 2024 & 2032
- Figure 45: North America Green and Bio Polyols Market Revenue Share (%), by Country 2024 & 2032
- Figure 46: North America Green and Bio Polyols Market Volume Share (%), by Country 2024 & 2032
- Figure 47: Europe Green and Bio Polyols Market Revenue (Million), by Material Type 2024 & 2032
- Figure 48: Europe Green and Bio Polyols Market Volume (K Tons), by Material Type 2024 & 2032
- Figure 49: Europe Green and Bio Polyols Market Revenue Share (%), by Material Type 2024 & 2032
- Figure 50: Europe Green and Bio Polyols Market Volume Share (%), by Material Type 2024 & 2032
- Figure 51: Europe Green and Bio Polyols Market Revenue (Million), by End-user Industry 2024 & 2032
- Figure 52: Europe Green and Bio Polyols Market Volume (K Tons), by End-user Industry 2024 & 2032
- Figure 53: Europe Green and Bio Polyols Market Revenue Share (%), by End-user Industry 2024 & 2032
- Figure 54: Europe Green and Bio Polyols Market Volume Share (%), by End-user Industry 2024 & 2032
- Figure 55: Europe Green and Bio Polyols Market Revenue (Million), by Country 2024 & 2032
- Figure 56: Europe Green and Bio Polyols Market Volume (K Tons), by Country 2024 & 2032
- Figure 57: Europe Green and Bio Polyols Market Revenue Share (%), by Country 2024 & 2032
- Figure 58: Europe Green and Bio Polyols Market Volume Share (%), by Country 2024 & 2032
- Figure 59: South America Green and Bio Polyols Market Revenue (Million), by Material Type 2024 & 2032
- Figure 60: South America Green and Bio Polyols Market Volume (K Tons), by Material Type 2024 & 2032
- Figure 61: South America Green and Bio Polyols Market Revenue Share (%), by Material Type 2024 & 2032
- Figure 62: South America Green and Bio Polyols Market Volume Share (%), by Material Type 2024 & 2032
- Figure 63: South America Green and Bio Polyols Market Revenue (Million), by End-user Industry 2024 & 2032
- Figure 64: South America Green and Bio Polyols Market Volume (K Tons), by End-user Industry 2024 & 2032
- Figure 65: South America Green and Bio Polyols Market Revenue Share (%), by End-user Industry 2024 & 2032
- Figure 66: South America Green and Bio Polyols Market Volume Share (%), by End-user Industry 2024 & 2032
- Figure 67: South America Green and Bio Polyols Market Revenue (Million), by Country 2024 & 2032
- Figure 68: South America Green and Bio Polyols Market Volume (K Tons), by Country 2024 & 2032
- Figure 69: South America Green and Bio Polyols Market Revenue Share (%), by Country 2024 & 2032
- Figure 70: South America Green and Bio Polyols Market Volume Share (%), by Country 2024 & 2032
- Figure 71: Middle East and Africa Green and Bio Polyols Market Revenue (Million), by Material Type 2024 & 2032
- Figure 72: Middle East and Africa Green and Bio Polyols Market Volume (K Tons), by Material Type 2024 & 2032
- Figure 73: Middle East and Africa Green and Bio Polyols Market Revenue Share (%), by Material Type 2024 & 2032
- Figure 74: Middle East and Africa Green and Bio Polyols Market Volume Share (%), by Material Type 2024 & 2032
- Figure 75: Middle East and Africa Green and Bio Polyols Market Revenue (Million), by End-user Industry 2024 & 2032
- Figure 76: Middle East and Africa Green and Bio Polyols Market Volume (K Tons), by End-user Industry 2024 & 2032
- Figure 77: Middle East and Africa Green and Bio Polyols Market Revenue Share (%), by End-user Industry 2024 & 2032
- Figure 78: Middle East and Africa Green and Bio Polyols Market Volume Share (%), by End-user Industry 2024 & 2032
- Figure 79: Middle East and Africa Green and Bio Polyols Market Revenue (Million), by Country 2024 & 2032
- Figure 80: Middle East and Africa Green and Bio Polyols Market Volume (K Tons), by Country 2024 & 2032
- Figure 81: Middle East and Africa Green and Bio Polyols Market Revenue Share (%), by Country 2024 & 2032
- Figure 82: Middle East and Africa Green and Bio Polyols Market Volume Share (%), by Country 2024 & 2032
List of Tables
- Table 1: Global Green and Bio Polyols Market Revenue Million Forecast, by Region 2019 & 2032
- Table 2: Global Green and Bio Polyols Market Volume K Tons Forecast, by Region 2019 & 2032
- Table 3: Global Green and Bio Polyols Market Revenue Million Forecast, by Material Type 2019 & 2032
- Table 4: Global Green and Bio Polyols Market Volume K Tons Forecast, by Material Type 2019 & 2032
- Table 5: Global Green and Bio Polyols Market Revenue Million Forecast, by End-user Industry 2019 & 2032
- Table 6: Global Green and Bio Polyols Market Volume K Tons Forecast, by End-user Industry 2019 & 2032
- Table 7: Global Green and Bio Polyols Market Revenue Million Forecast, by Region 2019 & 2032
- Table 8: Global Green and Bio Polyols Market Volume K Tons Forecast, by Region 2019 & 2032
- Table 9: Global Green and Bio Polyols Market Revenue Million Forecast, by Country 2019 & 2032
- Table 10: Global Green and Bio Polyols Market Volume K Tons Forecast, by Country 2019 & 2032
- Table 11: United States Green and Bio Polyols Market Revenue (Million) Forecast, by Application 2019 & 2032
- Table 12: United States Green and Bio Polyols Market Volume (K Tons) Forecast, by Application 2019 & 2032
- Table 13: Canada Green and Bio Polyols Market Revenue (Million) Forecast, by Application 2019 & 2032
- Table 14: Canada Green and Bio Polyols Market Volume (K Tons) Forecast, by Application 2019 & 2032
- Table 15: Mexico Green and Bio Polyols Market Revenue (Million) Forecast, by Application 2019 & 2032
- Table 16: Mexico Green and Bio Polyols Market Volume (K Tons) Forecast, by Application 2019 & 2032
- Table 17: Global Green and Bio Polyols Market Revenue Million Forecast, by Country 2019 & 2032
- Table 18: Global Green and Bio Polyols Market Volume K Tons Forecast, by Country 2019 & 2032
- Table 19: Germany Green and Bio Polyols Market Revenue (Million) Forecast, by Application 2019 & 2032
- Table 20: Germany Green and Bio Polyols Market Volume (K Tons) Forecast, by Application 2019 & 2032
- Table 21: France Green and Bio Polyols Market Revenue (Million) Forecast, by Application 2019 & 2032
- Table 22: France Green and Bio Polyols Market Volume (K Tons) Forecast, by Application 2019 & 2032
- Table 23: Italy Green and Bio Polyols Market Revenue (Million) Forecast, by Application 2019 & 2032
- Table 24: Italy Green and Bio Polyols Market Volume (K Tons) Forecast, by Application 2019 & 2032
- Table 25: United Kingdom Green and Bio Polyols Market Revenue (Million) Forecast, by Application 2019 & 2032
- Table 26: United Kingdom Green and Bio Polyols Market Volume (K Tons) Forecast, by Application 2019 & 2032
- Table 27: Netherlands Green and Bio Polyols Market Revenue (Million) Forecast, by Application 2019 & 2032
- Table 28: Netherlands Green and Bio Polyols Market Volume (K Tons) Forecast, by Application 2019 & 2032
- Table 29: Rest of Europe Green and Bio Polyols Market Revenue (Million) Forecast, by Application 2019 & 2032
- Table 30: Rest of Europe Green and Bio Polyols Market Volume (K Tons) Forecast, by Application 2019 & 2032
- Table 31: Global Green and Bio Polyols Market Revenue Million Forecast, by Country 2019 & 2032
- Table 32: Global Green and Bio Polyols Market Volume K Tons Forecast, by Country 2019 & 2032
- Table 33: China Green and Bio Polyols Market Revenue (Million) Forecast, by Application 2019 & 2032
- Table 34: China Green and Bio Polyols Market Volume (K Tons) Forecast, by Application 2019 & 2032
- Table 35: Japan Green and Bio Polyols Market Revenue (Million) Forecast, by Application 2019 & 2032
- Table 36: Japan Green and Bio Polyols Market Volume (K Tons) Forecast, by Application 2019 & 2032
- Table 37: India Green and Bio Polyols Market Revenue (Million) Forecast, by Application 2019 & 2032
- Table 38: India Green and Bio Polyols Market Volume (K Tons) Forecast, by Application 2019 & 2032
- Table 39: South Korea Green and Bio Polyols Market Revenue (Million) Forecast, by Application 2019 & 2032
- Table 40: South Korea Green and Bio Polyols Market Volume (K Tons) Forecast, by Application 2019 & 2032
- Table 41: Taiwan Green and Bio Polyols Market Revenue (Million) Forecast, by Application 2019 & 2032
- Table 42: Taiwan Green and Bio Polyols Market Volume (K Tons) Forecast, by Application 2019 & 2032
- Table 43: Australia Green and Bio Polyols Market Revenue (Million) Forecast, by Application 2019 & 2032
- Table 44: Australia Green and Bio Polyols Market Volume (K Tons) Forecast, by Application 2019 & 2032
- Table 45: Rest of Asia-Pacific Green and Bio Polyols Market Revenue (Million) Forecast, by Application 2019 & 2032
- Table 46: Rest of Asia-Pacific Green and Bio Polyols Market Volume (K Tons) Forecast, by Application 2019 & 2032
- Table 47: Global Green and Bio Polyols Market Revenue Million Forecast, by Country 2019 & 2032
- Table 48: Global Green and Bio Polyols Market Volume K Tons Forecast, by Country 2019 & 2032
- Table 49: Brazil Green and Bio Polyols Market Revenue (Million) Forecast, by Application 2019 & 2032
- Table 50: Brazil Green and Bio Polyols Market Volume (K Tons) Forecast, by Application 2019 & 2032
- Table 51: Argentina Green and Bio Polyols Market Revenue (Million) Forecast, by Application 2019 & 2032
- Table 52: Argentina Green and Bio Polyols Market Volume (K Tons) Forecast, by Application 2019 & 2032
- Table 53: Rest of South America Green and Bio Polyols Market Revenue (Million) Forecast, by Application 2019 & 2032
- Table 54: Rest of South America Green and Bio Polyols Market Volume (K Tons) Forecast, by Application 2019 & 2032
- Table 55: Global Green and Bio Polyols Market Revenue Million Forecast, by Country 2019 & 2032
- Table 56: Global Green and Bio Polyols Market Volume K Tons Forecast, by Country 2019 & 2032
- Table 57: Middle East Green and Bio Polyols Market Revenue (Million) Forecast, by Application 2019 & 2032
- Table 58: Middle East Green and Bio Polyols Market Volume (K Tons) Forecast, by Application 2019 & 2032
- Table 59: Africa Green and Bio Polyols Market Revenue (Million) Forecast, by Application 2019 & 2032
- Table 60: Africa Green and Bio Polyols Market Volume (K Tons) Forecast, by Application 2019 & 2032
- Table 61: Global Green and Bio Polyols Market Revenue Million Forecast, by Material Type 2019 & 2032
- Table 62: Global Green and Bio Polyols Market Volume K Tons Forecast, by Material Type 2019 & 2032
- Table 63: Global Green and Bio Polyols Market Revenue Million Forecast, by End-user Industry 2019 & 2032
- Table 64: Global Green and Bio Polyols Market Volume K Tons Forecast, by End-user Industry 2019 & 2032
- Table 65: Global Green and Bio Polyols Market Revenue Million Forecast, by Country 2019 & 2032
- Table 66: Global Green and Bio Polyols Market Volume K Tons Forecast, by Country 2019 & 2032
- Table 67: China Green and Bio Polyols Market Revenue (Million) Forecast, by Application 2019 & 2032
- Table 68: China Green and Bio Polyols Market Volume (K Tons) Forecast, by Application 2019 & 2032
- Table 69: India Green and Bio Polyols Market Revenue (Million) Forecast, by Application 2019 & 2032
- Table 70: India Green and Bio Polyols Market Volume (K Tons) Forecast, by Application 2019 & 2032
- Table 71: Japan Green and Bio Polyols Market Revenue (Million) Forecast, by Application 2019 & 2032
- Table 72: Japan Green and Bio Polyols Market Volume (K Tons) Forecast, by Application 2019 & 2032
- Table 73: South Korea Green and Bio Polyols Market Revenue (Million) Forecast, by Application 2019 & 2032
- Table 74: South Korea Green and Bio Polyols Market Volume (K Tons) Forecast, by Application 2019 & 2032
- Table 75: Rest of Asia Pacific Green and Bio Polyols Market Revenue (Million) Forecast, by Application 2019 & 2032
- Table 76: Rest of Asia Pacific Green and Bio Polyols Market Volume (K Tons) Forecast, by Application 2019 & 2032
- Table 77: Global Green and Bio Polyols Market Revenue Million Forecast, by Material Type 2019 & 2032
- Table 78: Global Green and Bio Polyols Market Volume K Tons Forecast, by Material Type 2019 & 2032
- Table 79: Global Green and Bio Polyols Market Revenue Million Forecast, by End-user Industry 2019 & 2032
- Table 80: Global Green and Bio Polyols Market Volume K Tons Forecast, by End-user Industry 2019 & 2032
- Table 81: Global Green and Bio Polyols Market Revenue Million Forecast, by Country 2019 & 2032
- Table 82: Global Green and Bio Polyols Market Volume K Tons Forecast, by Country 2019 & 2032
- Table 83: United States Green and Bio Polyols Market Revenue (Million) Forecast, by Application 2019 & 2032
- Table 84: United States Green and Bio Polyols Market Volume (K Tons) Forecast, by Application 2019 & 2032
- Table 85: Canada Green and Bio Polyols Market Revenue (Million) Forecast, by Application 2019 & 2032
- Table 86: Canada Green and Bio Polyols Market Volume (K Tons) Forecast, by Application 2019 & 2032
- Table 87: Mexico Green and Bio Polyols Market Revenue (Million) Forecast, by Application 2019 & 2032
- Table 88: Mexico Green and Bio Polyols Market Volume (K Tons) Forecast, by Application 2019 & 2032
- Table 89: Global Green and Bio Polyols Market Revenue Million Forecast, by Material Type 2019 & 2032
- Table 90: Global Green and Bio Polyols Market Volume K Tons Forecast, by Material Type 2019 & 2032
- Table 91: Global Green and Bio Polyols Market Revenue Million Forecast, by End-user Industry 2019 & 2032
- Table 92: Global Green and Bio Polyols Market Volume K Tons Forecast, by End-user Industry 2019 & 2032
- Table 93: Global Green and Bio Polyols Market Revenue Million Forecast, by Country 2019 & 2032
- Table 94: Global Green and Bio Polyols Market Volume K Tons Forecast, by Country 2019 & 2032
- Table 95: Germany Green and Bio Polyols Market Revenue (Million) Forecast, by Application 2019 & 2032
- Table 96: Germany Green and Bio Polyols Market Volume (K Tons) Forecast, by Application 2019 & 2032
- Table 97: United Kingdom Green and Bio Polyols Market Revenue (Million) Forecast, by Application 2019 & 2032
- Table 98: United Kingdom Green and Bio Polyols Market Volume (K Tons) Forecast, by Application 2019 & 2032
- Table 99: France Green and Bio Polyols Market Revenue (Million) Forecast, by Application 2019 & 2032
- Table 100: France Green and Bio Polyols Market Volume (K Tons) Forecast, by Application 2019 & 2032
- Table 101: Italy Green and Bio Polyols Market Revenue (Million) Forecast, by Application 2019 & 2032
- Table 102: Italy Green and Bio Polyols Market Volume (K Tons) Forecast, by Application 2019 & 2032
- Table 103: Rest of Europe Green and Bio Polyols Market Revenue (Million) Forecast, by Application 2019 & 2032
- Table 104: Rest of Europe Green and Bio Polyols Market Volume (K Tons) Forecast, by Application 2019 & 2032
- Table 105: Global Green and Bio Polyols Market Revenue Million Forecast, by Material Type 2019 & 2032
- Table 106: Global Green and Bio Polyols Market Volume K Tons Forecast, by Material Type 2019 & 2032
- Table 107: Global Green and Bio Polyols Market Revenue Million Forecast, by End-user Industry 2019 & 2032
- Table 108: Global Green and Bio Polyols Market Volume K Tons Forecast, by End-user Industry 2019 & 2032
- Table 109: Global Green and Bio Polyols Market Revenue Million Forecast, by Country 2019 & 2032
- Table 110: Global Green and Bio Polyols Market Volume K Tons Forecast, by Country 2019 & 2032
- Table 111: Brazil Green and Bio Polyols Market Revenue (Million) Forecast, by Application 2019 & 2032
- Table 112: Brazil Green and Bio Polyols Market Volume (K Tons) Forecast, by Application 2019 & 2032
- Table 113: Argentina Green and Bio Polyols Market Revenue (Million) Forecast, by Application 2019 & 2032
- Table 114: Argentina Green and Bio Polyols Market Volume (K Tons) Forecast, by Application 2019 & 2032
- Table 115: Rest of South America Green and Bio Polyols Market Revenue (Million) Forecast, by Application 2019 & 2032
- Table 116: Rest of South America Green and Bio Polyols Market Volume (K Tons) Forecast, by Application 2019 & 2032
- Table 117: Global Green and Bio Polyols Market Revenue Million Forecast, by Material Type 2019 & 2032
- Table 118: Global Green and Bio Polyols Market Volume K Tons Forecast, by Material Type 2019 & 2032
- Table 119: Global Green and Bio Polyols Market Revenue Million Forecast, by End-user Industry 2019 & 2032
- Table 120: Global Green and Bio Polyols Market Volume K Tons Forecast, by End-user Industry 2019 & 2032
- Table 121: Global Green and Bio Polyols Market Revenue Million Forecast, by Country 2019 & 2032
- Table 122: Global Green and Bio Polyols Market Volume K Tons Forecast, by Country 2019 & 2032
- Table 123: Saudi Arabia Green and Bio Polyols Market Revenue (Million) Forecast, by Application 2019 & 2032
- Table 124: Saudi Arabia Green and Bio Polyols Market Volume (K Tons) Forecast, by Application 2019 & 2032
- Table 125: South Africa Green and Bio Polyols Market Revenue (Million) Forecast, by Application 2019 & 2032
- Table 126: South Africa Green and Bio Polyols Market Volume (K Tons) Forecast, by Application 2019 & 2032
- Table 127: Rest of Middle East and Africa Green and Bio Polyols Market Revenue (Million) Forecast, by Application 2019 & 2032
- Table 128: Rest of Middle East and Africa Green and Bio Polyols Market Volume (K Tons) Forecast, by Application 2019 & 2032
Frequently Asked Questions
1. What is the projected Compound Annual Growth Rate (CAGR) of the Green and Bio Polyols Market?
The projected CAGR is approximately > 5.00%.
2. Which companies are prominent players in the Green and Bio Polyols Market?
Key companies in the market include Mitsui Chemicals Inc, Arkema S A, Jayant Agro-Organics Limited, Piedmont Chemical Industries Inc, Polylabs, Kemipex, Emery Oleochemicals, BASF SE, Huntsman International LLC, Cargill Inc, Bayer.
3. What are the main segments of the Green and Bio Polyols Market?
The market segments include Material Type, End-user Industry.
4. Can you provide details about the market size?
The market size is estimated to be USD XX Million as of 2022.
5. What are some drivers contributing to market growth?
; Increasing Applications for Bio-Friendly Organic Compounds; Growing Demand from the Construction Industry.
6. What are the notable trends driving market growth?
Growing Demand from Construction and Automotive Sectors.
7. Are there any restraints impacting market growth?
; High cost and Impact of COVID-19; Other Restraints.
8. Can you provide examples of recent developments in the market?
N/A
9. What pricing options are available for accessing the report?
Pricing options include single-user, multi-user, and enterprise licenses priced at USD 4750, USD 5250, and USD 8750 respectively.
10. Is the market size provided in terms of value or volume?
The market size is provided in terms of value, measured in Million and volume, measured in K Tons.
11. Are there any specific market keywords associated with the report?
Yes, the market keyword associated with the report is "Green and Bio Polyols Market," which aids in identifying and referencing the specific market segment covered.
12. How do I determine which pricing option suits my needs best?
The pricing options vary based on user requirements and access needs. Individual users may opt for single-user licenses, while businesses requiring broader access may choose multi-user or enterprise licenses for cost-effective access to the report.
13. Are there any additional resources or data provided in the Green and Bio Polyols Market report?
While the report offers comprehensive insights, it's advisable to review the specific contents or supplementary materials provided to ascertain if additional resources or data are available.
14. How can I stay updated on further developments or reports in the Green and Bio Polyols Market?
To stay informed about further developments, trends, and reports in the Green and Bio Polyols Market, consider subscribing to industry newsletters, following relevant companies and organizations, or regularly checking reputable industry news sources and publications.
Methodology
Step 1 - Identification of Relevant Samples Size from Population Database


Step 2 - Approaches for Defining Global Market Size (Value, Volume* & Price*)

Note*: In applicable scenarios
Step 3 - Data Sources
Primary Research
- Web Analytics
- Survey Reports
- Research Institute
- Latest Research Reports
- Opinion Leaders
Secondary Research
- Annual Reports
- White Paper
- Latest Press Release
- Industry Association
- Paid Database
- Investor Presentations

Step 4 - Data Triangulation
Involves using different sources of information in order to increase the validity of a study
These sources are likely to be stakeholders in a program - participants, other researchers, program staff, other community members, and so on.
Then we put all data in single framework & apply various statistical tools to find out the dynamic on the market.
During the analysis stage, feedback from the stakeholder groups would be compared to determine areas of agreement as well as areas of divergence


