
Key Insights
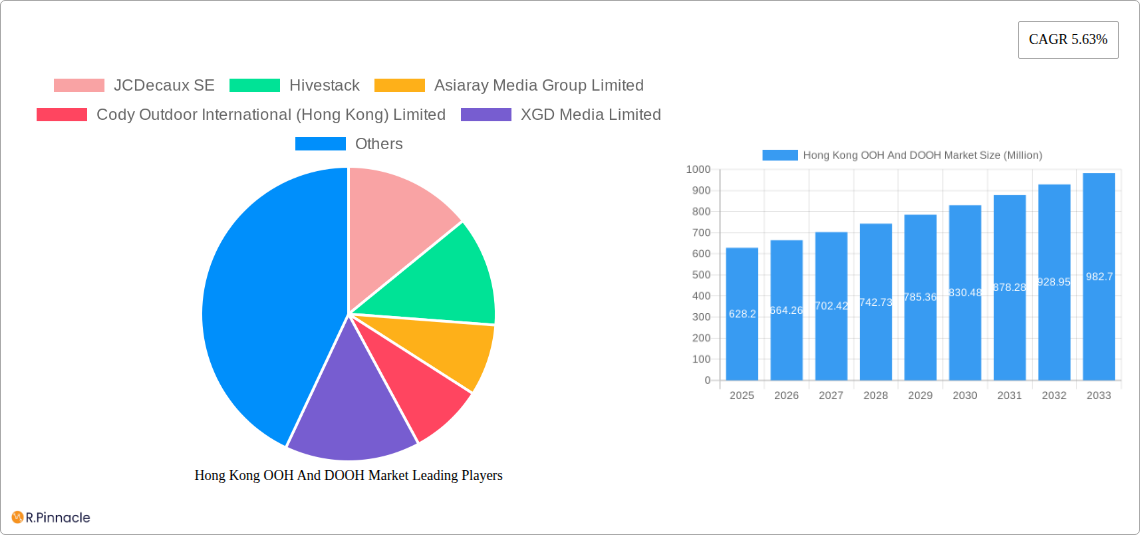
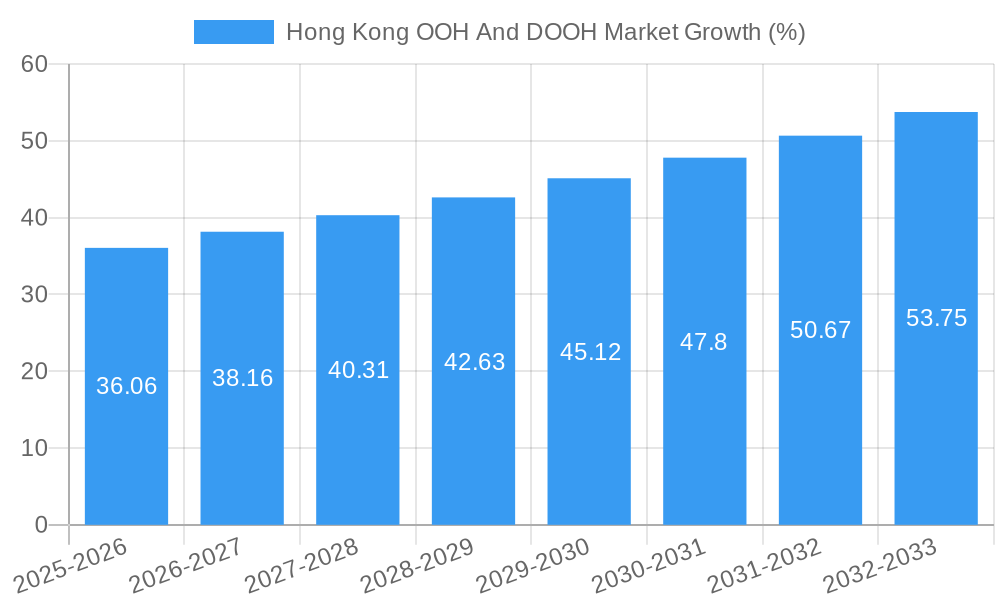
The Hong Kong Out-of-Home (OOH) and Digital Out-of-Home (DOOH) advertising market presents a robust growth opportunity, with a market size of $628.20 million in 2025 and a projected Compound Annual Growth Rate (CAGR) of 5.63% from 2025 to 2033. This expansion is fueled by several key factors. Increasing urbanization and a rising population density in Hong Kong create a highly receptive audience for OOH advertising. Furthermore, the adoption of advanced technologies, particularly in DOOH, is driving innovation and engagement. Programmatic DOOH buying, offering greater targeting and measurement capabilities, is gaining traction, attracting more advertisers and boosting market value. The strategic placement of digital screens in high-traffic locations, including shopping malls, transportation hubs, and entertainment districts, maximizes visibility and reach. However, competition from other advertising channels and the relatively high cost of premium OOH and DOOH locations present challenges to market growth. Despite these restraints, the market’s trajectory remains positive, underpinned by the continued evolution of creative advertising formats and the growing demand for data-driven, measurable OOH campaigns. Leading players like JCDecaux SE, Hivestack, and Asiaray Media Group Limited are actively shaping the market landscape through technological advancements and strategic expansions.
The Hong Kong OOH and DOOH market is segmented by advertising format (billboards, transit advertising, street furniture, etc.), location (urban, suburban), and advertiser type (retail, FMCG, entertainment, etc.). While precise segmental data is unavailable, the robust overall growth suggests strong performance across all segments. The market's historical period (2019-2024) likely saw a period of consolidation and technological adoption, setting the stage for the accelerated growth projected for the forecast period (2025-2033). The increasing focus on data analytics and audience measurement within DOOH is enhancing its effectiveness and value proposition to advertisers. This trend is expected to further fuel market growth and drive the adoption of innovative advertising technologies. The continued investment in smart city initiatives in Hong Kong further reinforces the potential for growth in the OOH and DOOH sectors.
Hong Kong OOH & DOOH Market Report: 2019-2033
This comprehensive report provides a detailed analysis of the Hong Kong Out-of-Home (OOH) and Digital Out-of-Home (DOOH) advertising market, covering the period 2019-2033. It offers invaluable insights for industry professionals, investors, and strategic planners seeking to understand market dynamics, growth opportunities, and competitive landscapes. The report leverages extensive data and expert analysis to forecast market size, identify key players, and highlight emerging trends. Base Year: 2025; Estimated Year: 2025; Forecast Period: 2025-2033; Historical Period: 2019-2024.
Hong Kong OOH And DOOH Market Market Structure & Innovation Trends
This section analyzes the competitive landscape of Hong Kong's OOH and DOOH market, examining market concentration, innovation drivers, regulatory frameworks, and M&A activities. The market is characterized by a mix of large multinational players and local agencies. JCDecaux SE, for example, holds a significant market share, while smaller companies like POADmedia Limited focus on niche segments.
- Market Concentration: The market exhibits moderate concentration, with a few dominant players and numerous smaller agencies. JCDecaux SE and Asiaray Media Group Limited likely command the largest shares, while others compete for smaller segments. Exact market share data requires further research and is not provided.
- Innovation Drivers: The increasing adoption of DOOH technology, driven by advancements in display technology and data analytics, is a major innovation driver. Programmatic buying and data-driven targeting are also transforming the industry.
- Regulatory Framework: The regulatory environment in Hong Kong impacts billboard placement, advertising content, and data privacy. Understanding and adapting to these regulations is crucial for market success.
- Product Substitutes: Digital advertising channels (online video, social media) represent the primary substitutes for OOH. However, OOH retains its unique strengths in terms of reach and brand visibility.
- End-User Demographics: The target audience for OOH and DOOH campaigns varies depending on the location and type of advertising. However, the increasingly diverse and tech-savvy population of Hong Kong presents significant opportunities.
- M&A Activities: The market has witnessed several mergers and acquisitions (M&A) deals in recent years, though precise deal values are not readily available. These activities reflect consolidation within the sector and an increasing focus on digital capabilities.
Hong Kong OOH And DOOH Market Market Dynamics & Trends
The Hong Kong OOH and DOOH market is experiencing significant growth driven by several factors. Technological advancements, such as the proliferation of smart screens and improved data analytics capabilities, are enhancing the effectiveness and targeting precision of DOOH advertising. The increasing adoption of programmatic buying is further streamlining the buying process and improving efficiency. Furthermore, shifts in consumer behavior and media consumption patterns are driving a rise in demand for visually engaging and interactive OOH and DOOH campaigns. The market's competitive dynamics are characterized by both collaboration and competition. Large multinational companies and local agencies are actively vying for market share, fostering innovation and driving down costs. The compound annual growth rate (CAGR) of the market during the forecast period (2025-2033) is predicted to be xx%, driven largely by the increasing adoption of digital formats. Market penetration of DOOH within the broader OOH market is estimated at xx% in 2025 and is projected to increase significantly by 2033.
Dominant Regions & Segments in Hong Kong OOH And DOOH Market
Hong Kong's OOH and DOOH market is geographically concentrated in high-traffic areas with significant pedestrian and vehicular movement. Major transportation hubs, commercial districts, and densely populated residential areas are particularly attractive locations for OOH and DOOH advertising placements.
- Key Drivers of Dominance:
- High Population Density: Hong Kong's densely populated urban areas provide a large potential audience for OOH and DOOH campaigns.
- Robust Infrastructure: The city's well-developed transportation network and high-rise buildings offer ample opportunities for diverse OOH and DOOH placements.
- Strong Economic Activity: A thriving economy supports significant advertising expenditure across various sectors.
- Supportive Government Policies: While not explicitly mentioned, government policies toward urban development and advertising likely influence the market.
Hong Kong OOH And DOOH Market Product Innovations
Recent product innovations in Hong Kong's OOH and DOOH market focus on enhancing audience engagement and data-driven targeting capabilities. Interactive displays, augmented reality (AR) experiences, and programmatic ad buying platforms are becoming increasingly prevalent. These developments reflect the industry's ongoing efforts to leverage technological advances to optimize campaign effectiveness and improve ROI for advertisers.
Report Scope & Segmentation Analysis
This report segments the Hong Kong OOH and DOOH market based on several factors, including advertising format (billboards, transit, street furniture, etc.), location (high streets, shopping malls, transportation hubs), and industry vertical (retail, FMCG, entertainment, etc.). Each segment exhibits different growth trajectories and competitive dynamics, reflecting the varied needs and preferences of advertisers across different industries. Growth projections for each segment vary, with DOOH formats generally exhibiting faster growth than traditional OOH.
Key Drivers of Hong Kong OOH And DOOH Market Growth
Several factors are driving growth in the Hong Kong OOH and DOOH market. The increasing adoption of DOOH technologies, supported by advancements in display technology and data analytics, enhances campaign effectiveness. Programmatic buying improves ad placement optimization and efficiency. Moreover, the vibrant economy of Hong Kong supports considerable advertising expenditure across various sectors, further stimulating market growth.
Challenges in the Hong Kong OOH And DOOH Market Sector
The Hong Kong OOH and DOOH market faces challenges such as high advertising costs, competition from digital channels, and regulatory constraints on billboard placement and content. Supply chain disruptions and potential economic downturns can also impact market growth. The limited space available for OOH advertising in densely populated areas adds to the complexities of securing prime advertising locations.
Emerging Opportunities in Hong Kong OOH And DOOH Market
Emerging opportunities include the expansion of DOOH networks in underserved areas, the integration of AR and interactive elements into OOH campaigns, and the use of data analytics to improve targeting and campaign performance. Growing adoption of programmatic buying also presents opportunities to improve efficiency. Furthermore, the rising demand for experiential marketing presents opportunities for brands to engage consumers through creative and interactive OOH experiences.
Leading Players in the Hong Kong OOH And DOOH Market Market
- JCDecaux SE
- Hivestack
- Asiaray Media Group Limited
- Cody Outdoor International (Hong Kong) Limited
- XGD Media Limited
- Dentsu
- POADmedia Limited
- VIOOH
- Vistar Media
- Displayforce
- List Not Exhaustive
Key Developments in Hong Kong OOH And DOOH Market Industry
- September 2023: KFC Hong Kong partnered with Edelman Hong Kong to launch a series of engaging billboards showcasing their new "FING FING Cajun Chips." This campaign highlights the continued relevance of traditional OOH advertising for brand building.
- January 2024: Bravo Media secured a significant contract, launching new digital ventures including digital pillar zones at MTR East Tsim Sha Tsui station and a dynamic digital impact zone at Admiralty station. This underscores the growing demand for DOOH advertising in prime locations.
Future Outlook for Hong Kong OOH And DOOH Market Market
The future of the Hong Kong OOH and DOOH market is bright, with continued growth expected over the forecast period. The increasing adoption of innovative technologies, data-driven strategies, and the expansion of DOOH networks will drive market expansion. Opportunities exist for companies to capitalize on the rising demand for creative and engaging OOH experiences, leveraging technological advancements to enhance campaign effectiveness and improve ROI. The market's growth will also be significantly influenced by economic conditions and changes in consumer behavior.
Hong Kong OOH And DOOH Market Segmentation
-
1. Type
- 1.1. Static (Traditional) OOH
-
1.2. Digital OOH (LED Screens)
- 1.2.1. Programmatic OOH
- 1.2.2. Others
-
2. Appli
- 2.1. Billboard
-
2.2. Transportation (Transit)
- 2.2.1. Airports
- 2.2.2. Others (Buses, etc.)
- 2.3. Street Furniture
- 2.4. Other Place-Based Media
-
3. End-U
- 3.1. Automotive
- 3.2. Retail and Consumer Goods
- 3.3. Healthcare
- 3.4. BFSI
- 3.5. Other End Users
Hong Kong OOH And DOOH Market Segmentation By Geography
-
1. North America
- 1.1. United States
- 1.2. Canada
- 1.3. Mexico
-
2. South America
- 2.1. Brazil
- 2.2. Argentina
- 2.3. Rest of South America
-
3. Europe
- 3.1. United Kingdom
- 3.2. Germany
- 3.3. France
- 3.4. Italy
- 3.5. Spain
- 3.6. Russia
- 3.7. Benelux
- 3.8. Nordics
- 3.9. Rest of Europe
-
4. Middle East & Africa
- 4.1. Turkey
- 4.2. Israel
- 4.3. GCC
- 4.4. North Africa
- 4.5. South Africa
- 4.6. Rest of Middle East & Africa
-
5. Asia Pacific
- 5.1. China
- 5.2. India
- 5.3. Japan
- 5.4. South Korea
- 5.5. ASEAN
- 5.6. Oceania
- 5.7. Rest of Asia Pacific
Hong Kong OOH And DOOH Market REPORT HIGHLIGHTS
| Aspects | Details |
|---|---|
| Study Period | 2019-2033 |
| Base Year | 2024 |
| Estimated Year | 2025 |
| Forecast Period | 2025-2033 |
| Historical Period | 2019-2024 |
| Growth Rate | CAGR of 5.63% from 2019-2033 |
| Segmentation |
|
Table of Contents
- 1. Introduction
- 1.1. Research Scope
- 1.2. Market Segmentation
- 1.3. Research Methodology
- 1.4. Definitions and Assumptions
- 2. Executive Summary
- 2.1. Introduction
- 3. Market Dynamics
- 3.1. Introduction
- 3.2. Market Drivers
- 3.2.1. Ongoing Shift Toward Digital Advertising; Increasing Use of Recommendation Engines
- 3.3. Market Restrains
- 3.3.1. Ongoing Shift Toward Digital Advertising; Increasing Use of Recommendation Engines
- 3.4. Market Trends
- 3.4.1. Ongoing Shift Toward Digital Advertising Expected to Boost Market Growth
- 4. Market Factor Analysis
- 4.1. Porters Five Forces
- 4.2. Supply/Value Chain
- 4.3. PESTEL analysis
- 4.4. Market Entropy
- 4.5. Patent/Trademark Analysis
- 5. Global Hong Kong OOH And DOOH Market Analysis, Insights and Forecast, 2019-2031
- 5.1. Market Analysis, Insights and Forecast - by Type
- 5.1.1. Static (Traditional) OOH
- 5.1.2. Digital OOH (LED Screens)
- 5.1.2.1. Programmatic OOH
- 5.1.2.2. Others
- 5.2. Market Analysis, Insights and Forecast - by Appli
- 5.2.1. Billboard
- 5.2.2. Transportation (Transit)
- 5.2.2.1. Airports
- 5.2.2.2. Others (Buses, etc.)
- 5.2.3. Street Furniture
- 5.2.4. Other Place-Based Media
- 5.3. Market Analysis, Insights and Forecast - by End-U
- 5.3.1. Automotive
- 5.3.2. Retail and Consumer Goods
- 5.3.3. Healthcare
- 5.3.4. BFSI
- 5.3.5. Other End Users
- 5.4. Market Analysis, Insights and Forecast - by Region
- 5.4.1. North America
- 5.4.2. South America
- 5.4.3. Europe
- 5.4.4. Middle East & Africa
- 5.4.5. Asia Pacific
- 5.1. Market Analysis, Insights and Forecast - by Type
- 6. North America Hong Kong OOH And DOOH Market Analysis, Insights and Forecast, 2019-2031
- 6.1. Market Analysis, Insights and Forecast - by Type
- 6.1.1. Static (Traditional) OOH
- 6.1.2. Digital OOH (LED Screens)
- 6.1.2.1. Programmatic OOH
- 6.1.2.2. Others
- 6.2. Market Analysis, Insights and Forecast - by Appli
- 6.2.1. Billboard
- 6.2.2. Transportation (Transit)
- 6.2.2.1. Airports
- 6.2.2.2. Others (Buses, etc.)
- 6.2.3. Street Furniture
- 6.2.4. Other Place-Based Media
- 6.3. Market Analysis, Insights and Forecast - by End-U
- 6.3.1. Automotive
- 6.3.2. Retail and Consumer Goods
- 6.3.3. Healthcare
- 6.3.4. BFSI
- 6.3.5. Other End Users
- 6.1. Market Analysis, Insights and Forecast - by Type
- 7. South America Hong Kong OOH And DOOH Market Analysis, Insights and Forecast, 2019-2031
- 7.1. Market Analysis, Insights and Forecast - by Type
- 7.1.1. Static (Traditional) OOH
- 7.1.2. Digital OOH (LED Screens)
- 7.1.2.1. Programmatic OOH
- 7.1.2.2. Others
- 7.2. Market Analysis, Insights and Forecast - by Appli
- 7.2.1. Billboard
- 7.2.2. Transportation (Transit)
- 7.2.2.1. Airports
- 7.2.2.2. Others (Buses, etc.)
- 7.2.3. Street Furniture
- 7.2.4. Other Place-Based Media
- 7.3. Market Analysis, Insights and Forecast - by End-U
- 7.3.1. Automotive
- 7.3.2. Retail and Consumer Goods
- 7.3.3. Healthcare
- 7.3.4. BFSI
- 7.3.5. Other End Users
- 7.1. Market Analysis, Insights and Forecast - by Type
- 8. Europe Hong Kong OOH And DOOH Market Analysis, Insights and Forecast, 2019-2031
- 8.1. Market Analysis, Insights and Forecast - by Type
- 8.1.1. Static (Traditional) OOH
- 8.1.2. Digital OOH (LED Screens)
- 8.1.2.1. Programmatic OOH
- 8.1.2.2. Others
- 8.2. Market Analysis, Insights and Forecast - by Appli
- 8.2.1. Billboard
- 8.2.2. Transportation (Transit)
- 8.2.2.1. Airports
- 8.2.2.2. Others (Buses, etc.)
- 8.2.3. Street Furniture
- 8.2.4. Other Place-Based Media
- 8.3. Market Analysis, Insights and Forecast - by End-U
- 8.3.1. Automotive
- 8.3.2. Retail and Consumer Goods
- 8.3.3. Healthcare
- 8.3.4. BFSI
- 8.3.5. Other End Users
- 8.1. Market Analysis, Insights and Forecast - by Type
- 9. Middle East & Africa Hong Kong OOH And DOOH Market Analysis, Insights and Forecast, 2019-2031
- 9.1. Market Analysis, Insights and Forecast - by Type
- 9.1.1. Static (Traditional) OOH
- 9.1.2. Digital OOH (LED Screens)
- 9.1.2.1. Programmatic OOH
- 9.1.2.2. Others
- 9.2. Market Analysis, Insights and Forecast - by Appli
- 9.2.1. Billboard
- 9.2.2. Transportation (Transit)
- 9.2.2.1. Airports
- 9.2.2.2. Others (Buses, etc.)
- 9.2.3. Street Furniture
- 9.2.4. Other Place-Based Media
- 9.3. Market Analysis, Insights and Forecast - by End-U
- 9.3.1. Automotive
- 9.3.2. Retail and Consumer Goods
- 9.3.3. Healthcare
- 9.3.4. BFSI
- 9.3.5. Other End Users
- 9.1. Market Analysis, Insights and Forecast - by Type
- 10. Asia Pacific Hong Kong OOH And DOOH Market Analysis, Insights and Forecast, 2019-2031
- 10.1. Market Analysis, Insights and Forecast - by Type
- 10.1.1. Static (Traditional) OOH
- 10.1.2. Digital OOH (LED Screens)
- 10.1.2.1. Programmatic OOH
- 10.1.2.2. Others
- 10.2. Market Analysis, Insights and Forecast - by Appli
- 10.2.1. Billboard
- 10.2.2. Transportation (Transit)
- 10.2.2.1. Airports
- 10.2.2.2. Others (Buses, etc.)
- 10.2.3. Street Furniture
- 10.2.4. Other Place-Based Media
- 10.3. Market Analysis, Insights and Forecast - by End-U
- 10.3.1. Automotive
- 10.3.2. Retail and Consumer Goods
- 10.3.3. Healthcare
- 10.3.4. BFSI
- 10.3.5. Other End Users
- 10.1. Market Analysis, Insights and Forecast - by Type
- 11. Competitive Analysis
- 11.1. Global Market Share Analysis 2024
- 11.2. Company Profiles
- 11.2.1 JCDecaux SE
- 11.2.1.1. Overview
- 11.2.1.2. Products
- 11.2.1.3. SWOT Analysis
- 11.2.1.4. Recent Developments
- 11.2.1.5. Financials (Based on Availability)
- 11.2.2 Hivestack
- 11.2.2.1. Overview
- 11.2.2.2. Products
- 11.2.2.3. SWOT Analysis
- 11.2.2.4. Recent Developments
- 11.2.2.5. Financials (Based on Availability)
- 11.2.3 Asiaray Media Group Limited
- 11.2.3.1. Overview
- 11.2.3.2. Products
- 11.2.3.3. SWOT Analysis
- 11.2.3.4. Recent Developments
- 11.2.3.5. Financials (Based on Availability)
- 11.2.4 Cody Outdoor International (Hong Kong) Limited
- 11.2.4.1. Overview
- 11.2.4.2. Products
- 11.2.4.3. SWOT Analysis
- 11.2.4.4. Recent Developments
- 11.2.4.5. Financials (Based on Availability)
- 11.2.5 XGD Media Limited
- 11.2.5.1. Overview
- 11.2.5.2. Products
- 11.2.5.3. SWOT Analysis
- 11.2.5.4. Recent Developments
- 11.2.5.5. Financials (Based on Availability)
- 11.2.6 Dentsu
- 11.2.6.1. Overview
- 11.2.6.2. Products
- 11.2.6.3. SWOT Analysis
- 11.2.6.4. Recent Developments
- 11.2.6.5. Financials (Based on Availability)
- 11.2.7 POADmedia Limited
- 11.2.7.1. Overview
- 11.2.7.2. Products
- 11.2.7.3. SWOT Analysis
- 11.2.7.4. Recent Developments
- 11.2.7.5. Financials (Based on Availability)
- 11.2.8 VIOOH
- 11.2.8.1. Overview
- 11.2.8.2. Products
- 11.2.8.3. SWOT Analysis
- 11.2.8.4. Recent Developments
- 11.2.8.5. Financials (Based on Availability)
- 11.2.9 Vistar Media
- 11.2.9.1. Overview
- 11.2.9.2. Products
- 11.2.9.3. SWOT Analysis
- 11.2.9.4. Recent Developments
- 11.2.9.5. Financials (Based on Availability)
- 11.2.10 Displayforce*List Not Exhaustive
- 11.2.10.1. Overview
- 11.2.10.2. Products
- 11.2.10.3. SWOT Analysis
- 11.2.10.4. Recent Developments
- 11.2.10.5. Financials (Based on Availability)
- 11.2.1 JCDecaux SE
List of Figures
- Figure 1: Global Hong Kong OOH And DOOH Market Revenue Breakdown (Million, %) by Region 2024 & 2032
- Figure 2: Global Hong Kong OOH And DOOH Market Volume Breakdown (Million, %) by Region 2024 & 2032
- Figure 3: North America Hong Kong OOH And DOOH Market Revenue (Million), by Type 2024 & 2032
- Figure 4: North America Hong Kong OOH And DOOH Market Volume (Million), by Type 2024 & 2032
- Figure 5: North America Hong Kong OOH And DOOH Market Revenue Share (%), by Type 2024 & 2032
- Figure 6: North America Hong Kong OOH And DOOH Market Volume Share (%), by Type 2024 & 2032
- Figure 7: North America Hong Kong OOH And DOOH Market Revenue (Million), by Appli 2024 & 2032
- Figure 8: North America Hong Kong OOH And DOOH Market Volume (Million), by Appli 2024 & 2032
- Figure 9: North America Hong Kong OOH And DOOH Market Revenue Share (%), by Appli 2024 & 2032
- Figure 10: North America Hong Kong OOH And DOOH Market Volume Share (%), by Appli 2024 & 2032
- Figure 11: North America Hong Kong OOH And DOOH Market Revenue (Million), by End-U 2024 & 2032
- Figure 12: North America Hong Kong OOH And DOOH Market Volume (Million), by End-U 2024 & 2032
- Figure 13: North America Hong Kong OOH And DOOH Market Revenue Share (%), by End-U 2024 & 2032
- Figure 14: North America Hong Kong OOH And DOOH Market Volume Share (%), by End-U 2024 & 2032
- Figure 15: North America Hong Kong OOH And DOOH Market Revenue (Million), by Country 2024 & 2032
- Figure 16: North America Hong Kong OOH And DOOH Market Volume (Million), by Country 2024 & 2032
- Figure 17: North America Hong Kong OOH And DOOH Market Revenue Share (%), by Country 2024 & 2032
- Figure 18: North America Hong Kong OOH And DOOH Market Volume Share (%), by Country 2024 & 2032
- Figure 19: South America Hong Kong OOH And DOOH Market Revenue (Million), by Type 2024 & 2032
- Figure 20: South America Hong Kong OOH And DOOH Market Volume (Million), by Type 2024 & 2032
- Figure 21: South America Hong Kong OOH And DOOH Market Revenue Share (%), by Type 2024 & 2032
- Figure 22: South America Hong Kong OOH And DOOH Market Volume Share (%), by Type 2024 & 2032
- Figure 23: South America Hong Kong OOH And DOOH Market Revenue (Million), by Appli 2024 & 2032
- Figure 24: South America Hong Kong OOH And DOOH Market Volume (Million), by Appli 2024 & 2032
- Figure 25: South America Hong Kong OOH And DOOH Market Revenue Share (%), by Appli 2024 & 2032
- Figure 26: South America Hong Kong OOH And DOOH Market Volume Share (%), by Appli 2024 & 2032
- Figure 27: South America Hong Kong OOH And DOOH Market Revenue (Million), by End-U 2024 & 2032
- Figure 28: South America Hong Kong OOH And DOOH Market Volume (Million), by End-U 2024 & 2032
- Figure 29: South America Hong Kong OOH And DOOH Market Revenue Share (%), by End-U 2024 & 2032
- Figure 30: South America Hong Kong OOH And DOOH Market Volume Share (%), by End-U 2024 & 2032
- Figure 31: South America Hong Kong OOH And DOOH Market Revenue (Million), by Country 2024 & 2032
- Figure 32: South America Hong Kong OOH And DOOH Market Volume (Million), by Country 2024 & 2032
- Figure 33: South America Hong Kong OOH And DOOH Market Revenue Share (%), by Country 2024 & 2032
- Figure 34: South America Hong Kong OOH And DOOH Market Volume Share (%), by Country 2024 & 2032
- Figure 35: Europe Hong Kong OOH And DOOH Market Revenue (Million), by Type 2024 & 2032
- Figure 36: Europe Hong Kong OOH And DOOH Market Volume (Million), by Type 2024 & 2032
- Figure 37: Europe Hong Kong OOH And DOOH Market Revenue Share (%), by Type 2024 & 2032
- Figure 38: Europe Hong Kong OOH And DOOH Market Volume Share (%), by Type 2024 & 2032
- Figure 39: Europe Hong Kong OOH And DOOH Market Revenue (Million), by Appli 2024 & 2032
- Figure 40: Europe Hong Kong OOH And DOOH Market Volume (Million), by Appli 2024 & 2032
- Figure 41: Europe Hong Kong OOH And DOOH Market Revenue Share (%), by Appli 2024 & 2032
- Figure 42: Europe Hong Kong OOH And DOOH Market Volume Share (%), by Appli 2024 & 2032
- Figure 43: Europe Hong Kong OOH And DOOH Market Revenue (Million), by End-U 2024 & 2032
- Figure 44: Europe Hong Kong OOH And DOOH Market Volume (Million), by End-U 2024 & 2032
- Figure 45: Europe Hong Kong OOH And DOOH Market Revenue Share (%), by End-U 2024 & 2032
- Figure 46: Europe Hong Kong OOH And DOOH Market Volume Share (%), by End-U 2024 & 2032
- Figure 47: Europe Hong Kong OOH And DOOH Market Revenue (Million), by Country 2024 & 2032
- Figure 48: Europe Hong Kong OOH And DOOH Market Volume (Million), by Country 2024 & 2032
- Figure 49: Europe Hong Kong OOH And DOOH Market Revenue Share (%), by Country 2024 & 2032
- Figure 50: Europe Hong Kong OOH And DOOH Market Volume Share (%), by Country 2024 & 2032
- Figure 51: Middle East & Africa Hong Kong OOH And DOOH Market Revenue (Million), by Type 2024 & 2032
- Figure 52: Middle East & Africa Hong Kong OOH And DOOH Market Volume (Million), by Type 2024 & 2032
- Figure 53: Middle East & Africa Hong Kong OOH And DOOH Market Revenue Share (%), by Type 2024 & 2032
- Figure 54: Middle East & Africa Hong Kong OOH And DOOH Market Volume Share (%), by Type 2024 & 2032
- Figure 55: Middle East & Africa Hong Kong OOH And DOOH Market Revenue (Million), by Appli 2024 & 2032
- Figure 56: Middle East & Africa Hong Kong OOH And DOOH Market Volume (Million), by Appli 2024 & 2032
- Figure 57: Middle East & Africa Hong Kong OOH And DOOH Market Revenue Share (%), by Appli 2024 & 2032
- Figure 58: Middle East & Africa Hong Kong OOH And DOOH Market Volume Share (%), by Appli 2024 & 2032
- Figure 59: Middle East & Africa Hong Kong OOH And DOOH Market Revenue (Million), by End-U 2024 & 2032
- Figure 60: Middle East & Africa Hong Kong OOH And DOOH Market Volume (Million), by End-U 2024 & 2032
- Figure 61: Middle East & Africa Hong Kong OOH And DOOH Market Revenue Share (%), by End-U 2024 & 2032
- Figure 62: Middle East & Africa Hong Kong OOH And DOOH Market Volume Share (%), by End-U 2024 & 2032
- Figure 63: Middle East & Africa Hong Kong OOH And DOOH Market Revenue (Million), by Country 2024 & 2032
- Figure 64: Middle East & Africa Hong Kong OOH And DOOH Market Volume (Million), by Country 2024 & 2032
- Figure 65: Middle East & Africa Hong Kong OOH And DOOH Market Revenue Share (%), by Country 2024 & 2032
- Figure 66: Middle East & Africa Hong Kong OOH And DOOH Market Volume Share (%), by Country 2024 & 2032
- Figure 67: Asia Pacific Hong Kong OOH And DOOH Market Revenue (Million), by Type 2024 & 2032
- Figure 68: Asia Pacific Hong Kong OOH And DOOH Market Volume (Million), by Type 2024 & 2032
- Figure 69: Asia Pacific Hong Kong OOH And DOOH Market Revenue Share (%), by Type 2024 & 2032
- Figure 70: Asia Pacific Hong Kong OOH And DOOH Market Volume Share (%), by Type 2024 & 2032
- Figure 71: Asia Pacific Hong Kong OOH And DOOH Market Revenue (Million), by Appli 2024 & 2032
- Figure 72: Asia Pacific Hong Kong OOH And DOOH Market Volume (Million), by Appli 2024 & 2032
- Figure 73: Asia Pacific Hong Kong OOH And DOOH Market Revenue Share (%), by Appli 2024 & 2032
- Figure 74: Asia Pacific Hong Kong OOH And DOOH Market Volume Share (%), by Appli 2024 & 2032
- Figure 75: Asia Pacific Hong Kong OOH And DOOH Market Revenue (Million), by End-U 2024 & 2032
- Figure 76: Asia Pacific Hong Kong OOH And DOOH Market Volume (Million), by End-U 2024 & 2032
- Figure 77: Asia Pacific Hong Kong OOH And DOOH Market Revenue Share (%), by End-U 2024 & 2032
- Figure 78: Asia Pacific Hong Kong OOH And DOOH Market Volume Share (%), by End-U 2024 & 2032
- Figure 79: Asia Pacific Hong Kong OOH And DOOH Market Revenue (Million), by Country 2024 & 2032
- Figure 80: Asia Pacific Hong Kong OOH And DOOH Market Volume (Million), by Country 2024 & 2032
- Figure 81: Asia Pacific Hong Kong OOH And DOOH Market Revenue Share (%), by Country 2024 & 2032
- Figure 82: Asia Pacific Hong Kong OOH And DOOH Market Volume Share (%), by Country 2024 & 2032
List of Tables
- Table 1: Global Hong Kong OOH And DOOH Market Revenue Million Forecast, by Region 2019 & 2032
- Table 2: Global Hong Kong OOH And DOOH Market Volume Million Forecast, by Region 2019 & 2032
- Table 3: Global Hong Kong OOH And DOOH Market Revenue Million Forecast, by Type 2019 & 2032
- Table 4: Global Hong Kong OOH And DOOH Market Volume Million Forecast, by Type 2019 & 2032
- Table 5: Global Hong Kong OOH And DOOH Market Revenue Million Forecast, by Appli 2019 & 2032
- Table 6: Global Hong Kong OOH And DOOH Market Volume Million Forecast, by Appli 2019 & 2032
- Table 7: Global Hong Kong OOH And DOOH Market Revenue Million Forecast, by End-U 2019 & 2032
- Table 8: Global Hong Kong OOH And DOOH Market Volume Million Forecast, by End-U 2019 & 2032
- Table 9: Global Hong Kong OOH And DOOH Market Revenue Million Forecast, by Region 2019 & 2032
- Table 10: Global Hong Kong OOH And DOOH Market Volume Million Forecast, by Region 2019 & 2032
- Table 11: Global Hong Kong OOH And DOOH Market Revenue Million Forecast, by Type 2019 & 2032
- Table 12: Global Hong Kong OOH And DOOH Market Volume Million Forecast, by Type 2019 & 2032
- Table 13: Global Hong Kong OOH And DOOH Market Revenue Million Forecast, by Appli 2019 & 2032
- Table 14: Global Hong Kong OOH And DOOH Market Volume Million Forecast, by Appli 2019 & 2032
- Table 15: Global Hong Kong OOH And DOOH Market Revenue Million Forecast, by End-U 2019 & 2032
- Table 16: Global Hong Kong OOH And DOOH Market Volume Million Forecast, by End-U 2019 & 2032
- Table 17: Global Hong Kong OOH And DOOH Market Revenue Million Forecast, by Country 2019 & 2032
- Table 18: Global Hong Kong OOH And DOOH Market Volume Million Forecast, by Country 2019 & 2032
- Table 19: United States Hong Kong OOH And DOOH Market Revenue (Million) Forecast, by Application 2019 & 2032
- Table 20: United States Hong Kong OOH And DOOH Market Volume (Million) Forecast, by Application 2019 & 2032
- Table 21: Canada Hong Kong OOH And DOOH Market Revenue (Million) Forecast, by Application 2019 & 2032
- Table 22: Canada Hong Kong OOH And DOOH Market Volume (Million) Forecast, by Application 2019 & 2032
- Table 23: Mexico Hong Kong OOH And DOOH Market Revenue (Million) Forecast, by Application 2019 & 2032
- Table 24: Mexico Hong Kong OOH And DOOH Market Volume (Million) Forecast, by Application 2019 & 2032
- Table 25: Global Hong Kong OOH And DOOH Market Revenue Million Forecast, by Type 2019 & 2032
- Table 26: Global Hong Kong OOH And DOOH Market Volume Million Forecast, by Type 2019 & 2032
- Table 27: Global Hong Kong OOH And DOOH Market Revenue Million Forecast, by Appli 2019 & 2032
- Table 28: Global Hong Kong OOH And DOOH Market Volume Million Forecast, by Appli 2019 & 2032
- Table 29: Global Hong Kong OOH And DOOH Market Revenue Million Forecast, by End-U 2019 & 2032
- Table 30: Global Hong Kong OOH And DOOH Market Volume Million Forecast, by End-U 2019 & 2032
- Table 31: Global Hong Kong OOH And DOOH Market Revenue Million Forecast, by Country 2019 & 2032
- Table 32: Global Hong Kong OOH And DOOH Market Volume Million Forecast, by Country 2019 & 2032
- Table 33: Brazil Hong Kong OOH And DOOH Market Revenue (Million) Forecast, by Application 2019 & 2032
- Table 34: Brazil Hong Kong OOH And DOOH Market Volume (Million) Forecast, by Application 2019 & 2032
- Table 35: Argentina Hong Kong OOH And DOOH Market Revenue (Million) Forecast, by Application 2019 & 2032
- Table 36: Argentina Hong Kong OOH And DOOH Market Volume (Million) Forecast, by Application 2019 & 2032
- Table 37: Rest of South America Hong Kong OOH And DOOH Market Revenue (Million) Forecast, by Application 2019 & 2032
- Table 38: Rest of South America Hong Kong OOH And DOOH Market Volume (Million) Forecast, by Application 2019 & 2032
- Table 39: Global Hong Kong OOH And DOOH Market Revenue Million Forecast, by Type 2019 & 2032
- Table 40: Global Hong Kong OOH And DOOH Market Volume Million Forecast, by Type 2019 & 2032
- Table 41: Global Hong Kong OOH And DOOH Market Revenue Million Forecast, by Appli 2019 & 2032
- Table 42: Global Hong Kong OOH And DOOH Market Volume Million Forecast, by Appli 2019 & 2032
- Table 43: Global Hong Kong OOH And DOOH Market Revenue Million Forecast, by End-U 2019 & 2032
- Table 44: Global Hong Kong OOH And DOOH Market Volume Million Forecast, by End-U 2019 & 2032
- Table 45: Global Hong Kong OOH And DOOH Market Revenue Million Forecast, by Country 2019 & 2032
- Table 46: Global Hong Kong OOH And DOOH Market Volume Million Forecast, by Country 2019 & 2032
- Table 47: United Kingdom Hong Kong OOH And DOOH Market Revenue (Million) Forecast, by Application 2019 & 2032
- Table 48: United Kingdom Hong Kong OOH And DOOH Market Volume (Million) Forecast, by Application 2019 & 2032
- Table 49: Germany Hong Kong OOH And DOOH Market Revenue (Million) Forecast, by Application 2019 & 2032
- Table 50: Germany Hong Kong OOH And DOOH Market Volume (Million) Forecast, by Application 2019 & 2032
- Table 51: France Hong Kong OOH And DOOH Market Revenue (Million) Forecast, by Application 2019 & 2032
- Table 52: France Hong Kong OOH And DOOH Market Volume (Million) Forecast, by Application 2019 & 2032
- Table 53: Italy Hong Kong OOH And DOOH Market Revenue (Million) Forecast, by Application 2019 & 2032
- Table 54: Italy Hong Kong OOH And DOOH Market Volume (Million) Forecast, by Application 2019 & 2032
- Table 55: Spain Hong Kong OOH And DOOH Market Revenue (Million) Forecast, by Application 2019 & 2032
- Table 56: Spain Hong Kong OOH And DOOH Market Volume (Million) Forecast, by Application 2019 & 2032
- Table 57: Russia Hong Kong OOH And DOOH Market Revenue (Million) Forecast, by Application 2019 & 2032
- Table 58: Russia Hong Kong OOH And DOOH Market Volume (Million) Forecast, by Application 2019 & 2032
- Table 59: Benelux Hong Kong OOH And DOOH Market Revenue (Million) Forecast, by Application 2019 & 2032
- Table 60: Benelux Hong Kong OOH And DOOH Market Volume (Million) Forecast, by Application 2019 & 2032
- Table 61: Nordics Hong Kong OOH And DOOH Market Revenue (Million) Forecast, by Application 2019 & 2032
- Table 62: Nordics Hong Kong OOH And DOOH Market Volume (Million) Forecast, by Application 2019 & 2032
- Table 63: Rest of Europe Hong Kong OOH And DOOH Market Revenue (Million) Forecast, by Application 2019 & 2032
- Table 64: Rest of Europe Hong Kong OOH And DOOH Market Volume (Million) Forecast, by Application 2019 & 2032
- Table 65: Global Hong Kong OOH And DOOH Market Revenue Million Forecast, by Type 2019 & 2032
- Table 66: Global Hong Kong OOH And DOOH Market Volume Million Forecast, by Type 2019 & 2032
- Table 67: Global Hong Kong OOH And DOOH Market Revenue Million Forecast, by Appli 2019 & 2032
- Table 68: Global Hong Kong OOH And DOOH Market Volume Million Forecast, by Appli 2019 & 2032
- Table 69: Global Hong Kong OOH And DOOH Market Revenue Million Forecast, by End-U 2019 & 2032
- Table 70: Global Hong Kong OOH And DOOH Market Volume Million Forecast, by End-U 2019 & 2032
- Table 71: Global Hong Kong OOH And DOOH Market Revenue Million Forecast, by Country 2019 & 2032
- Table 72: Global Hong Kong OOH And DOOH Market Volume Million Forecast, by Country 2019 & 2032
- Table 73: Turkey Hong Kong OOH And DOOH Market Revenue (Million) Forecast, by Application 2019 & 2032
- Table 74: Turkey Hong Kong OOH And DOOH Market Volume (Million) Forecast, by Application 2019 & 2032
- Table 75: Israel Hong Kong OOH And DOOH Market Revenue (Million) Forecast, by Application 2019 & 2032
- Table 76: Israel Hong Kong OOH And DOOH Market Volume (Million) Forecast, by Application 2019 & 2032
- Table 77: GCC Hong Kong OOH And DOOH Market Revenue (Million) Forecast, by Application 2019 & 2032
- Table 78: GCC Hong Kong OOH And DOOH Market Volume (Million) Forecast, by Application 2019 & 2032
- Table 79: North Africa Hong Kong OOH And DOOH Market Revenue (Million) Forecast, by Application 2019 & 2032
- Table 80: North Africa Hong Kong OOH And DOOH Market Volume (Million) Forecast, by Application 2019 & 2032
- Table 81: South Africa Hong Kong OOH And DOOH Market Revenue (Million) Forecast, by Application 2019 & 2032
- Table 82: South Africa Hong Kong OOH And DOOH Market Volume (Million) Forecast, by Application 2019 & 2032
- Table 83: Rest of Middle East & Africa Hong Kong OOH And DOOH Market Revenue (Million) Forecast, by Application 2019 & 2032
- Table 84: Rest of Middle East & Africa Hong Kong OOH And DOOH Market Volume (Million) Forecast, by Application 2019 & 2032
- Table 85: Global Hong Kong OOH And DOOH Market Revenue Million Forecast, by Type 2019 & 2032
- Table 86: Global Hong Kong OOH And DOOH Market Volume Million Forecast, by Type 2019 & 2032
- Table 87: Global Hong Kong OOH And DOOH Market Revenue Million Forecast, by Appli 2019 & 2032
- Table 88: Global Hong Kong OOH And DOOH Market Volume Million Forecast, by Appli 2019 & 2032
- Table 89: Global Hong Kong OOH And DOOH Market Revenue Million Forecast, by End-U 2019 & 2032
- Table 90: Global Hong Kong OOH And DOOH Market Volume Million Forecast, by End-U 2019 & 2032
- Table 91: Global Hong Kong OOH And DOOH Market Revenue Million Forecast, by Country 2019 & 2032
- Table 92: Global Hong Kong OOH And DOOH Market Volume Million Forecast, by Country 2019 & 2032
- Table 93: China Hong Kong OOH And DOOH Market Revenue (Million) Forecast, by Application 2019 & 2032
- Table 94: China Hong Kong OOH And DOOH Market Volume (Million) Forecast, by Application 2019 & 2032
- Table 95: India Hong Kong OOH And DOOH Market Revenue (Million) Forecast, by Application 2019 & 2032
- Table 96: India Hong Kong OOH And DOOH Market Volume (Million) Forecast, by Application 2019 & 2032
- Table 97: Japan Hong Kong OOH And DOOH Market Revenue (Million) Forecast, by Application 2019 & 2032
- Table 98: Japan Hong Kong OOH And DOOH Market Volume (Million) Forecast, by Application 2019 & 2032
- Table 99: South Korea Hong Kong OOH And DOOH Market Revenue (Million) Forecast, by Application 2019 & 2032
- Table 100: South Korea Hong Kong OOH And DOOH Market Volume (Million) Forecast, by Application 2019 & 2032
- Table 101: ASEAN Hong Kong OOH And DOOH Market Revenue (Million) Forecast, by Application 2019 & 2032
- Table 102: ASEAN Hong Kong OOH And DOOH Market Volume (Million) Forecast, by Application 2019 & 2032
- Table 103: Oceania Hong Kong OOH And DOOH Market Revenue (Million) Forecast, by Application 2019 & 2032
- Table 104: Oceania Hong Kong OOH And DOOH Market Volume (Million) Forecast, by Application 2019 & 2032
- Table 105: Rest of Asia Pacific Hong Kong OOH And DOOH Market Revenue (Million) Forecast, by Application 2019 & 2032
- Table 106: Rest of Asia Pacific Hong Kong OOH And DOOH Market Volume (Million) Forecast, by Application 2019 & 2032
Frequently Asked Questions
1. What is the projected Compound Annual Growth Rate (CAGR) of the Hong Kong OOH And DOOH Market?
The projected CAGR is approximately 5.63%.
2. Which companies are prominent players in the Hong Kong OOH And DOOH Market?
Key companies in the market include JCDecaux SE, Hivestack, Asiaray Media Group Limited, Cody Outdoor International (Hong Kong) Limited, XGD Media Limited, Dentsu, POADmedia Limited, VIOOH, Vistar Media, Displayforce*List Not Exhaustive.
3. What are the main segments of the Hong Kong OOH And DOOH Market?
The market segments include Type , Appli, End-U.
4. Can you provide details about the market size?
The market size is estimated to be USD 628.20 Million as of 2022.
5. What are some drivers contributing to market growth?
Ongoing Shift Toward Digital Advertising; Increasing Use of Recommendation Engines.
6. What are the notable trends driving market growth?
Ongoing Shift Toward Digital Advertising Expected to Boost Market Growth.
7. Are there any restraints impacting market growth?
Ongoing Shift Toward Digital Advertising; Increasing Use of Recommendation Engines.
8. Can you provide examples of recent developments in the market?
January 2024: Bravo Media, an out-of-home media agency based in Hong Kong, is responding to the surging demand for digital formats by unveiling new digital ventures. These include digital pillar zones at MTR East Tsim Sha Tsui station and a dynamic digital impact zone at Admiralty station. This strategic move not only signifies a significant contract win for Bravo Media but also underlines its growing dominance in Hong Kong's out-of-home advertising landscape.
9. What pricing options are available for accessing the report?
Pricing options include single-user, multi-user, and enterprise licenses priced at USD 3800, USD 4500, and USD 5800 respectively.
10. Is the market size provided in terms of value or volume?
The market size is provided in terms of value, measured in Million and volume, measured in Million.
11. Are there any specific market keywords associated with the report?
Yes, the market keyword associated with the report is "Hong Kong OOH And DOOH Market," which aids in identifying and referencing the specific market segment covered.
12. How do I determine which pricing option suits my needs best?
The pricing options vary based on user requirements and access needs. Individual users may opt for single-user licenses, while businesses requiring broader access may choose multi-user or enterprise licenses for cost-effective access to the report.
13. Are there any additional resources or data provided in the Hong Kong OOH And DOOH Market report?
While the report offers comprehensive insights, it's advisable to review the specific contents or supplementary materials provided to ascertain if additional resources or data are available.
14. How can I stay updated on further developments or reports in the Hong Kong OOH And DOOH Market?
To stay informed about further developments, trends, and reports in the Hong Kong OOH And DOOH Market, consider subscribing to industry newsletters, following relevant companies and organizations, or regularly checking reputable industry news sources and publications.
Methodology
Step 1 - Identification of Relevant Samples Size from Population Database


Step 2 - Approaches for Defining Global Market Size (Value, Volume* & Price*)

Note*: In applicable scenarios
Step 3 - Data Sources
Primary Research
- Web Analytics
- Survey Reports
- Research Institute
- Latest Research Reports
- Opinion Leaders
Secondary Research
- Annual Reports
- White Paper
- Latest Press Release
- Industry Association
- Paid Database
- Investor Presentations

Step 4 - Data Triangulation
Involves using different sources of information in order to increase the validity of a study
These sources are likely to be stakeholders in a program - participants, other researchers, program staff, other community members, and so on.
Then we put all data in single framework & apply various statistical tools to find out the dynamic on the market.
During the analysis stage, feedback from the stakeholder groups would be compared to determine areas of agreement as well as areas of divergence


