
Key Insights
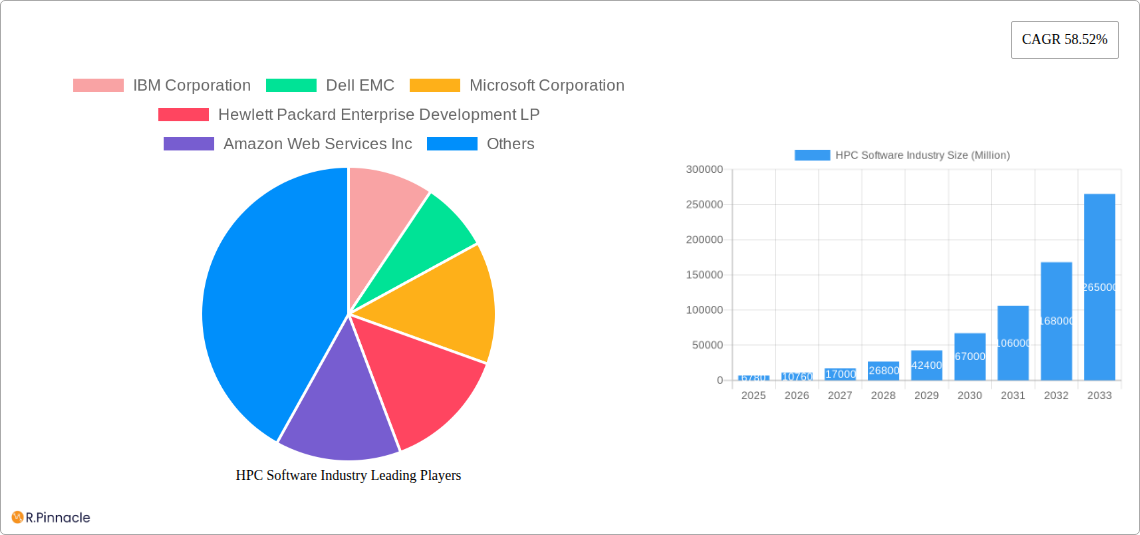
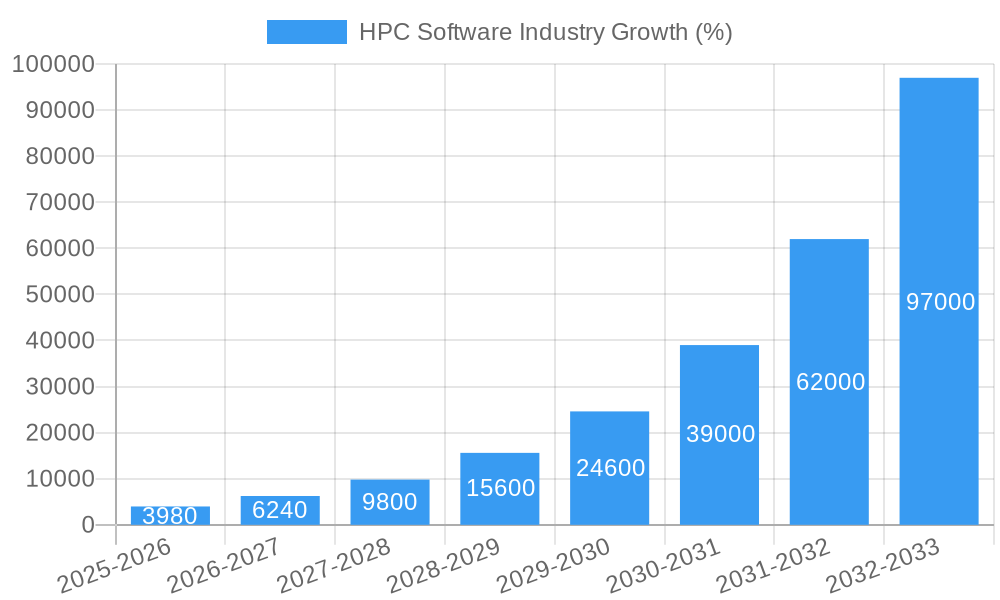
The HPC Software market is experiencing explosive growth, projected to reach \$6.78 billion in 2025 and exhibiting a remarkable Compound Annual Growth Rate (CAGR) of 58.52% from 2025 to 2033. This surge is driven by several key factors. Firstly, the increasing demand for high-performance computing across diverse sectors such as aerospace & defense (simulations for aircraft design and missile trajectory), energy & utilities (optimizing power grids and exploring renewable energy sources), BFSI (fraud detection and risk management), media & entertainment (high-quality visual effects and animation), and life sciences & healthcare (drug discovery and genomic analysis) fuels significant adoption. Furthermore, advancements in cloud computing are enabling organizations of all sizes to access powerful HPC resources without significant upfront investments, propelling market expansion. The shift towards cloud-based deployment, offering scalability and cost-effectiveness, is a major trend. However, the market faces challenges like the complexity of HPC software, the need for specialized skills, and high initial investment costs, particularly for on-premise deployments. Nevertheless, the overwhelming benefits in terms of improved efficiency, enhanced decision-making, and accelerated innovation are expected to outweigh these constraints, ensuring sustained growth throughout the forecast period.
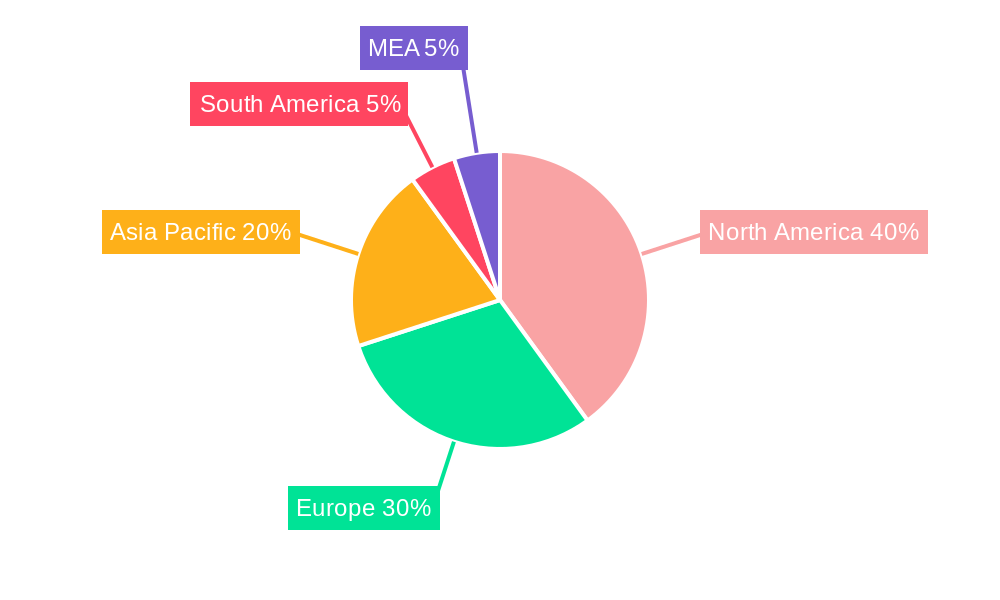
The geographical distribution of the market reveals North America as a dominant player, driven by strong technological advancements and substantial investments in HPC infrastructure. Europe follows closely, propelled by the growing adoption of HPC in various industries. The Asia-Pacific region is expected to witness significant growth in the coming years, fueled by increasing government initiatives and rising technological adoption in countries like China and India. While the South American and MEA markets are relatively smaller, they are poised for expansion due to rising investments in infrastructure and growing awareness of HPC capabilities. The segmentation by deployment type reveals a strong preference for cloud-based solutions, particularly among smaller organizations, although on-premise deployments will continue to play a significant role for organizations with stringent security requirements or large datasets. The competitive landscape is characterized by major players such as IBM, Dell EMC, Microsoft, and others, each vying for market share through innovation and strategic partnerships.
HPC Software Industry: Market Analysis & Forecast (2019-2033)
This comprehensive report provides a detailed analysis of the High-Performance Computing (HPC) software market, offering invaluable insights for industry professionals, investors, and strategic decision-makers. The report covers the period from 2019 to 2033, with a base year of 2025 and a forecast period from 2025 to 2033. The market is segmented by industrial application (Aerospace & Defense, Energy & Utilities, BFSI, Media & Entertainment, Manufacturing, Life-science & Healthcare, Design & Engineering, Other Industrial Applications) and deployment type (On-premise, Cloud). Key players analyzed include IBM Corporation, Dell EMC, Microsoft Corporation, Hewlett Packard Enterprise Development LP, Amazon Web Services Inc, ANSYS Inc, Oracle Corporation, Google Inc, Intel Corporation, and Dassault Systemes. The report's value is in its detailed market sizing, forecast, and analysis, providing actionable intelligence for navigating this rapidly evolving landscape. The market is projected to reach xx Million by 2033.
HPC Software Industry Market Structure & Innovation Trends
The HPC software market is characterized by a moderately concentrated structure with several major players holding significant market share. IBM Corporation, Microsoft Corporation, and Hewlett Packard Enterprise Development LP are among the leading players, each commanding a substantial portion (xx%) of the global market in 2025. However, the market exhibits significant dynamism, driven by continuous innovation in areas like artificial intelligence (AI), machine learning (ML), and high-performance computing (HPC). The regulatory landscape varies across regions, influencing market access and compliance requirements. Product substitution is primarily driven by advancements in cloud-based solutions and open-source alternatives. The end-user demographic spans diverse industries, with a strong focus on sectors like Aerospace & Defense, Energy & Utilities, and BFSI. Mergers and acquisitions (M&A) activity has been significant, with recent deals valued at xx Million, primarily aimed at expanding product portfolios and geographical reach. For example, a recent major acquisition valued at USD xx Million indicates significant consolidation in the market.
- Market Concentration: Moderately Concentrated
- Key Players' Market Share (2025): IBM (xx%), Microsoft (xx%), HPE (xx%)
- M&A Deal Value (Recent years): xx Million USD
- Innovation Drivers: AI, ML, Cloud Computing
HPC Software Industry Market Dynamics & Trends
The HPC software market is experiencing robust growth, driven by factors such as increasing demand for data analytics, the proliferation of big data, and the rising adoption of cloud-based HPC solutions. The Compound Annual Growth Rate (CAGR) during the forecast period (2025-2033) is estimated to be xx%. Technological advancements, particularly in areas like parallel processing and distributed computing, are significantly shaping the market. Consumer preferences are shifting towards cloud-based solutions due to their scalability, cost-effectiveness, and ease of access. Competitive dynamics are intense, with existing players investing heavily in R&D and strategic partnerships to maintain market share. Market penetration of cloud-based HPC solutions is projected to reach xx% by 2033. The shift towards hybrid cloud environments is creating opportunities for both on-premise and cloud providers, with a high CAGR predicted for this segment (xx%).
Dominant Regions & Segments in HPC Software Industry
North America currently dominates the HPC software market, driven by robust government funding for R&D, a strong presence of major technology companies, and a well-established IT infrastructure. Within the industrial applications segment, Aerospace & Defense and Life-science & Healthcare demonstrate the highest growth potential due to their increasing reliance on advanced simulations and data analysis. In terms of deployment, the cloud segment is expected to witness the fastest growth, driven by rising adoption of cloud-based HPC services.
- Leading Region: North America
- Fastest-Growing Segments:
- By Industrial Application: Aerospace & Defense, Life-science & Healthcare
- By Deployment Type: Cloud
- Key Drivers:
- Robust R&D funding (North America)
- Growing demand for data analytics across industries
- Increasing adoption of cloud-based solutions
HPC Software Industry Product Innovations
Recent advancements in HPC software include the development of more efficient parallel computing frameworks, optimized compilers for advanced architectures, and improved tools for data visualization and analysis. These innovations enhance performance, scalability, and usability, enabling more complex simulations and data-driven insights. The focus is on developing user-friendly interfaces and integrating AI/ML capabilities to simplify the adoption of HPC solutions across various industries. This enhances market fit by enabling non-specialists to access the power of HPC.
Report Scope & Segmentation Analysis
This report segments the HPC software market by industrial application (Aerospace & Defense, Energy & Utilities, BFSI, Media & Entertainment, Manufacturing, Life-science & Healthcare, Design & Engineering, Other Industrial Applications) and deployment type (On-premise, Cloud). Each segment's growth is analyzed, considering market size, competitive dynamics, and future projections. For example, the Aerospace & Defense segment exhibits high growth due to the increasing use of HPC in aircraft and weapon system design, while the Cloud segment is characterized by high competition and rapid innovation. Detailed market size estimations for each segment are provided for the historical period (2019-2024), base year (2025), and forecast period (2025-2033).
Key Drivers of HPC Software Industry Growth
The growth of the HPC software market is fueled by several key factors, including the exponential growth of data, increasing demand for faster processing speeds and more sophisticated algorithms, and governmental initiatives promoting the adoption of HPC technologies in various sectors. Advances in parallel computing and cloud computing also contribute significantly. Furthermore, stringent regulatory requirements in industries like finance and healthcare are driving the adoption of HPC solutions for compliance and risk management.
Challenges in the HPC Software Industry Sector
The HPC software industry faces challenges such as the high cost of development and deployment, the complexity of managing and maintaining HPC systems, and the need for skilled professionals. Supply chain disruptions impacting hardware components can lead to delays and increased costs. Intense competition among established and emerging players also poses a challenge. These factors can limit the market penetration of HPC solutions, particularly in smaller companies or developing economies. Furthermore, regulatory hurdles regarding data privacy and security can impact market growth.
Emerging Opportunities in HPC Software Industry
Emerging opportunities lie in the growing adoption of HPC in new industries such as genomics and personalized medicine. The convergence of HPC and AI/ML presents opportunities for developing more intelligent and efficient solutions. Furthermore, the increasing demand for edge computing and the development of specialized HPC hardware will create new market segments and opportunities for innovation. Focus on user-friendly software and integrated workflows can drive broader adoption.
Leading Players in the HPC Software Industry Market
- IBM Corporation
- Dell EMC
- Microsoft Corporation
- Hewlett Packard Enterprise Development LP
- Amazon Web Services Inc
- ANSYS Inc
- Oracle Corporation
- Google Inc
- Intel Corporation
- Dassault Systemes
Key Developments in HPC Software Industry
- May 2023: BlackBerry QNX launched QNX SDP 8.0, an ultra-scalable, HPC-ready operating system for next-generation vehicles and IoT systems. This development enhances the capabilities of embedded systems and expands the addressable market for HPC software.
- June 2022: The U.S. Army awarded a USD 699 Million contract to BAE Systems for the High-Performance Computing Modernization Program (HPCMP). This significant investment underlines the importance of HPC in defense applications and stimulates market growth.
Future Outlook for HPC Software Industry Market
The HPC software market is poised for continued growth, driven by advancements in artificial intelligence, machine learning, and cloud computing. The increasing adoption of HPC solutions across various industries, coupled with government initiatives and private sector investments, presents significant opportunities for market expansion. The focus on developing efficient, user-friendly, and scalable solutions will be crucial for capitalizing on the market's future potential. Specific growth accelerators include innovations in parallel computing, advancements in edge computing, and the ongoing development of hybrid cloud environments.
HPC Software Industry Segmentation
-
1. Deployment Type
- 1.1. On-premise
- 1.2. Cloud
-
2. Industrial Application
- 2.1. Aerospace & Defense
- 2.2. Energy & Utilities
- 2.3. BFSI
- 2.4. Media & Entertainment
- 2.5. Manufacturing
- 2.6. Life-science & Healthcare
- 2.7. Design & Engineering
- 2.8. Other Industrial Applications
HPC Software Industry Segmentation By Geography
- 1. North America
- 2. Europe
- 3. Asia Pacific
- 4. Latin America
- 5. Middle East
HPC Software Industry REPORT HIGHLIGHTS
| Aspects | Details |
|---|---|
| Study Period | 2019-2033 |
| Base Year | 2024 |
| Estimated Year | 2025 |
| Forecast Period | 2025-2033 |
| Historical Period | 2019-2024 |
| Growth Rate | CAGR of 58.52% from 2019-2033 |
| Segmentation |
|
Table of Contents
- 1. Introduction
- 1.1. Research Scope
- 1.2. Market Segmentation
- 1.3. Research Methodology
- 1.4. Definitions and Assumptions
- 2. Executive Summary
- 2.1. Introduction
- 3. Market Dynamics
- 3.1. Introduction
- 3.2. Market Drivers
- 3.2.1. Cloud Based High-Performance Computing Software is Driving the Growth; Innovation in Virtualization Technology; Expansion and Diversification of IT Industry
- 3.3. Market Restrains
- 3.3.1. Data Security Concerns in High Availability Cloud Model
- 3.4. Market Trends
- 3.4.1. Cloud Based High-Performance Computing Software is Driving the Growth
- 4. Market Factor Analysis
- 4.1. Porters Five Forces
- 4.2. Supply/Value Chain
- 4.3. PESTEL analysis
- 4.4. Market Entropy
- 4.5. Patent/Trademark Analysis
- 5. Global HPC Software Industry Analysis, Insights and Forecast, 2019-2031
- 5.1. Market Analysis, Insights and Forecast - by Deployment Type
- 5.1.1. On-premise
- 5.1.2. Cloud
- 5.2. Market Analysis, Insights and Forecast - by Industrial Application
- 5.2.1. Aerospace & Defense
- 5.2.2. Energy & Utilities
- 5.2.3. BFSI
- 5.2.4. Media & Entertainment
- 5.2.5. Manufacturing
- 5.2.6. Life-science & Healthcare
- 5.2.7. Design & Engineering
- 5.2.8. Other Industrial Applications
- 5.3. Market Analysis, Insights and Forecast - by Region
- 5.3.1. North America
- 5.3.2. Europe
- 5.3.3. Asia Pacific
- 5.3.4. Latin America
- 5.3.5. Middle East
- 5.1. Market Analysis, Insights and Forecast - by Deployment Type
- 6. North America HPC Software Industry Analysis, Insights and Forecast, 2019-2031
- 6.1. Market Analysis, Insights and Forecast - by Deployment Type
- 6.1.1. On-premise
- 6.1.2. Cloud
- 6.2. Market Analysis, Insights and Forecast - by Industrial Application
- 6.2.1. Aerospace & Defense
- 6.2.2. Energy & Utilities
- 6.2.3. BFSI
- 6.2.4. Media & Entertainment
- 6.2.5. Manufacturing
- 6.2.6. Life-science & Healthcare
- 6.2.7. Design & Engineering
- 6.2.8. Other Industrial Applications
- 6.1. Market Analysis, Insights and Forecast - by Deployment Type
- 7. Europe HPC Software Industry Analysis, Insights and Forecast, 2019-2031
- 7.1. Market Analysis, Insights and Forecast - by Deployment Type
- 7.1.1. On-premise
- 7.1.2. Cloud
- 7.2. Market Analysis, Insights and Forecast - by Industrial Application
- 7.2.1. Aerospace & Defense
- 7.2.2. Energy & Utilities
- 7.2.3. BFSI
- 7.2.4. Media & Entertainment
- 7.2.5. Manufacturing
- 7.2.6. Life-science & Healthcare
- 7.2.7. Design & Engineering
- 7.2.8. Other Industrial Applications
- 7.1. Market Analysis, Insights and Forecast - by Deployment Type
- 8. Asia Pacific HPC Software Industry Analysis, Insights and Forecast, 2019-2031
- 8.1. Market Analysis, Insights and Forecast - by Deployment Type
- 8.1.1. On-premise
- 8.1.2. Cloud
- 8.2. Market Analysis, Insights and Forecast - by Industrial Application
- 8.2.1. Aerospace & Defense
- 8.2.2. Energy & Utilities
- 8.2.3. BFSI
- 8.2.4. Media & Entertainment
- 8.2.5. Manufacturing
- 8.2.6. Life-science & Healthcare
- 8.2.7. Design & Engineering
- 8.2.8. Other Industrial Applications
- 8.1. Market Analysis, Insights and Forecast - by Deployment Type
- 9. Latin America HPC Software Industry Analysis, Insights and Forecast, 2019-2031
- 9.1. Market Analysis, Insights and Forecast - by Deployment Type
- 9.1.1. On-premise
- 9.1.2. Cloud
- 9.2. Market Analysis, Insights and Forecast - by Industrial Application
- 9.2.1. Aerospace & Defense
- 9.2.2. Energy & Utilities
- 9.2.3. BFSI
- 9.2.4. Media & Entertainment
- 9.2.5. Manufacturing
- 9.2.6. Life-science & Healthcare
- 9.2.7. Design & Engineering
- 9.2.8. Other Industrial Applications
- 9.1. Market Analysis, Insights and Forecast - by Deployment Type
- 10. Middle East HPC Software Industry Analysis, Insights and Forecast, 2019-2031
- 10.1. Market Analysis, Insights and Forecast - by Deployment Type
- 10.1.1. On-premise
- 10.1.2. Cloud
- 10.2. Market Analysis, Insights and Forecast - by Industrial Application
- 10.2.1. Aerospace & Defense
- 10.2.2. Energy & Utilities
- 10.2.3. BFSI
- 10.2.4. Media & Entertainment
- 10.2.5. Manufacturing
- 10.2.6. Life-science & Healthcare
- 10.2.7. Design & Engineering
- 10.2.8. Other Industrial Applications
- 10.1. Market Analysis, Insights and Forecast - by Deployment Type
- 11. North America HPC Software Industry Analysis, Insights and Forecast, 2019-2031
- 11.1. Market Analysis, Insights and Forecast - By Country/Sub-region
- 11.1.1 United States
- 11.1.2 Canada
- 11.1.3 Mexico
- 12. Europe HPC Software Industry Analysis, Insights and Forecast, 2019-2031
- 12.1. Market Analysis, Insights and Forecast - By Country/Sub-region
- 12.1.1 Germany
- 12.1.2 United Kingdom
- 12.1.3 France
- 12.1.4 Spain
- 12.1.5 Italy
- 12.1.6 Spain
- 12.1.7 Belgium
- 12.1.8 Netherland
- 12.1.9 Nordics
- 12.1.10 Rest of Europe
- 13. Asia Pacific HPC Software Industry Analysis, Insights and Forecast, 2019-2031
- 13.1. Market Analysis, Insights and Forecast - By Country/Sub-region
- 13.1.1 China
- 13.1.2 Japan
- 13.1.3 India
- 13.1.4 South Korea
- 13.1.5 Southeast Asia
- 13.1.6 Australia
- 13.1.7 Indonesia
- 13.1.8 Phillipes
- 13.1.9 Singapore
- 13.1.10 Thailandc
- 13.1.11 Rest of Asia Pacific
- 14. South America HPC Software Industry Analysis, Insights and Forecast, 2019-2031
- 14.1. Market Analysis, Insights and Forecast - By Country/Sub-region
- 14.1.1 Brazil
- 14.1.2 Argentina
- 14.1.3 Peru
- 14.1.4 Chile
- 14.1.5 Colombia
- 14.1.6 Ecuador
- 14.1.7 Venezuela
- 14.1.8 Rest of South America
- 15. North America HPC Software Industry Analysis, Insights and Forecast, 2019-2031
- 15.1. Market Analysis, Insights and Forecast - By Country/Sub-region
- 15.1.1 United States
- 15.1.2 Canada
- 15.1.3 Mexico
- 16. MEA HPC Software Industry Analysis, Insights and Forecast, 2019-2031
- 16.1. Market Analysis, Insights and Forecast - By Country/Sub-region
- 16.1.1 United Arab Emirates
- 16.1.2 Saudi Arabia
- 16.1.3 South Africa
- 16.1.4 Rest of Middle East and Africa
- 17. Competitive Analysis
- 17.1. Global Market Share Analysis 2024
- 17.2. Company Profiles
- 17.2.1 IBM Corporation
- 17.2.1.1. Overview
- 17.2.1.2. Products
- 17.2.1.3. SWOT Analysis
- 17.2.1.4. Recent Developments
- 17.2.1.5. Financials (Based on Availability)
- 17.2.2 Dell EMC
- 17.2.2.1. Overview
- 17.2.2.2. Products
- 17.2.2.3. SWOT Analysis
- 17.2.2.4. Recent Developments
- 17.2.2.5. Financials (Based on Availability)
- 17.2.3 Microsoft Corporation
- 17.2.3.1. Overview
- 17.2.3.2. Products
- 17.2.3.3. SWOT Analysis
- 17.2.3.4. Recent Developments
- 17.2.3.5. Financials (Based on Availability)
- 17.2.4 Hewlett Packard Enterprise Development LP
- 17.2.4.1. Overview
- 17.2.4.2. Products
- 17.2.4.3. SWOT Analysis
- 17.2.4.4. Recent Developments
- 17.2.4.5. Financials (Based on Availability)
- 17.2.5 Amazon Web Services Inc
- 17.2.5.1. Overview
- 17.2.5.2. Products
- 17.2.5.3. SWOT Analysis
- 17.2.5.4. Recent Developments
- 17.2.5.5. Financials (Based on Availability)
- 17.2.6 ANSYS Inc
- 17.2.6.1. Overview
- 17.2.6.2. Products
- 17.2.6.3. SWOT Analysis
- 17.2.6.4. Recent Developments
- 17.2.6.5. Financials (Based on Availability)
- 17.2.7 Oracle Corporation
- 17.2.7.1. Overview
- 17.2.7.2. Products
- 17.2.7.3. SWOT Analysis
- 17.2.7.4. Recent Developments
- 17.2.7.5. Financials (Based on Availability)
- 17.2.8 Google Inc
- 17.2.8.1. Overview
- 17.2.8.2. Products
- 17.2.8.3. SWOT Analysis
- 17.2.8.4. Recent Developments
- 17.2.8.5. Financials (Based on Availability)
- 17.2.9 Intel Corporation
- 17.2.9.1. Overview
- 17.2.9.2. Products
- 17.2.9.3. SWOT Analysis
- 17.2.9.4. Recent Developments
- 17.2.9.5. Financials (Based on Availability)
- 17.2.10 Dassault Systemes
- 17.2.10.1. Overview
- 17.2.10.2. Products
- 17.2.10.3. SWOT Analysis
- 17.2.10.4. Recent Developments
- 17.2.10.5. Financials (Based on Availability)
- 17.2.1 IBM Corporation
List of Figures
- Figure 1: Global HPC Software Industry Revenue Breakdown (Million, %) by Region 2024 & 2032
- Figure 2: Global HPC Software Industry Volume Breakdown (K Unit, %) by Region 2024 & 2032
- Figure 3: North America HPC Software Industry Revenue (Million), by Country 2024 & 2032
- Figure 4: North America HPC Software Industry Volume (K Unit), by Country 2024 & 2032
- Figure 5: North America HPC Software Industry Revenue Share (%), by Country 2024 & 2032
- Figure 6: North America HPC Software Industry Volume Share (%), by Country 2024 & 2032
- Figure 7: Europe HPC Software Industry Revenue (Million), by Country 2024 & 2032
- Figure 8: Europe HPC Software Industry Volume (K Unit), by Country 2024 & 2032
- Figure 9: Europe HPC Software Industry Revenue Share (%), by Country 2024 & 2032
- Figure 10: Europe HPC Software Industry Volume Share (%), by Country 2024 & 2032
- Figure 11: Asia Pacific HPC Software Industry Revenue (Million), by Country 2024 & 2032
- Figure 12: Asia Pacific HPC Software Industry Volume (K Unit), by Country 2024 & 2032
- Figure 13: Asia Pacific HPC Software Industry Revenue Share (%), by Country 2024 & 2032
- Figure 14: Asia Pacific HPC Software Industry Volume Share (%), by Country 2024 & 2032
- Figure 15: South America HPC Software Industry Revenue (Million), by Country 2024 & 2032
- Figure 16: South America HPC Software Industry Volume (K Unit), by Country 2024 & 2032
- Figure 17: South America HPC Software Industry Revenue Share (%), by Country 2024 & 2032
- Figure 18: South America HPC Software Industry Volume Share (%), by Country 2024 & 2032
- Figure 19: North America HPC Software Industry Revenue (Million), by Country 2024 & 2032
- Figure 20: North America HPC Software Industry Volume (K Unit), by Country 2024 & 2032
- Figure 21: North America HPC Software Industry Revenue Share (%), by Country 2024 & 2032
- Figure 22: North America HPC Software Industry Volume Share (%), by Country 2024 & 2032
- Figure 23: MEA HPC Software Industry Revenue (Million), by Country 2024 & 2032
- Figure 24: MEA HPC Software Industry Volume (K Unit), by Country 2024 & 2032
- Figure 25: MEA HPC Software Industry Revenue Share (%), by Country 2024 & 2032
- Figure 26: MEA HPC Software Industry Volume Share (%), by Country 2024 & 2032
- Figure 27: North America HPC Software Industry Revenue (Million), by Deployment Type 2024 & 2032
- Figure 28: North America HPC Software Industry Volume (K Unit), by Deployment Type 2024 & 2032
- Figure 29: North America HPC Software Industry Revenue Share (%), by Deployment Type 2024 & 2032
- Figure 30: North America HPC Software Industry Volume Share (%), by Deployment Type 2024 & 2032
- Figure 31: North America HPC Software Industry Revenue (Million), by Industrial Application 2024 & 2032
- Figure 32: North America HPC Software Industry Volume (K Unit), by Industrial Application 2024 & 2032
- Figure 33: North America HPC Software Industry Revenue Share (%), by Industrial Application 2024 & 2032
- Figure 34: North America HPC Software Industry Volume Share (%), by Industrial Application 2024 & 2032
- Figure 35: North America HPC Software Industry Revenue (Million), by Country 2024 & 2032
- Figure 36: North America HPC Software Industry Volume (K Unit), by Country 2024 & 2032
- Figure 37: North America HPC Software Industry Revenue Share (%), by Country 2024 & 2032
- Figure 38: North America HPC Software Industry Volume Share (%), by Country 2024 & 2032
- Figure 39: Europe HPC Software Industry Revenue (Million), by Deployment Type 2024 & 2032
- Figure 40: Europe HPC Software Industry Volume (K Unit), by Deployment Type 2024 & 2032
- Figure 41: Europe HPC Software Industry Revenue Share (%), by Deployment Type 2024 & 2032
- Figure 42: Europe HPC Software Industry Volume Share (%), by Deployment Type 2024 & 2032
- Figure 43: Europe HPC Software Industry Revenue (Million), by Industrial Application 2024 & 2032
- Figure 44: Europe HPC Software Industry Volume (K Unit), by Industrial Application 2024 & 2032
- Figure 45: Europe HPC Software Industry Revenue Share (%), by Industrial Application 2024 & 2032
- Figure 46: Europe HPC Software Industry Volume Share (%), by Industrial Application 2024 & 2032
- Figure 47: Europe HPC Software Industry Revenue (Million), by Country 2024 & 2032
- Figure 48: Europe HPC Software Industry Volume (K Unit), by Country 2024 & 2032
- Figure 49: Europe HPC Software Industry Revenue Share (%), by Country 2024 & 2032
- Figure 50: Europe HPC Software Industry Volume Share (%), by Country 2024 & 2032
- Figure 51: Asia Pacific HPC Software Industry Revenue (Million), by Deployment Type 2024 & 2032
- Figure 52: Asia Pacific HPC Software Industry Volume (K Unit), by Deployment Type 2024 & 2032
- Figure 53: Asia Pacific HPC Software Industry Revenue Share (%), by Deployment Type 2024 & 2032
- Figure 54: Asia Pacific HPC Software Industry Volume Share (%), by Deployment Type 2024 & 2032
- Figure 55: Asia Pacific HPC Software Industry Revenue (Million), by Industrial Application 2024 & 2032
- Figure 56: Asia Pacific HPC Software Industry Volume (K Unit), by Industrial Application 2024 & 2032
- Figure 57: Asia Pacific HPC Software Industry Revenue Share (%), by Industrial Application 2024 & 2032
- Figure 58: Asia Pacific HPC Software Industry Volume Share (%), by Industrial Application 2024 & 2032
- Figure 59: Asia Pacific HPC Software Industry Revenue (Million), by Country 2024 & 2032
- Figure 60: Asia Pacific HPC Software Industry Volume (K Unit), by Country 2024 & 2032
- Figure 61: Asia Pacific HPC Software Industry Revenue Share (%), by Country 2024 & 2032
- Figure 62: Asia Pacific HPC Software Industry Volume Share (%), by Country 2024 & 2032
- Figure 63: Latin America HPC Software Industry Revenue (Million), by Deployment Type 2024 & 2032
- Figure 64: Latin America HPC Software Industry Volume (K Unit), by Deployment Type 2024 & 2032
- Figure 65: Latin America HPC Software Industry Revenue Share (%), by Deployment Type 2024 & 2032
- Figure 66: Latin America HPC Software Industry Volume Share (%), by Deployment Type 2024 & 2032
- Figure 67: Latin America HPC Software Industry Revenue (Million), by Industrial Application 2024 & 2032
- Figure 68: Latin America HPC Software Industry Volume (K Unit), by Industrial Application 2024 & 2032
- Figure 69: Latin America HPC Software Industry Revenue Share (%), by Industrial Application 2024 & 2032
- Figure 70: Latin America HPC Software Industry Volume Share (%), by Industrial Application 2024 & 2032
- Figure 71: Latin America HPC Software Industry Revenue (Million), by Country 2024 & 2032
- Figure 72: Latin America HPC Software Industry Volume (K Unit), by Country 2024 & 2032
- Figure 73: Latin America HPC Software Industry Revenue Share (%), by Country 2024 & 2032
- Figure 74: Latin America HPC Software Industry Volume Share (%), by Country 2024 & 2032
- Figure 75: Middle East HPC Software Industry Revenue (Million), by Deployment Type 2024 & 2032
- Figure 76: Middle East HPC Software Industry Volume (K Unit), by Deployment Type 2024 & 2032
- Figure 77: Middle East HPC Software Industry Revenue Share (%), by Deployment Type 2024 & 2032
- Figure 78: Middle East HPC Software Industry Volume Share (%), by Deployment Type 2024 & 2032
- Figure 79: Middle East HPC Software Industry Revenue (Million), by Industrial Application 2024 & 2032
- Figure 80: Middle East HPC Software Industry Volume (K Unit), by Industrial Application 2024 & 2032
- Figure 81: Middle East HPC Software Industry Revenue Share (%), by Industrial Application 2024 & 2032
- Figure 82: Middle East HPC Software Industry Volume Share (%), by Industrial Application 2024 & 2032
- Figure 83: Middle East HPC Software Industry Revenue (Million), by Country 2024 & 2032
- Figure 84: Middle East HPC Software Industry Volume (K Unit), by Country 2024 & 2032
- Figure 85: Middle East HPC Software Industry Revenue Share (%), by Country 2024 & 2032
- Figure 86: Middle East HPC Software Industry Volume Share (%), by Country 2024 & 2032
List of Tables
- Table 1: Global HPC Software Industry Revenue Million Forecast, by Region 2019 & 2032
- Table 2: Global HPC Software Industry Volume K Unit Forecast, by Region 2019 & 2032
- Table 3: Global HPC Software Industry Revenue Million Forecast, by Deployment Type 2019 & 2032
- Table 4: Global HPC Software Industry Volume K Unit Forecast, by Deployment Type 2019 & 2032
- Table 5: Global HPC Software Industry Revenue Million Forecast, by Industrial Application 2019 & 2032
- Table 6: Global HPC Software Industry Volume K Unit Forecast, by Industrial Application 2019 & 2032
- Table 7: Global HPC Software Industry Revenue Million Forecast, by Region 2019 & 2032
- Table 8: Global HPC Software Industry Volume K Unit Forecast, by Region 2019 & 2032
- Table 9: Global HPC Software Industry Revenue Million Forecast, by Country 2019 & 2032
- Table 10: Global HPC Software Industry Volume K Unit Forecast, by Country 2019 & 2032
- Table 11: United States HPC Software Industry Revenue (Million) Forecast, by Application 2019 & 2032
- Table 12: United States HPC Software Industry Volume (K Unit) Forecast, by Application 2019 & 2032
- Table 13: Canada HPC Software Industry Revenue (Million) Forecast, by Application 2019 & 2032
- Table 14: Canada HPC Software Industry Volume (K Unit) Forecast, by Application 2019 & 2032
- Table 15: Mexico HPC Software Industry Revenue (Million) Forecast, by Application 2019 & 2032
- Table 16: Mexico HPC Software Industry Volume (K Unit) Forecast, by Application 2019 & 2032
- Table 17: Global HPC Software Industry Revenue Million Forecast, by Country 2019 & 2032
- Table 18: Global HPC Software Industry Volume K Unit Forecast, by Country 2019 & 2032
- Table 19: Germany HPC Software Industry Revenue (Million) Forecast, by Application 2019 & 2032
- Table 20: Germany HPC Software Industry Volume (K Unit) Forecast, by Application 2019 & 2032
- Table 21: United Kingdom HPC Software Industry Revenue (Million) Forecast, by Application 2019 & 2032
- Table 22: United Kingdom HPC Software Industry Volume (K Unit) Forecast, by Application 2019 & 2032
- Table 23: France HPC Software Industry Revenue (Million) Forecast, by Application 2019 & 2032
- Table 24: France HPC Software Industry Volume (K Unit) Forecast, by Application 2019 & 2032
- Table 25: Spain HPC Software Industry Revenue (Million) Forecast, by Application 2019 & 2032
- Table 26: Spain HPC Software Industry Volume (K Unit) Forecast, by Application 2019 & 2032
- Table 27: Italy HPC Software Industry Revenue (Million) Forecast, by Application 2019 & 2032
- Table 28: Italy HPC Software Industry Volume (K Unit) Forecast, by Application 2019 & 2032
- Table 29: Spain HPC Software Industry Revenue (Million) Forecast, by Application 2019 & 2032
- Table 30: Spain HPC Software Industry Volume (K Unit) Forecast, by Application 2019 & 2032
- Table 31: Belgium HPC Software Industry Revenue (Million) Forecast, by Application 2019 & 2032
- Table 32: Belgium HPC Software Industry Volume (K Unit) Forecast, by Application 2019 & 2032
- Table 33: Netherland HPC Software Industry Revenue (Million) Forecast, by Application 2019 & 2032
- Table 34: Netherland HPC Software Industry Volume (K Unit) Forecast, by Application 2019 & 2032
- Table 35: Nordics HPC Software Industry Revenue (Million) Forecast, by Application 2019 & 2032
- Table 36: Nordics HPC Software Industry Volume (K Unit) Forecast, by Application 2019 & 2032
- Table 37: Rest of Europe HPC Software Industry Revenue (Million) Forecast, by Application 2019 & 2032
- Table 38: Rest of Europe HPC Software Industry Volume (K Unit) Forecast, by Application 2019 & 2032
- Table 39: Global HPC Software Industry Revenue Million Forecast, by Country 2019 & 2032
- Table 40: Global HPC Software Industry Volume K Unit Forecast, by Country 2019 & 2032
- Table 41: China HPC Software Industry Revenue (Million) Forecast, by Application 2019 & 2032
- Table 42: China HPC Software Industry Volume (K Unit) Forecast, by Application 2019 & 2032
- Table 43: Japan HPC Software Industry Revenue (Million) Forecast, by Application 2019 & 2032
- Table 44: Japan HPC Software Industry Volume (K Unit) Forecast, by Application 2019 & 2032
- Table 45: India HPC Software Industry Revenue (Million) Forecast, by Application 2019 & 2032
- Table 46: India HPC Software Industry Volume (K Unit) Forecast, by Application 2019 & 2032
- Table 47: South Korea HPC Software Industry Revenue (Million) Forecast, by Application 2019 & 2032
- Table 48: South Korea HPC Software Industry Volume (K Unit) Forecast, by Application 2019 & 2032
- Table 49: Southeast Asia HPC Software Industry Revenue (Million) Forecast, by Application 2019 & 2032
- Table 50: Southeast Asia HPC Software Industry Volume (K Unit) Forecast, by Application 2019 & 2032
- Table 51: Australia HPC Software Industry Revenue (Million) Forecast, by Application 2019 & 2032
- Table 52: Australia HPC Software Industry Volume (K Unit) Forecast, by Application 2019 & 2032
- Table 53: Indonesia HPC Software Industry Revenue (Million) Forecast, by Application 2019 & 2032
- Table 54: Indonesia HPC Software Industry Volume (K Unit) Forecast, by Application 2019 & 2032
- Table 55: Phillipes HPC Software Industry Revenue (Million) Forecast, by Application 2019 & 2032
- Table 56: Phillipes HPC Software Industry Volume (K Unit) Forecast, by Application 2019 & 2032
- Table 57: Singapore HPC Software Industry Revenue (Million) Forecast, by Application 2019 & 2032
- Table 58: Singapore HPC Software Industry Volume (K Unit) Forecast, by Application 2019 & 2032
- Table 59: Thailandc HPC Software Industry Revenue (Million) Forecast, by Application 2019 & 2032
- Table 60: Thailandc HPC Software Industry Volume (K Unit) Forecast, by Application 2019 & 2032
- Table 61: Rest of Asia Pacific HPC Software Industry Revenue (Million) Forecast, by Application 2019 & 2032
- Table 62: Rest of Asia Pacific HPC Software Industry Volume (K Unit) Forecast, by Application 2019 & 2032
- Table 63: Global HPC Software Industry Revenue Million Forecast, by Country 2019 & 2032
- Table 64: Global HPC Software Industry Volume K Unit Forecast, by Country 2019 & 2032
- Table 65: Brazil HPC Software Industry Revenue (Million) Forecast, by Application 2019 & 2032
- Table 66: Brazil HPC Software Industry Volume (K Unit) Forecast, by Application 2019 & 2032
- Table 67: Argentina HPC Software Industry Revenue (Million) Forecast, by Application 2019 & 2032
- Table 68: Argentina HPC Software Industry Volume (K Unit) Forecast, by Application 2019 & 2032
- Table 69: Peru HPC Software Industry Revenue (Million) Forecast, by Application 2019 & 2032
- Table 70: Peru HPC Software Industry Volume (K Unit) Forecast, by Application 2019 & 2032
- Table 71: Chile HPC Software Industry Revenue (Million) Forecast, by Application 2019 & 2032
- Table 72: Chile HPC Software Industry Volume (K Unit) Forecast, by Application 2019 & 2032
- Table 73: Colombia HPC Software Industry Revenue (Million) Forecast, by Application 2019 & 2032
- Table 74: Colombia HPC Software Industry Volume (K Unit) Forecast, by Application 2019 & 2032
- Table 75: Ecuador HPC Software Industry Revenue (Million) Forecast, by Application 2019 & 2032
- Table 76: Ecuador HPC Software Industry Volume (K Unit) Forecast, by Application 2019 & 2032
- Table 77: Venezuela HPC Software Industry Revenue (Million) Forecast, by Application 2019 & 2032
- Table 78: Venezuela HPC Software Industry Volume (K Unit) Forecast, by Application 2019 & 2032
- Table 79: Rest of South America HPC Software Industry Revenue (Million) Forecast, by Application 2019 & 2032
- Table 80: Rest of South America HPC Software Industry Volume (K Unit) Forecast, by Application 2019 & 2032
- Table 81: Global HPC Software Industry Revenue Million Forecast, by Country 2019 & 2032
- Table 82: Global HPC Software Industry Volume K Unit Forecast, by Country 2019 & 2032
- Table 83: United States HPC Software Industry Revenue (Million) Forecast, by Application 2019 & 2032
- Table 84: United States HPC Software Industry Volume (K Unit) Forecast, by Application 2019 & 2032
- Table 85: Canada HPC Software Industry Revenue (Million) Forecast, by Application 2019 & 2032
- Table 86: Canada HPC Software Industry Volume (K Unit) Forecast, by Application 2019 & 2032
- Table 87: Mexico HPC Software Industry Revenue (Million) Forecast, by Application 2019 & 2032
- Table 88: Mexico HPC Software Industry Volume (K Unit) Forecast, by Application 2019 & 2032
- Table 89: Global HPC Software Industry Revenue Million Forecast, by Country 2019 & 2032
- Table 90: Global HPC Software Industry Volume K Unit Forecast, by Country 2019 & 2032
- Table 91: United Arab Emirates HPC Software Industry Revenue (Million) Forecast, by Application 2019 & 2032
- Table 92: United Arab Emirates HPC Software Industry Volume (K Unit) Forecast, by Application 2019 & 2032
- Table 93: Saudi Arabia HPC Software Industry Revenue (Million) Forecast, by Application 2019 & 2032
- Table 94: Saudi Arabia HPC Software Industry Volume (K Unit) Forecast, by Application 2019 & 2032
- Table 95: South Africa HPC Software Industry Revenue (Million) Forecast, by Application 2019 & 2032
- Table 96: South Africa HPC Software Industry Volume (K Unit) Forecast, by Application 2019 & 2032
- Table 97: Rest of Middle East and Africa HPC Software Industry Revenue (Million) Forecast, by Application 2019 & 2032
- Table 98: Rest of Middle East and Africa HPC Software Industry Volume (K Unit) Forecast, by Application 2019 & 2032
- Table 99: Global HPC Software Industry Revenue Million Forecast, by Deployment Type 2019 & 2032
- Table 100: Global HPC Software Industry Volume K Unit Forecast, by Deployment Type 2019 & 2032
- Table 101: Global HPC Software Industry Revenue Million Forecast, by Industrial Application 2019 & 2032
- Table 102: Global HPC Software Industry Volume K Unit Forecast, by Industrial Application 2019 & 2032
- Table 103: Global HPC Software Industry Revenue Million Forecast, by Country 2019 & 2032
- Table 104: Global HPC Software Industry Volume K Unit Forecast, by Country 2019 & 2032
- Table 105: Global HPC Software Industry Revenue Million Forecast, by Deployment Type 2019 & 2032
- Table 106: Global HPC Software Industry Volume K Unit Forecast, by Deployment Type 2019 & 2032
- Table 107: Global HPC Software Industry Revenue Million Forecast, by Industrial Application 2019 & 2032
- Table 108: Global HPC Software Industry Volume K Unit Forecast, by Industrial Application 2019 & 2032
- Table 109: Global HPC Software Industry Revenue Million Forecast, by Country 2019 & 2032
- Table 110: Global HPC Software Industry Volume K Unit Forecast, by Country 2019 & 2032
- Table 111: Global HPC Software Industry Revenue Million Forecast, by Deployment Type 2019 & 2032
- Table 112: Global HPC Software Industry Volume K Unit Forecast, by Deployment Type 2019 & 2032
- Table 113: Global HPC Software Industry Revenue Million Forecast, by Industrial Application 2019 & 2032
- Table 114: Global HPC Software Industry Volume K Unit Forecast, by Industrial Application 2019 & 2032
- Table 115: Global HPC Software Industry Revenue Million Forecast, by Country 2019 & 2032
- Table 116: Global HPC Software Industry Volume K Unit Forecast, by Country 2019 & 2032
- Table 117: Global HPC Software Industry Revenue Million Forecast, by Deployment Type 2019 & 2032
- Table 118: Global HPC Software Industry Volume K Unit Forecast, by Deployment Type 2019 & 2032
- Table 119: Global HPC Software Industry Revenue Million Forecast, by Industrial Application 2019 & 2032
- Table 120: Global HPC Software Industry Volume K Unit Forecast, by Industrial Application 2019 & 2032
- Table 121: Global HPC Software Industry Revenue Million Forecast, by Country 2019 & 2032
- Table 122: Global HPC Software Industry Volume K Unit Forecast, by Country 2019 & 2032
- Table 123: Global HPC Software Industry Revenue Million Forecast, by Deployment Type 2019 & 2032
- Table 124: Global HPC Software Industry Volume K Unit Forecast, by Deployment Type 2019 & 2032
- Table 125: Global HPC Software Industry Revenue Million Forecast, by Industrial Application 2019 & 2032
- Table 126: Global HPC Software Industry Volume K Unit Forecast, by Industrial Application 2019 & 2032
- Table 127: Global HPC Software Industry Revenue Million Forecast, by Country 2019 & 2032
- Table 128: Global HPC Software Industry Volume K Unit Forecast, by Country 2019 & 2032
Frequently Asked Questions
1. What is the projected Compound Annual Growth Rate (CAGR) of the HPC Software Industry?
The projected CAGR is approximately 58.52%.
2. Which companies are prominent players in the HPC Software Industry?
Key companies in the market include IBM Corporation, Dell EMC, Microsoft Corporation, Hewlett Packard Enterprise Development LP, Amazon Web Services Inc, ANSYS Inc, Oracle Corporation, Google Inc, Intel Corporation, Dassault Systemes.
3. What are the main segments of the HPC Software Industry?
The market segments include Deployment Type, Industrial Application.
4. Can you provide details about the market size?
The market size is estimated to be USD 6.78 Million as of 2022.
5. What are some drivers contributing to market growth?
Cloud Based High-Performance Computing Software is Driving the Growth; Innovation in Virtualization Technology; Expansion and Diversification of IT Industry.
6. What are the notable trends driving market growth?
Cloud Based High-Performance Computing Software is Driving the Growth.
7. Are there any restraints impacting market growth?
Data Security Concerns in High Availability Cloud Model.
8. Can you provide examples of recent developments in the market?
May 2023: BlackBerry QNX announced the launch of an ultra-scalable, High-Performance compute-ready operating system, QNX Software Development Platform (SDP) 8.0, to advance software development efforts for next-generation vehicles and IoT systems.
9. What pricing options are available for accessing the report?
Pricing options include single-user, multi-user, and enterprise licenses priced at USD 4750, USD 5250, and USD 8750 respectively.
10. Is the market size provided in terms of value or volume?
The market size is provided in terms of value, measured in Million and volume, measured in K Unit.
11. Are there any specific market keywords associated with the report?
Yes, the market keyword associated with the report is "HPC Software Industry," which aids in identifying and referencing the specific market segment covered.
12. How do I determine which pricing option suits my needs best?
The pricing options vary based on user requirements and access needs. Individual users may opt for single-user licenses, while businesses requiring broader access may choose multi-user or enterprise licenses for cost-effective access to the report.
13. Are there any additional resources or data provided in the HPC Software Industry report?
While the report offers comprehensive insights, it's advisable to review the specific contents or supplementary materials provided to ascertain if additional resources or data are available.
14. How can I stay updated on further developments or reports in the HPC Software Industry?
To stay informed about further developments, trends, and reports in the HPC Software Industry, consider subscribing to industry newsletters, following relevant companies and organizations, or regularly checking reputable industry news sources and publications.
Methodology
Step 1 - Identification of Relevant Samples Size from Population Database


Step 2 - Approaches for Defining Global Market Size (Value, Volume* & Price*)

Note*: In applicable scenarios
Step 3 - Data Sources
Primary Research
- Web Analytics
- Survey Reports
- Research Institute
- Latest Research Reports
- Opinion Leaders
Secondary Research
- Annual Reports
- White Paper
- Latest Press Release
- Industry Association
- Paid Database
- Investor Presentations

Step 4 - Data Triangulation
Involves using different sources of information in order to increase the validity of a study
These sources are likely to be stakeholders in a program - participants, other researchers, program staff, other community members, and so on.
Then we put all data in single framework & apply various statistical tools to find out the dynamic on the market.
During the analysis stage, feedback from the stakeholder groups would be compared to determine areas of agreement as well as areas of divergence


