
Key Insights
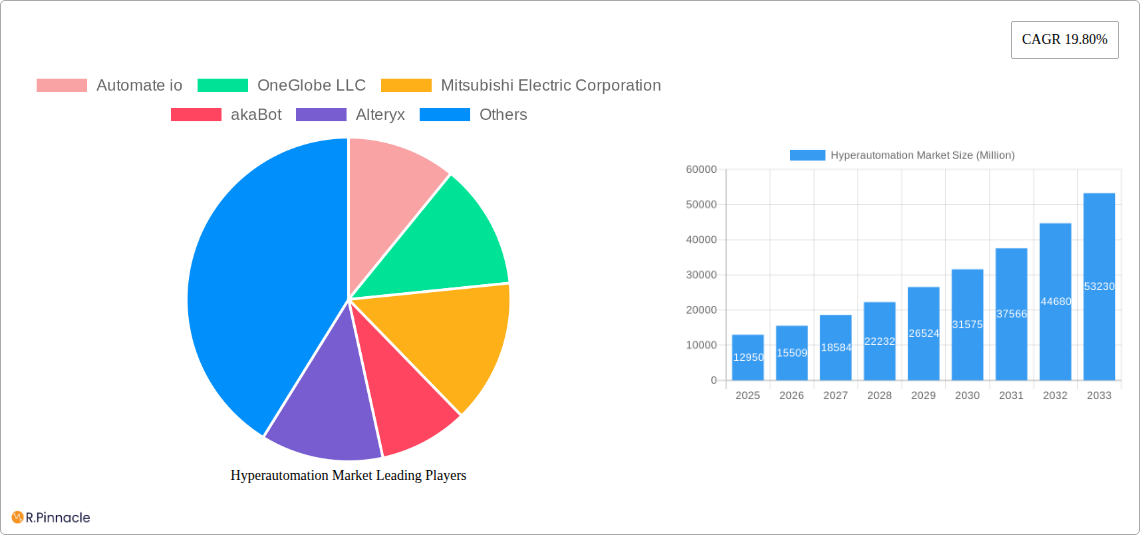
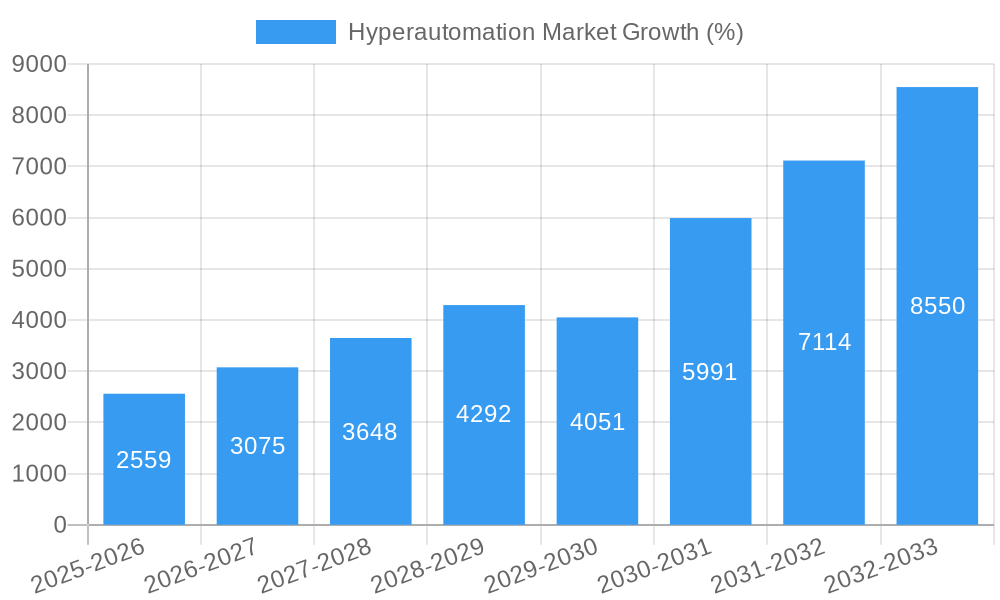
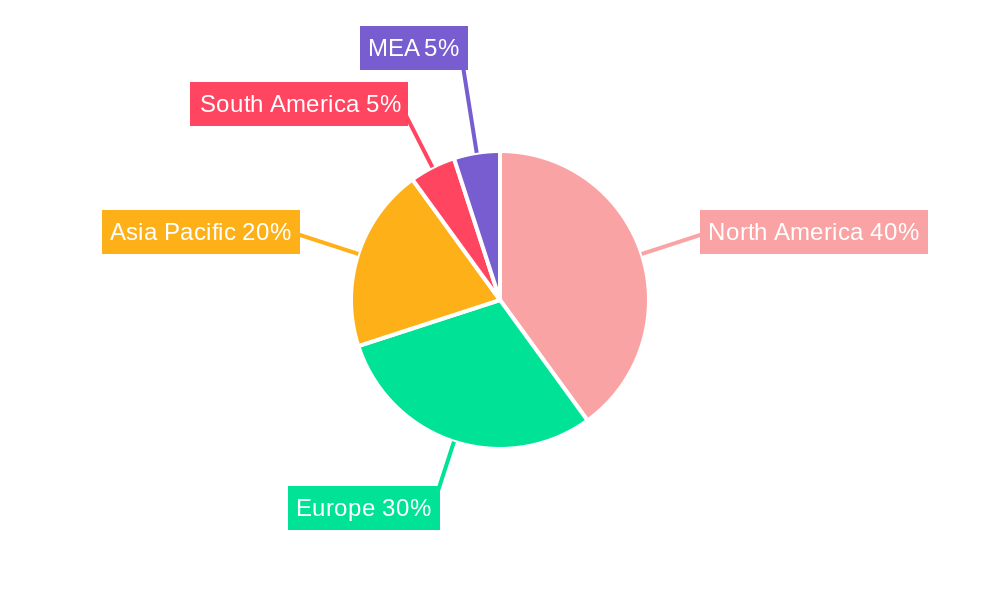
The hyperautomation market is experiencing robust growth, projected to reach a substantial size with a Compound Annual Growth Rate (CAGR) of 19.80% from 2025 to 2033. This expansion is fueled by several key drivers, including the increasing need for enhanced operational efficiency across various industries, the rising adoption of cloud-based solutions, and the growing availability of sophisticated automation technologies. Businesses across sectors like BFSI, retail, and healthcare are increasingly leveraging hyperautomation to streamline processes, reduce operational costs, and improve customer experience. The market is segmented by technology type (biometrics, context-aware computing, natural language generation, chatbots, robotic process automation (RPA), and machine learning) and end-user industry, reflecting the diverse applications of hyperautomation. North America currently holds a significant market share due to early adoption and technological advancements, but the Asia-Pacific region is poised for rapid growth driven by increasing digitalization and a large pool of potential users. Competition is fierce among established players and emerging startups, pushing innovation and driving down costs, further contributing to market expansion.
The continued growth of the hyperautomation market will depend on several factors, including the successful integration of various automation technologies into existing workflows, the development of robust security measures to address data privacy concerns, and the ability of vendors to offer scalable and cost-effective solutions. The increasing demand for skilled professionals in the field of hyperautomation poses a challenge, but simultaneously creates opportunities for training and education programs. Looking ahead, the convergence of artificial intelligence (AI) and hyperautomation will unlock new possibilities, leading to even more sophisticated and intelligent automation solutions. This will likely result in further market segmentation and the emergence of niche players specializing in specific industry applications or technologies. The ongoing development of advanced analytics capabilities will also contribute significantly to the growth and refinement of hyperautomation solutions.
Hyperautomation Market Report: 2019-2033
This comprehensive report provides an in-depth analysis of the Hyperautomation Market, projecting robust growth and significant market transformation from 2019 to 2033. The study covers market sizing, segmentation, competitive landscape, technological advancements, and future outlook, offering actionable insights for industry professionals and strategic decision-makers. The report includes detailed analysis across various technology types and end-user industries, providing a holistic view of this rapidly evolving market. With a base year of 2025 and a forecast period spanning 2025-2033, this report is an invaluable resource for understanding the current state and future trajectory of the hyperautomation landscape. The total market value is expected to reach xx Million by 2033.
Hyperautomation Market Structure & Innovation Trends
The Hyperautomation market exhibits a moderately concentrated structure, with several key players holding significant market share. However, the market is also characterized by continuous innovation and new entrants, leading to dynamic competitive dynamics. The market share of the top 5 players is estimated at xx%, with Automation Anywhere and UiPath holding a combined share of approximately xx%. M&A activities have played a crucial role in shaping the market landscape, with deal values reaching xx Million in 2024. These mergers and acquisitions often aim to integrate complementary technologies and expand market reach. Innovation drivers include the increasing demand for automation across various industries, advancements in artificial intelligence (AI) and machine learning (ML), and the growing adoption of low-code/no-code platforms. Regulatory frameworks, while not heavily restrictive, influence data privacy and security standards impacting the development and deployment of hyperautomation solutions. Product substitutes, such as traditional manual processes, are gradually becoming less competitive due to the cost-effectiveness and efficiency gains offered by hyperautomation. End-user demographics reveal a broad adoption across various sectors, driven by the need for improved operational efficiency and reduced costs.
- Market Concentration: Moderately concentrated, with top 5 players holding xx% market share.
- M&A Activity: Deal values reaching xx Million in 2024.
- Innovation Drivers: AI/ML advancements, low-code/no-code platforms, increasing demand for automation.
- Regulatory Landscape: Influences data privacy and security, impacting solution development.
- Product Substitutes: Traditional manual processes facing decreased competitiveness.
- End-User Demographics: Broad adoption across multiple sectors.
Hyperautomation Market Dynamics & Trends
The Hyperautomation Market is experiencing significant growth, driven by factors such as rising labor costs, increasing demand for process optimization, and the adoption of digital transformation initiatives across various sectors. Technological disruptions, primarily from advancements in AI, ML, and RPA, are reshaping the market landscape, creating new opportunities and challenges for existing players. Consumer preferences are shifting towards solutions that offer ease of use, scalability, and seamless integration with existing systems. Competitive dynamics are intense, with companies focusing on innovation, strategic partnerships, and acquisitions to gain a competitive edge. The Compound Annual Growth Rate (CAGR) is projected to be xx% during the forecast period (2025-2033), with market penetration increasing from xx% in 2025 to xx% by 2033.
Dominant Regions & Segments in Hyperautomation Market
The North American region currently holds the largest market share, driven by high technological adoption, a robust IT infrastructure, and the presence of major hyperautomation vendors. However, the Asia-Pacific region is projected to witness the fastest growth, fueled by increasing digitalization initiatives and government support for technological advancements.
By Technology Type:
- Robotic Process Automation (RPA): Remains the dominant technology segment, owing to its mature technology and wide applicability.
- Machine Learning (ML): Demonstrates rapid growth, driven by its ability to enhance decision-making and improve automation efficiency.
- Other Technologies (Biometrics, Context-Aware Computing, Natural Learning Generation, Chatbots): Show promising growth potential, with increasing adoption across various applications.
Key Drivers:
- North America: High technological adoption, robust IT infrastructure, presence of major vendors.
- Asia-Pacific: Increasing digitalization, government support for technology advancements.
- Europe: Strong focus on data privacy and security regulations driving demand for secure solutions.
By End-User Industry:
- BFSI (Banking, Financial Services, and Insurance): High adoption driven by the need for increased efficiency and regulatory compliance.
- IT & Telecom: Significant demand for automating complex processes and improving customer service.
- Manufacturing: Adopting hyperautomation to optimize production processes, improve quality control, and reduce operational costs.
- Other Industries (Retail, Education, Automotive, Healthcare & Life Science): Show strong growth potential driven by the increasing need for automation and efficiency improvements.
Hyperautomation Market Product Innovations
Recent product innovations focus on low-code/no-code platforms, enhanced AI/ML capabilities, and improved integration with existing enterprise systems. These advancements are driven by the need for greater accessibility and ease of implementation, allowing a broader range of businesses to benefit from hyperautomation. The competitive advantage lies in offering scalable, secure, and user-friendly solutions that address specific industry needs and challenges. The market is witnessing a shift towards cloud-based solutions offering improved flexibility and cost-effectiveness.
Report Scope & Segmentation Analysis
This report provides a comprehensive analysis of the Hyperautomation Market, segmented by technology type (Biometrics, Context-Aware Computing, Natural Learning Generation, Chatbots, Robotic Process Automation, Machine Learning) and end-user industry (BFSI, Retail, IT & Telecom, Education, Automotive, Manufacturing, Healthcare & Life Science). Each segment is analyzed based on its growth projections, market size, and competitive dynamics. The report provides detailed market sizing and forecasting for each segment for the period 2019-2033.
Key Drivers of Hyperautomation Market Growth
The key drivers of hyperautomation market growth include the increasing need for operational efficiency, cost reduction, improved customer experience, and the rising adoption of digital transformation initiatives. Advancements in AI and ML are further fueling the market's growth, enabling more complex and sophisticated automation solutions. Government regulations and initiatives promoting technological advancements are also contributing to the market's expansion. Specifically, the growing emphasis on data security and privacy has increased demand for secure and compliant hyperautomation solutions.
Challenges in the Hyperautomation Market Sector
Despite the significant growth potential, the Hyperautomation Market faces several challenges. These include the high initial investment costs associated with implementing hyperautomation solutions, the need for skilled professionals to manage and maintain these systems, and concerns about data security and privacy. Integration challenges with legacy systems can also hinder adoption. The competitive landscape also presents a challenge, with established players and new entrants vying for market share.
Emerging Opportunities in Hyperautomation Market
Emerging opportunities exist in various sectors, including healthcare, finance, and manufacturing, where hyperautomation can significantly improve processes and reduce costs. The growing adoption of cloud-based hyperautomation solutions provides opportunities for businesses to scale their automation capabilities efficiently. The development of more user-friendly, low-code/no-code platforms is opening the door for businesses with limited technical expertise to leverage the benefits of hyperautomation.
Leading Players in the Hyperautomation Market Market
- Automate.io
- OneGlobe LLC
- Mitsubishi Electric Corporation
- akaBot
- Alteryx
- Automation Anywhere
- Rocketbot
- Simple Fractal
- Catalytic Inc
- SolveXia
- UiPath
Key Developments in Hyperautomation Market Industry
- September 2022: e.IQ 5.0 - Nile Edition launched, improving features for building automated business applications at scale. This includes process orchestration, data and event processing, AI/ML, enterprise connectors, and front-end application development, all using a low-code/no-code interface. A new taxonomy builder for multilevel management was also introduced.
- September 2022: UiPath and OutSystems announce an alliance to combine UiPath's Business Automation Platform with OutSystems' low-code capabilities, offering enhanced automation solutions for clients.
Future Outlook for Hyperautomation Market Market
The future outlook for the Hyperautomation Market is highly positive, driven by continued technological advancements, increasing demand for automation across various industries, and the growing adoption of digital transformation initiatives. The market is poised for substantial growth, with significant opportunities for companies that can develop innovative, user-friendly, and secure hyperautomation solutions. Strategic partnerships and acquisitions will continue to play a crucial role in shaping the market landscape.
Hyperautomation Market Segmentation
-
1. Technology Type
- 1.1. RPA
- 1.2. AI/ML
- 1.3. Biometrics
- 1.4. Context-Aware Computing
- 1.5. Natural Learning Generation
-
2. End-User Industry
- 2.1. BFSI
- 2.2. Retail
- 2.3. IT & Telecom
- 2.4. Education
- 2.5. Automotive
- 2.6. Manufacturing
- 2.7. Healthcare & Life Science
Hyperautomation Market Segmentation By Geography
- 1. North America
- 2. Asia Pacific
- 3. Europe
- 4. Latin America
- 5. Middle East and Africa
Hyperautomation Market REPORT HIGHLIGHTS
| Aspects | Details |
|---|---|
| Study Period | 2019-2033 |
| Base Year | 2024 |
| Estimated Year | 2025 |
| Forecast Period | 2025-2033 |
| Historical Period | 2019-2024 |
| Growth Rate | CAGR of 19.80% from 2019-2033 |
| Segmentation |
|
Table of Contents
- 1. Introduction
- 1.1. Research Scope
- 1.2. Market Segmentation
- 1.3. Research Methodology
- 1.4. Definitions and Assumptions
- 2. Executive Summary
- 2.1. Introduction
- 3. Market Dynamics
- 3.1. Introduction
- 3.2. Market Drivers
- 3.2.1 Increasing Automation Trends in the Manufacturing Sector; Increased penetration of digitalization
- 3.2.2 coupled with growing demand for improved efficiency and reduced operating costs; Growing applications of RPA and AI
- 3.3. Market Restrains
- 3.3.1. High initial cost of adoption; Lack of skilled personnel
- 3.4. Market Trends
- 3.4.1. The Machine Learning Segment is Expected to Drive the Market's Growth
- 4. Market Factor Analysis
- 4.1. Porters Five Forces
- 4.2. Supply/Value Chain
- 4.3. PESTEL analysis
- 4.4. Market Entropy
- 4.5. Patent/Trademark Analysis
- 5. Global Hyperautomation Market Analysis, Insights and Forecast, 2019-2031
- 5.1. Market Analysis, Insights and Forecast - by Technology Type
- 5.1.1. RPA
- 5.1.2. AI/ML
- 5.1.3. Biometrics
- 5.1.4. Context-Aware Computing
- 5.1.5. Natural Learning Generation
- 5.2. Market Analysis, Insights and Forecast - by End-User Industry
- 5.2.1. BFSI
- 5.2.2. Retail
- 5.2.3. IT & Telecom
- 5.2.4. Education
- 5.2.5. Automotive
- 5.2.6. Manufacturing
- 5.2.7. Healthcare & Life Science
- 5.3. Market Analysis, Insights and Forecast - by Region
- 5.3.1. North America
- 5.3.2. Asia Pacific
- 5.3.3. Europe
- 5.3.4. Latin America
- 5.3.5. Middle East and Africa
- 5.1. Market Analysis, Insights and Forecast - by Technology Type
- 6. North America Hyperautomation Market Analysis, Insights and Forecast, 2019-2031
- 6.1. Market Analysis, Insights and Forecast - by Technology Type
- 6.1.1. RPA
- 6.1.2. AI/ML
- 6.1.3. Biometrics
- 6.1.4. Context-Aware Computing
- 6.1.5. Natural Learning Generation
- 6.2. Market Analysis, Insights and Forecast - by End-User Industry
- 6.2.1. BFSI
- 6.2.2. Retail
- 6.2.3. IT & Telecom
- 6.2.4. Education
- 6.2.5. Automotive
- 6.2.6. Manufacturing
- 6.2.7. Healthcare & Life Science
- 6.1. Market Analysis, Insights and Forecast - by Technology Type
- 7. Asia Pacific Hyperautomation Market Analysis, Insights and Forecast, 2019-2031
- 7.1. Market Analysis, Insights and Forecast - by Technology Type
- 7.1.1. RPA
- 7.1.2. AI/ML
- 7.1.3. Biometrics
- 7.1.4. Context-Aware Computing
- 7.1.5. Natural Learning Generation
- 7.2. Market Analysis, Insights and Forecast - by End-User Industry
- 7.2.1. BFSI
- 7.2.2. Retail
- 7.2.3. IT & Telecom
- 7.2.4. Education
- 7.2.5. Automotive
- 7.2.6. Manufacturing
- 7.2.7. Healthcare & Life Science
- 7.1. Market Analysis, Insights and Forecast - by Technology Type
- 8. Europe Hyperautomation Market Analysis, Insights and Forecast, 2019-2031
- 8.1. Market Analysis, Insights and Forecast - by Technology Type
- 8.1.1. RPA
- 8.1.2. AI/ML
- 8.1.3. Biometrics
- 8.1.4. Context-Aware Computing
- 8.1.5. Natural Learning Generation
- 8.2. Market Analysis, Insights and Forecast - by End-User Industry
- 8.2.1. BFSI
- 8.2.2. Retail
- 8.2.3. IT & Telecom
- 8.2.4. Education
- 8.2.5. Automotive
- 8.2.6. Manufacturing
- 8.2.7. Healthcare & Life Science
- 8.1. Market Analysis, Insights and Forecast - by Technology Type
- 9. Latin America Hyperautomation Market Analysis, Insights and Forecast, 2019-2031
- 9.1. Market Analysis, Insights and Forecast - by Technology Type
- 9.1.1. RPA
- 9.1.2. AI/ML
- 9.1.3. Biometrics
- 9.1.4. Context-Aware Computing
- 9.1.5. Natural Learning Generation
- 9.2. Market Analysis, Insights and Forecast - by End-User Industry
- 9.2.1. BFSI
- 9.2.2. Retail
- 9.2.3. IT & Telecom
- 9.2.4. Education
- 9.2.5. Automotive
- 9.2.6. Manufacturing
- 9.2.7. Healthcare & Life Science
- 9.1. Market Analysis, Insights and Forecast - by Technology Type
- 10. Middle East and Africa Hyperautomation Market Analysis, Insights and Forecast, 2019-2031
- 10.1. Market Analysis, Insights and Forecast - by Technology Type
- 10.1.1. RPA
- 10.1.2. AI/ML
- 10.1.3. Biometrics
- 10.1.4. Context-Aware Computing
- 10.1.5. Natural Learning Generation
- 10.2. Market Analysis, Insights and Forecast - by End-User Industry
- 10.2.1. BFSI
- 10.2.2. Retail
- 10.2.3. IT & Telecom
- 10.2.4. Education
- 10.2.5. Automotive
- 10.2.6. Manufacturing
- 10.2.7. Healthcare & Life Science
- 10.1. Market Analysis, Insights and Forecast - by Technology Type
- 11. North America Hyperautomation Market Analysis, Insights and Forecast, 2019-2031
- 11.1. Market Analysis, Insights and Forecast - By Country/Sub-region
- 11.1.1 United States
- 11.1.2 Canada
- 11.1.3 Mexico
- 12. Europe Hyperautomation Market Analysis, Insights and Forecast, 2019-2031
- 12.1. Market Analysis, Insights and Forecast - By Country/Sub-region
- 12.1.1 Germany
- 12.1.2 United Kingdom
- 12.1.3 France
- 12.1.4 Spain
- 12.1.5 Italy
- 12.1.6 Spain
- 12.1.7 Belgium
- 12.1.8 Netherland
- 12.1.9 Nordics
- 12.1.10 Rest of Europe
- 13. Asia Pacific Hyperautomation Market Analysis, Insights and Forecast, 2019-2031
- 13.1. Market Analysis, Insights and Forecast - By Country/Sub-region
- 13.1.1 China
- 13.1.2 Japan
- 13.1.3 India
- 13.1.4 South Korea
- 13.1.5 Southeast Asia
- 13.1.6 Australia
- 13.1.7 Indonesia
- 13.1.8 Phillipes
- 13.1.9 Singapore
- 13.1.10 Thailandc
- 13.1.11 Rest of Asia Pacific
- 14. South America Hyperautomation Market Analysis, Insights and Forecast, 2019-2031
- 14.1. Market Analysis, Insights and Forecast - By Country/Sub-region
- 14.1.1 Brazil
- 14.1.2 Argentina
- 14.1.3 Peru
- 14.1.4 Chile
- 14.1.5 Colombia
- 14.1.6 Ecuador
- 14.1.7 Venezuela
- 14.1.8 Rest of South America
- 15. North America Hyperautomation Market Analysis, Insights and Forecast, 2019-2031
- 15.1. Market Analysis, Insights and Forecast - By Country/Sub-region
- 15.1.1 United States
- 15.1.2 Canada
- 15.1.3 Mexico
- 16. MEA Hyperautomation Market Analysis, Insights and Forecast, 2019-2031
- 16.1. Market Analysis, Insights and Forecast - By Country/Sub-region
- 16.1.1 United Arab Emirates
- 16.1.2 Saudi Arabia
- 16.1.3 South Africa
- 16.1.4 Rest of Middle East and Africa
- 17. Competitive Analysis
- 17.1. Global Market Share Analysis 2024
- 17.2. Company Profiles
- 17.2.1 Automate io
- 17.2.1.1. Overview
- 17.2.1.2. Products
- 17.2.1.3. SWOT Analysis
- 17.2.1.4. Recent Developments
- 17.2.1.5. Financials (Based on Availability)
- 17.2.2 OneGlobe LLC
- 17.2.2.1. Overview
- 17.2.2.2. Products
- 17.2.2.3. SWOT Analysis
- 17.2.2.4. Recent Developments
- 17.2.2.5. Financials (Based on Availability)
- 17.2.3 Mitsubishi Electric Corporation
- 17.2.3.1. Overview
- 17.2.3.2. Products
- 17.2.3.3. SWOT Analysis
- 17.2.3.4. Recent Developments
- 17.2.3.5. Financials (Based on Availability)
- 17.2.4 akaBot
- 17.2.4.1. Overview
- 17.2.4.2. Products
- 17.2.4.3. SWOT Analysis
- 17.2.4.4. Recent Developments
- 17.2.4.5. Financials (Based on Availability)
- 17.2.5 Alteryx
- 17.2.5.1. Overview
- 17.2.5.2. Products
- 17.2.5.3. SWOT Analysis
- 17.2.5.4. Recent Developments
- 17.2.5.5. Financials (Based on Availability)
- 17.2.6 Automation Anywhere
- 17.2.6.1. Overview
- 17.2.6.2. Products
- 17.2.6.3. SWOT Analysis
- 17.2.6.4. Recent Developments
- 17.2.6.5. Financials (Based on Availability)
- 17.2.7 Rocketbot
- 17.2.7.1. Overview
- 17.2.7.2. Products
- 17.2.7.3. SWOT Analysis
- 17.2.7.4. Recent Developments
- 17.2.7.5. Financials (Based on Availability)
- 17.2.8 Simple Fractal
- 17.2.8.1. Overview
- 17.2.8.2. Products
- 17.2.8.3. SWOT Analysis
- 17.2.8.4. Recent Developments
- 17.2.8.5. Financials (Based on Availability)
- 17.2.9 Catalytic Inc
- 17.2.9.1. Overview
- 17.2.9.2. Products
- 17.2.9.3. SWOT Analysis
- 17.2.9.4. Recent Developments
- 17.2.9.5. Financials (Based on Availability)
- 17.2.10 SolveXia
- 17.2.10.1. Overview
- 17.2.10.2. Products
- 17.2.10.3. SWOT Analysis
- 17.2.10.4. Recent Developments
- 17.2.10.5. Financials (Based on Availability)
- 17.2.11 UiPath
- 17.2.11.1. Overview
- 17.2.11.2. Products
- 17.2.11.3. SWOT Analysis
- 17.2.11.4. Recent Developments
- 17.2.11.5. Financials (Based on Availability)
- 17.2.1 Automate io
List of Figures
- Figure 1: Global Hyperautomation Market Revenue Breakdown (Million, %) by Region 2024 & 2032
- Figure 2: Global Hyperautomation Market Volume Breakdown (K Unit, %) by Region 2024 & 2032
- Figure 3: North America Hyperautomation Market Revenue (Million), by Country 2024 & 2032
- Figure 4: North America Hyperautomation Market Volume (K Unit), by Country 2024 & 2032
- Figure 5: North America Hyperautomation Market Revenue Share (%), by Country 2024 & 2032
- Figure 6: North America Hyperautomation Market Volume Share (%), by Country 2024 & 2032
- Figure 7: Europe Hyperautomation Market Revenue (Million), by Country 2024 & 2032
- Figure 8: Europe Hyperautomation Market Volume (K Unit), by Country 2024 & 2032
- Figure 9: Europe Hyperautomation Market Revenue Share (%), by Country 2024 & 2032
- Figure 10: Europe Hyperautomation Market Volume Share (%), by Country 2024 & 2032
- Figure 11: Asia Pacific Hyperautomation Market Revenue (Million), by Country 2024 & 2032
- Figure 12: Asia Pacific Hyperautomation Market Volume (K Unit), by Country 2024 & 2032
- Figure 13: Asia Pacific Hyperautomation Market Revenue Share (%), by Country 2024 & 2032
- Figure 14: Asia Pacific Hyperautomation Market Volume Share (%), by Country 2024 & 2032
- Figure 15: South America Hyperautomation Market Revenue (Million), by Country 2024 & 2032
- Figure 16: South America Hyperautomation Market Volume (K Unit), by Country 2024 & 2032
- Figure 17: South America Hyperautomation Market Revenue Share (%), by Country 2024 & 2032
- Figure 18: South America Hyperautomation Market Volume Share (%), by Country 2024 & 2032
- Figure 19: North America Hyperautomation Market Revenue (Million), by Country 2024 & 2032
- Figure 20: North America Hyperautomation Market Volume (K Unit), by Country 2024 & 2032
- Figure 21: North America Hyperautomation Market Revenue Share (%), by Country 2024 & 2032
- Figure 22: North America Hyperautomation Market Volume Share (%), by Country 2024 & 2032
- Figure 23: MEA Hyperautomation Market Revenue (Million), by Country 2024 & 2032
- Figure 24: MEA Hyperautomation Market Volume (K Unit), by Country 2024 & 2032
- Figure 25: MEA Hyperautomation Market Revenue Share (%), by Country 2024 & 2032
- Figure 26: MEA Hyperautomation Market Volume Share (%), by Country 2024 & 2032
- Figure 27: North America Hyperautomation Market Revenue (Million), by Technology Type 2024 & 2032
- Figure 28: North America Hyperautomation Market Volume (K Unit), by Technology Type 2024 & 2032
- Figure 29: North America Hyperautomation Market Revenue Share (%), by Technology Type 2024 & 2032
- Figure 30: North America Hyperautomation Market Volume Share (%), by Technology Type 2024 & 2032
- Figure 31: North America Hyperautomation Market Revenue (Million), by End-User Industry 2024 & 2032
- Figure 32: North America Hyperautomation Market Volume (K Unit), by End-User Industry 2024 & 2032
- Figure 33: North America Hyperautomation Market Revenue Share (%), by End-User Industry 2024 & 2032
- Figure 34: North America Hyperautomation Market Volume Share (%), by End-User Industry 2024 & 2032
- Figure 35: North America Hyperautomation Market Revenue (Million), by Country 2024 & 2032
- Figure 36: North America Hyperautomation Market Volume (K Unit), by Country 2024 & 2032
- Figure 37: North America Hyperautomation Market Revenue Share (%), by Country 2024 & 2032
- Figure 38: North America Hyperautomation Market Volume Share (%), by Country 2024 & 2032
- Figure 39: Asia Pacific Hyperautomation Market Revenue (Million), by Technology Type 2024 & 2032
- Figure 40: Asia Pacific Hyperautomation Market Volume (K Unit), by Technology Type 2024 & 2032
- Figure 41: Asia Pacific Hyperautomation Market Revenue Share (%), by Technology Type 2024 & 2032
- Figure 42: Asia Pacific Hyperautomation Market Volume Share (%), by Technology Type 2024 & 2032
- Figure 43: Asia Pacific Hyperautomation Market Revenue (Million), by End-User Industry 2024 & 2032
- Figure 44: Asia Pacific Hyperautomation Market Volume (K Unit), by End-User Industry 2024 & 2032
- Figure 45: Asia Pacific Hyperautomation Market Revenue Share (%), by End-User Industry 2024 & 2032
- Figure 46: Asia Pacific Hyperautomation Market Volume Share (%), by End-User Industry 2024 & 2032
- Figure 47: Asia Pacific Hyperautomation Market Revenue (Million), by Country 2024 & 2032
- Figure 48: Asia Pacific Hyperautomation Market Volume (K Unit), by Country 2024 & 2032
- Figure 49: Asia Pacific Hyperautomation Market Revenue Share (%), by Country 2024 & 2032
- Figure 50: Asia Pacific Hyperautomation Market Volume Share (%), by Country 2024 & 2032
- Figure 51: Europe Hyperautomation Market Revenue (Million), by Technology Type 2024 & 2032
- Figure 52: Europe Hyperautomation Market Volume (K Unit), by Technology Type 2024 & 2032
- Figure 53: Europe Hyperautomation Market Revenue Share (%), by Technology Type 2024 & 2032
- Figure 54: Europe Hyperautomation Market Volume Share (%), by Technology Type 2024 & 2032
- Figure 55: Europe Hyperautomation Market Revenue (Million), by End-User Industry 2024 & 2032
- Figure 56: Europe Hyperautomation Market Volume (K Unit), by End-User Industry 2024 & 2032
- Figure 57: Europe Hyperautomation Market Revenue Share (%), by End-User Industry 2024 & 2032
- Figure 58: Europe Hyperautomation Market Volume Share (%), by End-User Industry 2024 & 2032
- Figure 59: Europe Hyperautomation Market Revenue (Million), by Country 2024 & 2032
- Figure 60: Europe Hyperautomation Market Volume (K Unit), by Country 2024 & 2032
- Figure 61: Europe Hyperautomation Market Revenue Share (%), by Country 2024 & 2032
- Figure 62: Europe Hyperautomation Market Volume Share (%), by Country 2024 & 2032
- Figure 63: Latin America Hyperautomation Market Revenue (Million), by Technology Type 2024 & 2032
- Figure 64: Latin America Hyperautomation Market Volume (K Unit), by Technology Type 2024 & 2032
- Figure 65: Latin America Hyperautomation Market Revenue Share (%), by Technology Type 2024 & 2032
- Figure 66: Latin America Hyperautomation Market Volume Share (%), by Technology Type 2024 & 2032
- Figure 67: Latin America Hyperautomation Market Revenue (Million), by End-User Industry 2024 & 2032
- Figure 68: Latin America Hyperautomation Market Volume (K Unit), by End-User Industry 2024 & 2032
- Figure 69: Latin America Hyperautomation Market Revenue Share (%), by End-User Industry 2024 & 2032
- Figure 70: Latin America Hyperautomation Market Volume Share (%), by End-User Industry 2024 & 2032
- Figure 71: Latin America Hyperautomation Market Revenue (Million), by Country 2024 & 2032
- Figure 72: Latin America Hyperautomation Market Volume (K Unit), by Country 2024 & 2032
- Figure 73: Latin America Hyperautomation Market Revenue Share (%), by Country 2024 & 2032
- Figure 74: Latin America Hyperautomation Market Volume Share (%), by Country 2024 & 2032
- Figure 75: Middle East and Africa Hyperautomation Market Revenue (Million), by Technology Type 2024 & 2032
- Figure 76: Middle East and Africa Hyperautomation Market Volume (K Unit), by Technology Type 2024 & 2032
- Figure 77: Middle East and Africa Hyperautomation Market Revenue Share (%), by Technology Type 2024 & 2032
- Figure 78: Middle East and Africa Hyperautomation Market Volume Share (%), by Technology Type 2024 & 2032
- Figure 79: Middle East and Africa Hyperautomation Market Revenue (Million), by End-User Industry 2024 & 2032
- Figure 80: Middle East and Africa Hyperautomation Market Volume (K Unit), by End-User Industry 2024 & 2032
- Figure 81: Middle East and Africa Hyperautomation Market Revenue Share (%), by End-User Industry 2024 & 2032
- Figure 82: Middle East and Africa Hyperautomation Market Volume Share (%), by End-User Industry 2024 & 2032
- Figure 83: Middle East and Africa Hyperautomation Market Revenue (Million), by Country 2024 & 2032
- Figure 84: Middle East and Africa Hyperautomation Market Volume (K Unit), by Country 2024 & 2032
- Figure 85: Middle East and Africa Hyperautomation Market Revenue Share (%), by Country 2024 & 2032
- Figure 86: Middle East and Africa Hyperautomation Market Volume Share (%), by Country 2024 & 2032
List of Tables
- Table 1: Global Hyperautomation Market Revenue Million Forecast, by Region 2019 & 2032
- Table 2: Global Hyperautomation Market Volume K Unit Forecast, by Region 2019 & 2032
- Table 3: Global Hyperautomation Market Revenue Million Forecast, by Technology Type 2019 & 2032
- Table 4: Global Hyperautomation Market Volume K Unit Forecast, by Technology Type 2019 & 2032
- Table 5: Global Hyperautomation Market Revenue Million Forecast, by End-User Industry 2019 & 2032
- Table 6: Global Hyperautomation Market Volume K Unit Forecast, by End-User Industry 2019 & 2032
- Table 7: Global Hyperautomation Market Revenue Million Forecast, by Region 2019 & 2032
- Table 8: Global Hyperautomation Market Volume K Unit Forecast, by Region 2019 & 2032
- Table 9: Global Hyperautomation Market Revenue Million Forecast, by Country 2019 & 2032
- Table 10: Global Hyperautomation Market Volume K Unit Forecast, by Country 2019 & 2032
- Table 11: United States Hyperautomation Market Revenue (Million) Forecast, by Application 2019 & 2032
- Table 12: United States Hyperautomation Market Volume (K Unit) Forecast, by Application 2019 & 2032
- Table 13: Canada Hyperautomation Market Revenue (Million) Forecast, by Application 2019 & 2032
- Table 14: Canada Hyperautomation Market Volume (K Unit) Forecast, by Application 2019 & 2032
- Table 15: Mexico Hyperautomation Market Revenue (Million) Forecast, by Application 2019 & 2032
- Table 16: Mexico Hyperautomation Market Volume (K Unit) Forecast, by Application 2019 & 2032
- Table 17: Global Hyperautomation Market Revenue Million Forecast, by Country 2019 & 2032
- Table 18: Global Hyperautomation Market Volume K Unit Forecast, by Country 2019 & 2032
- Table 19: Germany Hyperautomation Market Revenue (Million) Forecast, by Application 2019 & 2032
- Table 20: Germany Hyperautomation Market Volume (K Unit) Forecast, by Application 2019 & 2032
- Table 21: United Kingdom Hyperautomation Market Revenue (Million) Forecast, by Application 2019 & 2032
- Table 22: United Kingdom Hyperautomation Market Volume (K Unit) Forecast, by Application 2019 & 2032
- Table 23: France Hyperautomation Market Revenue (Million) Forecast, by Application 2019 & 2032
- Table 24: France Hyperautomation Market Volume (K Unit) Forecast, by Application 2019 & 2032
- Table 25: Spain Hyperautomation Market Revenue (Million) Forecast, by Application 2019 & 2032
- Table 26: Spain Hyperautomation Market Volume (K Unit) Forecast, by Application 2019 & 2032
- Table 27: Italy Hyperautomation Market Revenue (Million) Forecast, by Application 2019 & 2032
- Table 28: Italy Hyperautomation Market Volume (K Unit) Forecast, by Application 2019 & 2032
- Table 29: Spain Hyperautomation Market Revenue (Million) Forecast, by Application 2019 & 2032
- Table 30: Spain Hyperautomation Market Volume (K Unit) Forecast, by Application 2019 & 2032
- Table 31: Belgium Hyperautomation Market Revenue (Million) Forecast, by Application 2019 & 2032
- Table 32: Belgium Hyperautomation Market Volume (K Unit) Forecast, by Application 2019 & 2032
- Table 33: Netherland Hyperautomation Market Revenue (Million) Forecast, by Application 2019 & 2032
- Table 34: Netherland Hyperautomation Market Volume (K Unit) Forecast, by Application 2019 & 2032
- Table 35: Nordics Hyperautomation Market Revenue (Million) Forecast, by Application 2019 & 2032
- Table 36: Nordics Hyperautomation Market Volume (K Unit) Forecast, by Application 2019 & 2032
- Table 37: Rest of Europe Hyperautomation Market Revenue (Million) Forecast, by Application 2019 & 2032
- Table 38: Rest of Europe Hyperautomation Market Volume (K Unit) Forecast, by Application 2019 & 2032
- Table 39: Global Hyperautomation Market Revenue Million Forecast, by Country 2019 & 2032
- Table 40: Global Hyperautomation Market Volume K Unit Forecast, by Country 2019 & 2032
- Table 41: China Hyperautomation Market Revenue (Million) Forecast, by Application 2019 & 2032
- Table 42: China Hyperautomation Market Volume (K Unit) Forecast, by Application 2019 & 2032
- Table 43: Japan Hyperautomation Market Revenue (Million) Forecast, by Application 2019 & 2032
- Table 44: Japan Hyperautomation Market Volume (K Unit) Forecast, by Application 2019 & 2032
- Table 45: India Hyperautomation Market Revenue (Million) Forecast, by Application 2019 & 2032
- Table 46: India Hyperautomation Market Volume (K Unit) Forecast, by Application 2019 & 2032
- Table 47: South Korea Hyperautomation Market Revenue (Million) Forecast, by Application 2019 & 2032
- Table 48: South Korea Hyperautomation Market Volume (K Unit) Forecast, by Application 2019 & 2032
- Table 49: Southeast Asia Hyperautomation Market Revenue (Million) Forecast, by Application 2019 & 2032
- Table 50: Southeast Asia Hyperautomation Market Volume (K Unit) Forecast, by Application 2019 & 2032
- Table 51: Australia Hyperautomation Market Revenue (Million) Forecast, by Application 2019 & 2032
- Table 52: Australia Hyperautomation Market Volume (K Unit) Forecast, by Application 2019 & 2032
- Table 53: Indonesia Hyperautomation Market Revenue (Million) Forecast, by Application 2019 & 2032
- Table 54: Indonesia Hyperautomation Market Volume (K Unit) Forecast, by Application 2019 & 2032
- Table 55: Phillipes Hyperautomation Market Revenue (Million) Forecast, by Application 2019 & 2032
- Table 56: Phillipes Hyperautomation Market Volume (K Unit) Forecast, by Application 2019 & 2032
- Table 57: Singapore Hyperautomation Market Revenue (Million) Forecast, by Application 2019 & 2032
- Table 58: Singapore Hyperautomation Market Volume (K Unit) Forecast, by Application 2019 & 2032
- Table 59: Thailandc Hyperautomation Market Revenue (Million) Forecast, by Application 2019 & 2032
- Table 60: Thailandc Hyperautomation Market Volume (K Unit) Forecast, by Application 2019 & 2032
- Table 61: Rest of Asia Pacific Hyperautomation Market Revenue (Million) Forecast, by Application 2019 & 2032
- Table 62: Rest of Asia Pacific Hyperautomation Market Volume (K Unit) Forecast, by Application 2019 & 2032
- Table 63: Global Hyperautomation Market Revenue Million Forecast, by Country 2019 & 2032
- Table 64: Global Hyperautomation Market Volume K Unit Forecast, by Country 2019 & 2032
- Table 65: Brazil Hyperautomation Market Revenue (Million) Forecast, by Application 2019 & 2032
- Table 66: Brazil Hyperautomation Market Volume (K Unit) Forecast, by Application 2019 & 2032
- Table 67: Argentina Hyperautomation Market Revenue (Million) Forecast, by Application 2019 & 2032
- Table 68: Argentina Hyperautomation Market Volume (K Unit) Forecast, by Application 2019 & 2032
- Table 69: Peru Hyperautomation Market Revenue (Million) Forecast, by Application 2019 & 2032
- Table 70: Peru Hyperautomation Market Volume (K Unit) Forecast, by Application 2019 & 2032
- Table 71: Chile Hyperautomation Market Revenue (Million) Forecast, by Application 2019 & 2032
- Table 72: Chile Hyperautomation Market Volume (K Unit) Forecast, by Application 2019 & 2032
- Table 73: Colombia Hyperautomation Market Revenue (Million) Forecast, by Application 2019 & 2032
- Table 74: Colombia Hyperautomation Market Volume (K Unit) Forecast, by Application 2019 & 2032
- Table 75: Ecuador Hyperautomation Market Revenue (Million) Forecast, by Application 2019 & 2032
- Table 76: Ecuador Hyperautomation Market Volume (K Unit) Forecast, by Application 2019 & 2032
- Table 77: Venezuela Hyperautomation Market Revenue (Million) Forecast, by Application 2019 & 2032
- Table 78: Venezuela Hyperautomation Market Volume (K Unit) Forecast, by Application 2019 & 2032
- Table 79: Rest of South America Hyperautomation Market Revenue (Million) Forecast, by Application 2019 & 2032
- Table 80: Rest of South America Hyperautomation Market Volume (K Unit) Forecast, by Application 2019 & 2032
- Table 81: Global Hyperautomation Market Revenue Million Forecast, by Country 2019 & 2032
- Table 82: Global Hyperautomation Market Volume K Unit Forecast, by Country 2019 & 2032
- Table 83: United States Hyperautomation Market Revenue (Million) Forecast, by Application 2019 & 2032
- Table 84: United States Hyperautomation Market Volume (K Unit) Forecast, by Application 2019 & 2032
- Table 85: Canada Hyperautomation Market Revenue (Million) Forecast, by Application 2019 & 2032
- Table 86: Canada Hyperautomation Market Volume (K Unit) Forecast, by Application 2019 & 2032
- Table 87: Mexico Hyperautomation Market Revenue (Million) Forecast, by Application 2019 & 2032
- Table 88: Mexico Hyperautomation Market Volume (K Unit) Forecast, by Application 2019 & 2032
- Table 89: Global Hyperautomation Market Revenue Million Forecast, by Country 2019 & 2032
- Table 90: Global Hyperautomation Market Volume K Unit Forecast, by Country 2019 & 2032
- Table 91: United Arab Emirates Hyperautomation Market Revenue (Million) Forecast, by Application 2019 & 2032
- Table 92: United Arab Emirates Hyperautomation Market Volume (K Unit) Forecast, by Application 2019 & 2032
- Table 93: Saudi Arabia Hyperautomation Market Revenue (Million) Forecast, by Application 2019 & 2032
- Table 94: Saudi Arabia Hyperautomation Market Volume (K Unit) Forecast, by Application 2019 & 2032
- Table 95: South Africa Hyperautomation Market Revenue (Million) Forecast, by Application 2019 & 2032
- Table 96: South Africa Hyperautomation Market Volume (K Unit) Forecast, by Application 2019 & 2032
- Table 97: Rest of Middle East and Africa Hyperautomation Market Revenue (Million) Forecast, by Application 2019 & 2032
- Table 98: Rest of Middle East and Africa Hyperautomation Market Volume (K Unit) Forecast, by Application 2019 & 2032
- Table 99: Global Hyperautomation Market Revenue Million Forecast, by Technology Type 2019 & 2032
- Table 100: Global Hyperautomation Market Volume K Unit Forecast, by Technology Type 2019 & 2032
- Table 101: Global Hyperautomation Market Revenue Million Forecast, by End-User Industry 2019 & 2032
- Table 102: Global Hyperautomation Market Volume K Unit Forecast, by End-User Industry 2019 & 2032
- Table 103: Global Hyperautomation Market Revenue Million Forecast, by Country 2019 & 2032
- Table 104: Global Hyperautomation Market Volume K Unit Forecast, by Country 2019 & 2032
- Table 105: Global Hyperautomation Market Revenue Million Forecast, by Technology Type 2019 & 2032
- Table 106: Global Hyperautomation Market Volume K Unit Forecast, by Technology Type 2019 & 2032
- Table 107: Global Hyperautomation Market Revenue Million Forecast, by End-User Industry 2019 & 2032
- Table 108: Global Hyperautomation Market Volume K Unit Forecast, by End-User Industry 2019 & 2032
- Table 109: Global Hyperautomation Market Revenue Million Forecast, by Country 2019 & 2032
- Table 110: Global Hyperautomation Market Volume K Unit Forecast, by Country 2019 & 2032
- Table 111: Global Hyperautomation Market Revenue Million Forecast, by Technology Type 2019 & 2032
- Table 112: Global Hyperautomation Market Volume K Unit Forecast, by Technology Type 2019 & 2032
- Table 113: Global Hyperautomation Market Revenue Million Forecast, by End-User Industry 2019 & 2032
- Table 114: Global Hyperautomation Market Volume K Unit Forecast, by End-User Industry 2019 & 2032
- Table 115: Global Hyperautomation Market Revenue Million Forecast, by Country 2019 & 2032
- Table 116: Global Hyperautomation Market Volume K Unit Forecast, by Country 2019 & 2032
- Table 117: Global Hyperautomation Market Revenue Million Forecast, by Technology Type 2019 & 2032
- Table 118: Global Hyperautomation Market Volume K Unit Forecast, by Technology Type 2019 & 2032
- Table 119: Global Hyperautomation Market Revenue Million Forecast, by End-User Industry 2019 & 2032
- Table 120: Global Hyperautomation Market Volume K Unit Forecast, by End-User Industry 2019 & 2032
- Table 121: Global Hyperautomation Market Revenue Million Forecast, by Country 2019 & 2032
- Table 122: Global Hyperautomation Market Volume K Unit Forecast, by Country 2019 & 2032
- Table 123: Global Hyperautomation Market Revenue Million Forecast, by Technology Type 2019 & 2032
- Table 124: Global Hyperautomation Market Volume K Unit Forecast, by Technology Type 2019 & 2032
- Table 125: Global Hyperautomation Market Revenue Million Forecast, by End-User Industry 2019 & 2032
- Table 126: Global Hyperautomation Market Volume K Unit Forecast, by End-User Industry 2019 & 2032
- Table 127: Global Hyperautomation Market Revenue Million Forecast, by Country 2019 & 2032
- Table 128: Global Hyperautomation Market Volume K Unit Forecast, by Country 2019 & 2032
Frequently Asked Questions
1. What is the projected Compound Annual Growth Rate (CAGR) of the Hyperautomation Market?
The projected CAGR is approximately 19.80%.
2. Which companies are prominent players in the Hyperautomation Market?
Key companies in the market include Automate io, OneGlobe LLC, Mitsubishi Electric Corporation, akaBot, Alteryx, Automation Anywhere, Rocketbot, Simple Fractal, Catalytic Inc, SolveXia, UiPath.
3. What are the main segments of the Hyperautomation Market?
The market segments include Technology Type, End-User Industry.
4. Can you provide details about the market size?
The market size is estimated to be USD 12.95 Million as of 2022.
5. What are some drivers contributing to market growth?
Increasing Automation Trends in the Manufacturing Sector; Increased penetration of digitalization. coupled with growing demand for improved efficiency and reduced operating costs; Growing applications of RPA and AI.
6. What are the notable trends driving market growth?
The Machine Learning Segment is Expected to Drive the Market's Growth.
7. Are there any restraints impacting market growth?
High initial cost of adoption; Lack of skilled personnel.
8. Can you provide examples of recent developments in the market?
September 2022 - The e.IQ 5.0 - Nile Edition has been launched to improve the platform's features for building automated business applications at scale. The features include process orchestration, data and event processing, AI/ML, enterprise connectors, and front-end application development, all of which use a straightforward low-code/no-code interface. In addition to introducing a taxonomy builder for multilevel taxonomy management that cuts across business domains, the release expands the unified data experience offering of the hyperautomation enablement platform, as seen in the 4.0 release. It makes data actionable for simple decision automation.
9. What pricing options are available for accessing the report?
Pricing options include single-user, multi-user, and enterprise licenses priced at USD 4750, USD 5250, and USD 8750 respectively.
10. Is the market size provided in terms of value or volume?
The market size is provided in terms of value, measured in Million and volume, measured in K Unit.
11. Are there any specific market keywords associated with the report?
Yes, the market keyword associated with the report is "Hyperautomation Market," which aids in identifying and referencing the specific market segment covered.
12. How do I determine which pricing option suits my needs best?
The pricing options vary based on user requirements and access needs. Individual users may opt for single-user licenses, while businesses requiring broader access may choose multi-user or enterprise licenses for cost-effective access to the report.
13. Are there any additional resources or data provided in the Hyperautomation Market report?
While the report offers comprehensive insights, it's advisable to review the specific contents or supplementary materials provided to ascertain if additional resources or data are available.
14. How can I stay updated on further developments or reports in the Hyperautomation Market?
To stay informed about further developments, trends, and reports in the Hyperautomation Market, consider subscribing to industry newsletters, following relevant companies and organizations, or regularly checking reputable industry news sources and publications.
Methodology
Step 1 - Identification of Relevant Samples Size from Population Database


Step 2 - Approaches for Defining Global Market Size (Value, Volume* & Price*)

Note*: In applicable scenarios
Step 3 - Data Sources
Primary Research
- Web Analytics
- Survey Reports
- Research Institute
- Latest Research Reports
- Opinion Leaders
Secondary Research
- Annual Reports
- White Paper
- Latest Press Release
- Industry Association
- Paid Database
- Investor Presentations

Step 4 - Data Triangulation
Involves using different sources of information in order to increase the validity of a study
These sources are likely to be stakeholders in a program - participants, other researchers, program staff, other community members, and so on.
Then we put all data in single framework & apply various statistical tools to find out the dynamic on the market.
During the analysis stage, feedback from the stakeholder groups would be compared to determine areas of agreement as well as areas of divergence


