Key Insights
The in-game advertising market is set for substantial expansion, driven by the escalating popularity of mobile gaming and innovative ad technologies like rewarded video and playable ads. Projected at $60.6 billion by 2024, the market demonstrates a robust Compound Annual Growth Rate (CAGR) of 11.1%. Advanced analytics further enhance campaign performance through precise targeting. Market segmentation includes static, dynamic, and advergaming formats, offering diverse advertising opportunities. Key players such as Blizzard Entertainment, Electronic Arts, and Google are pioneering new ad experiences, fostering a competitive landscape. North America, Europe, and Asia-Pacific lead market presence, with significant untapped potential in emerging economies.
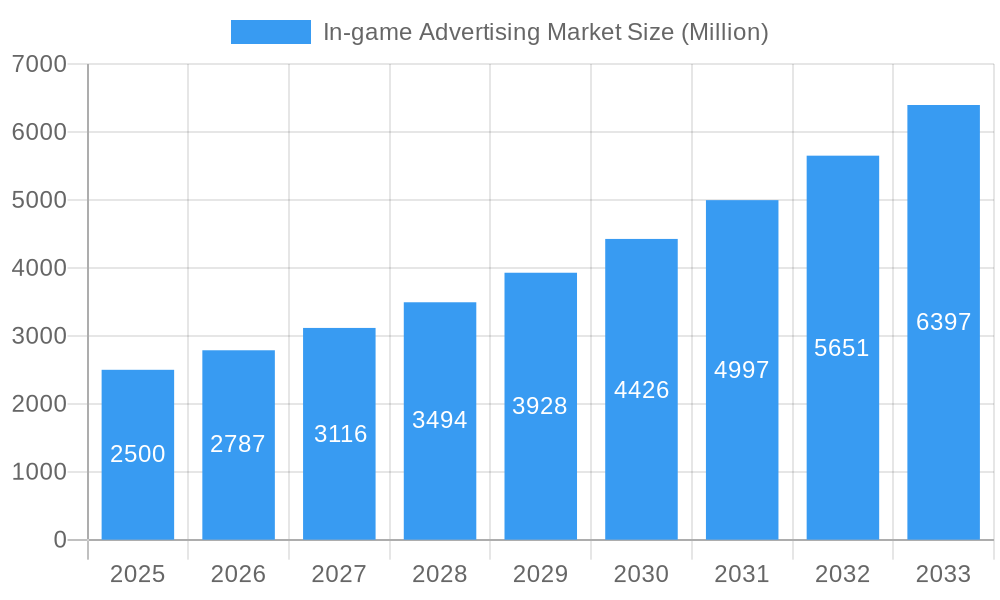
In-game Advertising Market Market Size (In Billion)
Continued growth is expected through 2033, influenced by evolving consumer preferences, technological advancements, and regulatory shifts. Sophisticated in-game advertising technology, coupled with a focus on user privacy and data security, will shape market evolution. Strategic collaborations between game developers, ad networks, and advertisers are vital for sustained growth, enabling seamless and engaging ad integrations. Personalized, non-intrusive advertising formats will likely dominate the market, driving further adoption.
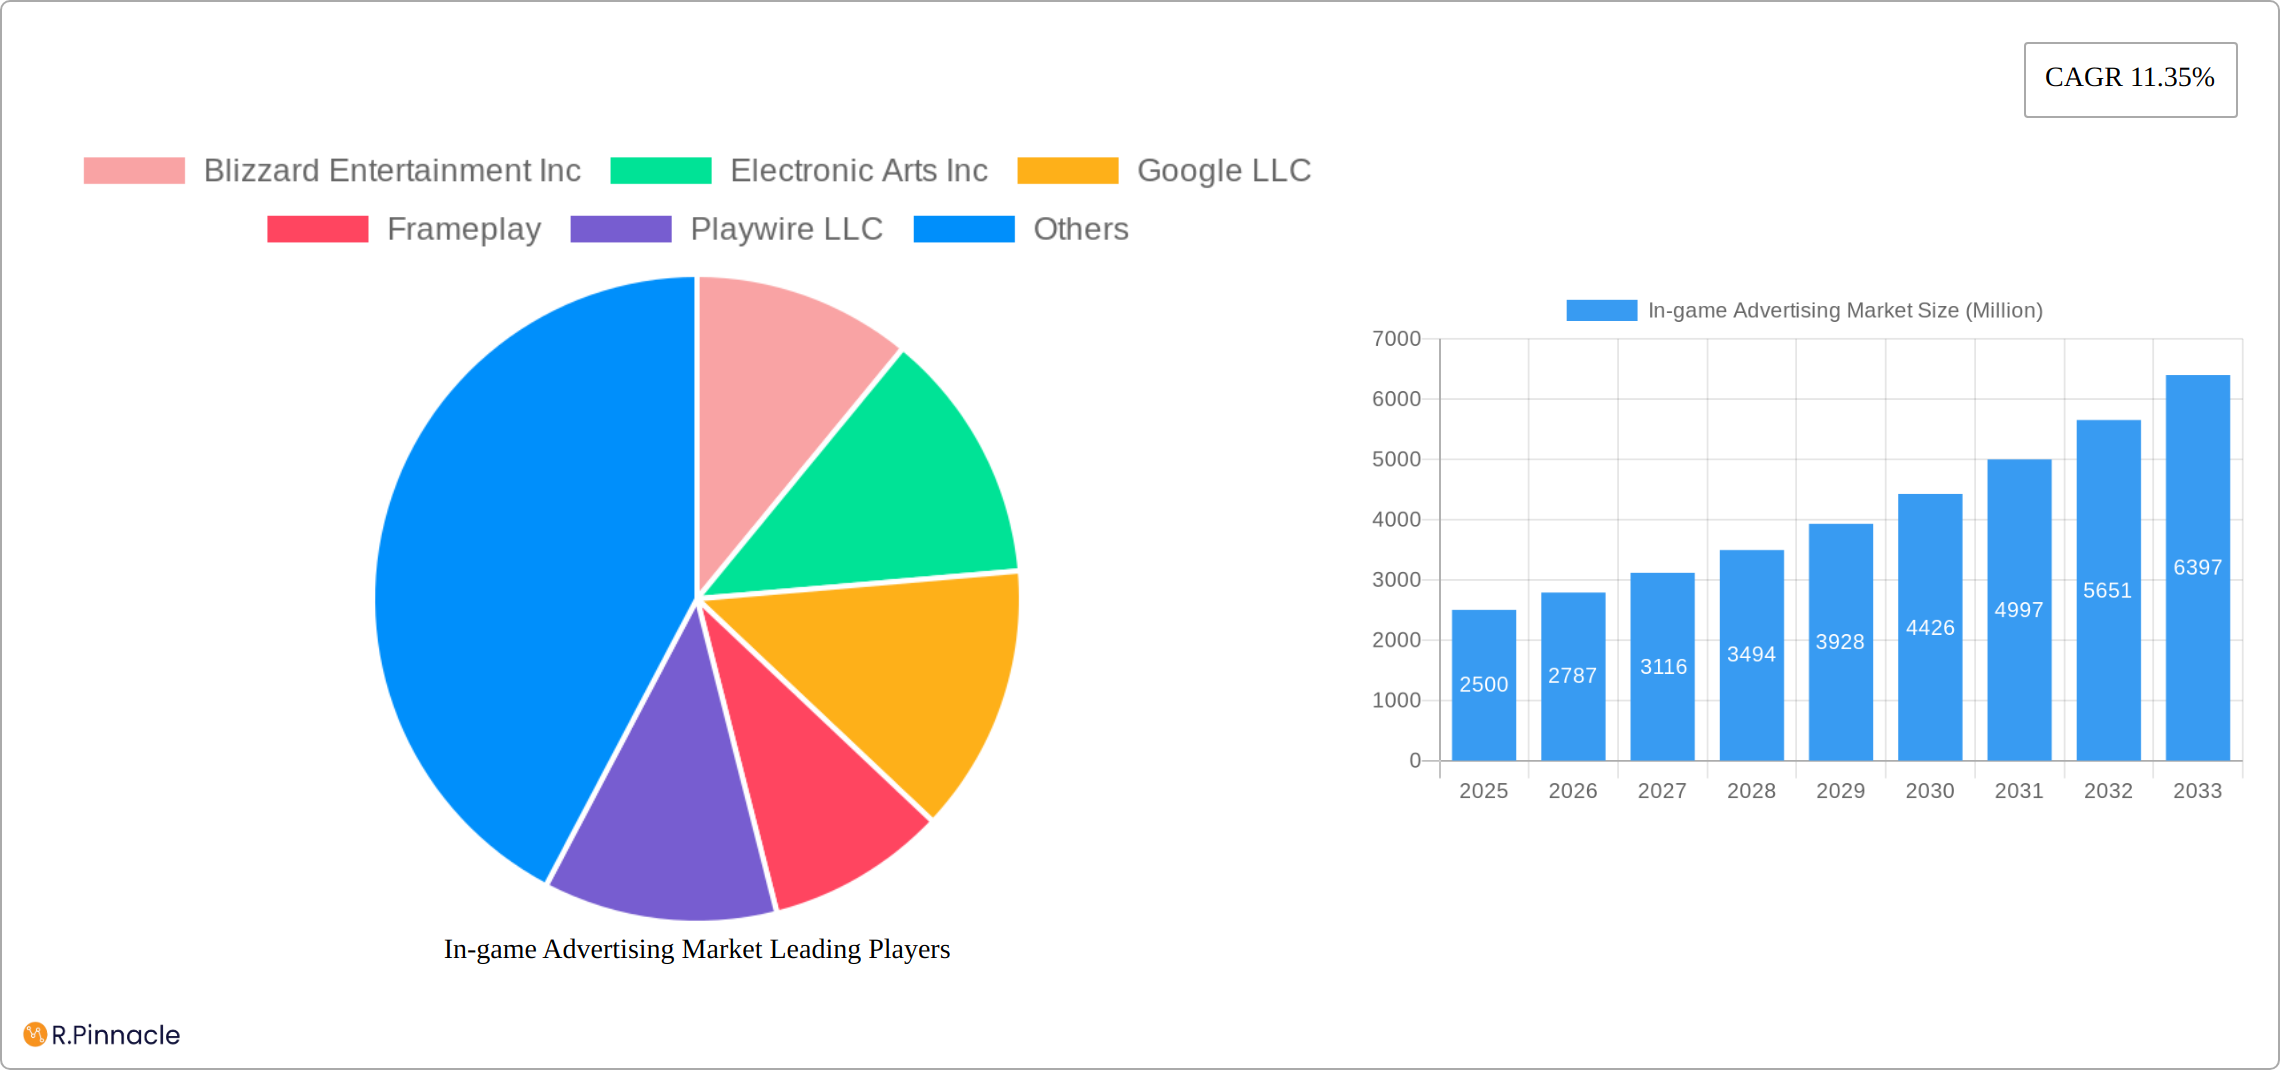
In-game Advertising Market Company Market Share
In-Game Advertising Market: A Comprehensive Report (2019-2033)
This meticulously researched report provides a deep dive into the In-Game Advertising market, offering actionable insights for industry professionals, investors, and strategic decision-makers. We analyze market trends, competitive dynamics, and future growth prospects, covering the period from 2019 to 2033, with a focus on the estimated year 2025. The report leverages extensive data analysis to present a clear and concise overview of this rapidly evolving sector.
In-game Advertising Market Market Structure & Innovation Trends
The in-game advertising market is experiencing significant growth, driven by technological advancements and the increasing popularity of gaming. Market concentration is moderate, with key players such as Blizzard Entertainment Inc, Electronic Arts Inc, and Google LLC holding significant market share, estimated at xx%, xx%, and xx% respectively in 2025. However, smaller companies like Frameplay, Playwire LLC, and Anzu Virtual Reality Ltd are also making inroads with innovative ad formats. The market is characterized by a dynamic landscape with continuous innovation in ad formats (static, dynamic, advergaming), fuelled by the integration of advanced technologies such as AR/VR and AI. Regulatory frameworks, while still developing, are increasingly focusing on user privacy and data protection. Substitutes for in-game advertising include traditional advertising methods and influencer marketing, while M&A activity is expected to increase, with deal values potentially reaching xx Million in the forecast period (2025-2033). End-user demographics are expanding, with a growing segment of older gamers and broader mobile penetration driving growth.
In-game Advertising Market Market Dynamics & Trends
The in-game advertising market is experiencing explosive growth, projected to achieve a remarkable CAGR of xx% from 2025 to 2033. This surge is fueled by a confluence of factors: the dramatic increase in global mobile and PC gamers, the adoption of diverse game monetization strategies, and the emergence of innovative, less intrusive ad formats. The integration of cutting-edge technologies like blockchain and metaverse platforms is creating exciting new opportunities for advertisers to reach highly engaged audiences. Furthermore, evolving consumer preferences are demanding more personalized and immersive ad experiences, stimulating the development of dynamic and interactive ad formats that seamlessly integrate with gameplay. The competitive landscape is characterized by intense rivalry among established industry giants and a wave of innovative startups, fostering a dynamic environment of continuous innovation and market expansion. Significant market penetration is occurring, particularly in rapidly developing economies, driven by the widespread adoption of smartphones and increased internet accessibility. This expansion is further amplified by the increasing sophistication of ad targeting and measurement technologies, enabling more efficient and effective campaigns.
Dominant Regions & Segments in In-Game Advertising Market
The North American region currently holds the dominant position in the in-game advertising market, accounting for xx% of the global market share in 2025. This dominance is driven by:
- Strong gaming industry: A large and established gaming market with high spending on games and in-game purchases.
- High internet penetration & smartphone usage: Widespread access to high-speed internet and smartphones facilitates ad delivery and consumption.
- Advanced technological infrastructure: A well-developed technological infrastructure supports the deployment of advanced ad formats.
- Favorable regulatory environment: Relatively less stringent regulations compared to other regions.
Within the market segmentation by type, dynamic in-game advertising is poised for significant growth, exceeding xx Million in 2025, driven by its capacity for personalized and targeted campaigns. Static ads currently maintain a larger market share, but the dynamic segment is expected to close the gap rapidly. Advergaming, though a smaller segment, shows promising growth potential due to its highly engaging nature and strong user interaction.
In-game Advertising Market Product Innovations
Recent product innovations in in-game advertising focus on enhancing user experience and improving ad effectiveness. This includes the development of reward-based advertising models, non-intrusive ad placements, and personalized advertising based on user behaviour. Technologies such as AI and machine learning are used to optimize ad delivery and targeting, improving ROI for advertisers. The market is also seeing the integration of AR/VR technologies, creating immersive and engaging ad experiences. These innovations address the challenges of maintaining user engagement while generating revenue for game developers.
Report Scope & Segmentation Analysis
This report provides a comprehensive analysis of the in-game advertising market, segmented by ad type, revealing distinct growth trajectories and competitive dynamics within each segment:
Static Ads: This segment encompasses traditional banner ads and static placements within games. While representing a mature market segment, estimated at xx Million in 2025, its growth continues, driven by its simplicity and cost-effectiveness. However, the relatively low barrier to entry results in intense competition, requiring strategic differentiation to succeed.
Dynamic Ads: This rapidly evolving segment features interactive and personalized ads that adapt to the game environment and individual player behavior. Projected to reach xx Million in 2025, it boasts high growth potential due to its superior engagement rates and improved ROI for advertisers. Competition is fierce, focusing on technological advancements and innovative ad formats that enhance the user experience without disrupting gameplay.
Advergaming: This segment represents a more nuanced approach, integrating advertising directly into the gameplay experience. While currently a smaller market segment, projected to reach xx Million by 2025, advergaming demonstrates significant growth potential. Success in this area hinges on the creative design of engaging gameplay mechanics seamlessly integrated with compelling ad narratives that resonate with players, avoiding a disruptive user experience.
Reward-based Video Ads: This increasingly popular format offers players in-game rewards or benefits in exchange for watching short video advertisements. This segment is experiencing robust growth due to its mutually beneficial nature for both players and advertisers.
Playable Ads: This innovative format allows players to interact with a short, playable version of a game or app, providing a more engaging and effective advertising experience compared to traditional static ads. The segment is gaining traction as it effectively bridges the gap between advertising and entertainment.
Key Drivers of In-Game Advertising Market Growth
Several key factors are propelling the growth of the in-game advertising market: The increasing popularity of mobile gaming, the rising number of gamers globally, advancements in ad technology enabling more targeted and interactive campaigns, and the growing acceptance of in-game advertising by gamers seeking free-to-play options. Government initiatives promoting digitalization and technological innovation in various countries are also supporting market growth.
Challenges in the In-Game Advertising Market Sector
The in-game advertising market faces several challenges, including user experience concerns related to intrusive ads, regulatory hurdles regarding data privacy and user consent, and the need to balance revenue generation with player engagement. Furthermore, fraudulent activities and ad-blocking technology pose risks to revenue streams. The increasing competition among ad networks and technology providers also adds to the complexity of the market.
Emerging Opportunities in In-Game Advertising Market
Emerging opportunities abound in the in-game advertising market, driven by the rise of esports, the growing adoption of virtual and augmented reality, and the increasing integration of blockchain technology. The expansion of mobile gaming in developing markets also presents significant growth prospects. Moreover, innovative ad formats that seamlessly blend with gameplay offer compelling opportunities for advertisers and game developers alike.
Leading Players in the In-Game Advertising Market Market
- Blizzard Entertainment Inc
- Electronic Arts Inc
- Google LLC
- Frameplay
- Playwire LLC
- Motive Interactive Inc
- ironSource Ltd
- RapidFire Inc
- Anzu Virtual Reality Ltd
Key Developments in In-Game Advertising Market Industry
- January 2023: Anzu VR launches a new interactive ad format for mobile games.
- March 2022: Google integrates its ad platform with several leading game development engines.
- October 2021: Playwire LLC acquires a smaller ad-tech company, expanding its market reach.
- (Further key developments to be added here based on available data)
Future Outlook for In-Game Advertising Market Market
The future outlook for the in-game advertising market is extremely positive, driven by continued technological innovation, expanding gaming audiences, and the development of more sophisticated ad formats. Strategic partnerships between game developers and ad networks will be crucial for maximizing revenue and maintaining user engagement. The market is expected to witness robust growth in the coming years, driven by factors such as increased adoption of advanced technologies and improved monetization strategies within the gaming industry.
In-game Advertising Market Segmentation
-
1. Type
- 1.1. Static
- 1.2. Dynamic
- 1.3. Advergaming
In-game Advertising Market Segmentation By Geography
- 1. North America
- 2. Europe
- 3. Asia Pacific
- 4. Middle East and Africa
- 5. Latin America
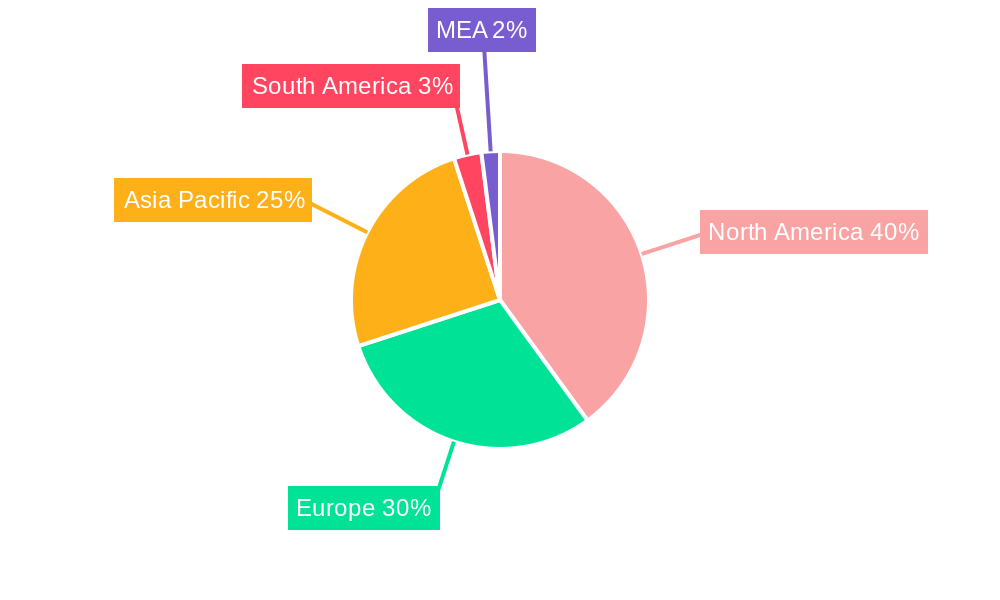
In-game Advertising Market Regional Market Share
Geographic Coverage of In-game Advertising Market
In-game Advertising Market REPORT HIGHLIGHTS
| Aspects | Details |
|---|---|
| Study Period | 2020-2034 |
| Base Year | 2025 |
| Estimated Year | 2026 |
| Forecast Period | 2026-2034 |
| Historical Period | 2020-2025 |
| Growth Rate | CAGR of 11.1% from 2020-2034 |
| Segmentation |
|
Table of Contents
- 1. Introduction
- 1.1. Research Scope
- 1.2. Market Segmentation
- 1.3. Research Methodology
- 1.4. Definitions and Assumptions
- 2. Executive Summary
- 2.1. Introduction
- 3. Market Dynamics
- 3.1. Introduction
- 3.2. Market Drivers
- 3.2.1. Increase in Online Gaming; Growth in the Smartphone Penetration
- 3.3. Market Restrains
- 3.3.1. Incremental Advancements in Smartphones
- 3.4. Market Trends
- 3.4.1. Increase in Online Gaming is Expected to Drive the Market
- 4. Market Factor Analysis
- 4.1. Porters Five Forces
- 4.2. Supply/Value Chain
- 4.3. PESTEL analysis
- 4.4. Market Entropy
- 4.5. Patent/Trademark Analysis
- 5. Global In-game Advertising Market Analysis, Insights and Forecast, 2020-2032
- 5.1. Market Analysis, Insights and Forecast - by Type
- 5.1.1. Static
- 5.1.2. Dynamic
- 5.1.3. Advergaming
- 5.2. Market Analysis, Insights and Forecast - by Region
- 5.2.1. North America
- 5.2.2. Europe
- 5.2.3. Asia Pacific
- 5.2.4. Middle East and Africa
- 5.2.5. Latin America
- 5.1. Market Analysis, Insights and Forecast - by Type
- 6. North America In-game Advertising Market Analysis, Insights and Forecast, 2020-2032
- 6.1. Market Analysis, Insights and Forecast - by Type
- 6.1.1. Static
- 6.1.2. Dynamic
- 6.1.3. Advergaming
- 6.1. Market Analysis, Insights and Forecast - by Type
- 7. Europe In-game Advertising Market Analysis, Insights and Forecast, 2020-2032
- 7.1. Market Analysis, Insights and Forecast - by Type
- 7.1.1. Static
- 7.1.2. Dynamic
- 7.1.3. Advergaming
- 7.1. Market Analysis, Insights and Forecast - by Type
- 8. Asia Pacific In-game Advertising Market Analysis, Insights and Forecast, 2020-2032
- 8.1. Market Analysis, Insights and Forecast - by Type
- 8.1.1. Static
- 8.1.2. Dynamic
- 8.1.3. Advergaming
- 8.1. Market Analysis, Insights and Forecast - by Type
- 9. Middle East and Africa In-game Advertising Market Analysis, Insights and Forecast, 2020-2032
- 9.1. Market Analysis, Insights and Forecast - by Type
- 9.1.1. Static
- 9.1.2. Dynamic
- 9.1.3. Advergaming
- 9.1. Market Analysis, Insights and Forecast - by Type
- 10. Latin America In-game Advertising Market Analysis, Insights and Forecast, 2020-2032
- 10.1. Market Analysis, Insights and Forecast - by Type
- 10.1.1. Static
- 10.1.2. Dynamic
- 10.1.3. Advergaming
- 10.1. Market Analysis, Insights and Forecast - by Type
- 11. Competitive Analysis
- 11.1. Global Market Share Analysis 2025
- 11.2. Company Profiles
- 11.2.1 Blizzard Entertainment Inc
- 11.2.1.1. Overview
- 11.2.1.2. Products
- 11.2.1.3. SWOT Analysis
- 11.2.1.4. Recent Developments
- 11.2.1.5. Financials (Based on Availability)
- 11.2.2 Electronic Arts Inc
- 11.2.2.1. Overview
- 11.2.2.2. Products
- 11.2.2.3. SWOT Analysis
- 11.2.2.4. Recent Developments
- 11.2.2.5. Financials (Based on Availability)
- 11.2.3 Google LLC
- 11.2.3.1. Overview
- 11.2.3.2. Products
- 11.2.3.3. SWOT Analysis
- 11.2.3.4. Recent Developments
- 11.2.3.5. Financials (Based on Availability)
- 11.2.4 Frameplay
- 11.2.4.1. Overview
- 11.2.4.2. Products
- 11.2.4.3. SWOT Analysis
- 11.2.4.4. Recent Developments
- 11.2.4.5. Financials (Based on Availability)
- 11.2.5 Playwire LLC
- 11.2.5.1. Overview
- 11.2.5.2. Products
- 11.2.5.3. SWOT Analysis
- 11.2.5.4. Recent Developments
- 11.2.5.5. Financials (Based on Availability)
- 11.2.6 Motive Interactive Inc
- 11.2.6.1. Overview
- 11.2.6.2. Products
- 11.2.6.3. SWOT Analysis
- 11.2.6.4. Recent Developments
- 11.2.6.5. Financials (Based on Availability)
- 11.2.7 ironSource Ltd
- 11.2.7.1. Overview
- 11.2.7.2. Products
- 11.2.7.3. SWOT Analysis
- 11.2.7.4. Recent Developments
- 11.2.7.5. Financials (Based on Availability)
- 11.2.8 RapidFire Inc
- 11.2.8.1. Overview
- 11.2.8.2. Products
- 11.2.8.3. SWOT Analysis
- 11.2.8.4. Recent Developments
- 11.2.8.5. Financials (Based on Availability)
- 11.2.9 Anzu Virtual Reality Ltd
- 11.2.9.1. Overview
- 11.2.9.2. Products
- 11.2.9.3. SWOT Analysis
- 11.2.9.4. Recent Developments
- 11.2.9.5. Financials (Based on Availability)
- 11.2.1 Blizzard Entertainment Inc
List of Figures
- Figure 1: Global In-game Advertising Market Revenue Breakdown (billion, %) by Region 2025 & 2033
- Figure 2: North America In-game Advertising Market Revenue (billion), by Type 2025 & 2033
- Figure 3: North America In-game Advertising Market Revenue Share (%), by Type 2025 & 2033
- Figure 4: North America In-game Advertising Market Revenue (billion), by Country 2025 & 2033
- Figure 5: North America In-game Advertising Market Revenue Share (%), by Country 2025 & 2033
- Figure 6: Europe In-game Advertising Market Revenue (billion), by Type 2025 & 2033
- Figure 7: Europe In-game Advertising Market Revenue Share (%), by Type 2025 & 2033
- Figure 8: Europe In-game Advertising Market Revenue (billion), by Country 2025 & 2033
- Figure 9: Europe In-game Advertising Market Revenue Share (%), by Country 2025 & 2033
- Figure 10: Asia Pacific In-game Advertising Market Revenue (billion), by Type 2025 & 2033
- Figure 11: Asia Pacific In-game Advertising Market Revenue Share (%), by Type 2025 & 2033
- Figure 12: Asia Pacific In-game Advertising Market Revenue (billion), by Country 2025 & 2033
- Figure 13: Asia Pacific In-game Advertising Market Revenue Share (%), by Country 2025 & 2033
- Figure 14: Middle East and Africa In-game Advertising Market Revenue (billion), by Type 2025 & 2033
- Figure 15: Middle East and Africa In-game Advertising Market Revenue Share (%), by Type 2025 & 2033
- Figure 16: Middle East and Africa In-game Advertising Market Revenue (billion), by Country 2025 & 2033
- Figure 17: Middle East and Africa In-game Advertising Market Revenue Share (%), by Country 2025 & 2033
- Figure 18: Latin America In-game Advertising Market Revenue (billion), by Type 2025 & 2033
- Figure 19: Latin America In-game Advertising Market Revenue Share (%), by Type 2025 & 2033
- Figure 20: Latin America In-game Advertising Market Revenue (billion), by Country 2025 & 2033
- Figure 21: Latin America In-game Advertising Market Revenue Share (%), by Country 2025 & 2033
List of Tables
- Table 1: Global In-game Advertising Market Revenue billion Forecast, by Type 2020 & 2033
- Table 2: Global In-game Advertising Market Revenue billion Forecast, by Region 2020 & 2033
- Table 3: Global In-game Advertising Market Revenue billion Forecast, by Type 2020 & 2033
- Table 4: Global In-game Advertising Market Revenue billion Forecast, by Country 2020 & 2033
- Table 5: Global In-game Advertising Market Revenue billion Forecast, by Type 2020 & 2033
- Table 6: Global In-game Advertising Market Revenue billion Forecast, by Country 2020 & 2033
- Table 7: Global In-game Advertising Market Revenue billion Forecast, by Type 2020 & 2033
- Table 8: Global In-game Advertising Market Revenue billion Forecast, by Country 2020 & 2033
- Table 9: Global In-game Advertising Market Revenue billion Forecast, by Type 2020 & 2033
- Table 10: Global In-game Advertising Market Revenue billion Forecast, by Country 2020 & 2033
- Table 11: Global In-game Advertising Market Revenue billion Forecast, by Type 2020 & 2033
- Table 12: Global In-game Advertising Market Revenue billion Forecast, by Country 2020 & 2033
Frequently Asked Questions
1. What is the projected Compound Annual Growth Rate (CAGR) of the In-game Advertising Market?
The projected CAGR is approximately 11.1%.
2. Which companies are prominent players in the In-game Advertising Market?
Key companies in the market include Blizzard Entertainment Inc, Electronic Arts Inc, Google LLC, Frameplay, Playwire LLC, Motive Interactive Inc, ironSource Ltd, RapidFire Inc, Anzu Virtual Reality Ltd.
3. What are the main segments of the In-game Advertising Market?
The market segments include Type.
4. Can you provide details about the market size?
The market size is estimated to be USD 60.6 billion as of 2022.
5. What are some drivers contributing to market growth?
Increase in Online Gaming; Growth in the Smartphone Penetration.
6. What are the notable trends driving market growth?
Increase in Online Gaming is Expected to Drive the Market.
7. Are there any restraints impacting market growth?
Incremental Advancements in Smartphones.
8. Can you provide examples of recent developments in the market?
N/A
9. What pricing options are available for accessing the report?
Pricing options include single-user, multi-user, and enterprise licenses priced at USD 4750, USD 5250, and USD 8750 respectively.
10. Is the market size provided in terms of value or volume?
The market size is provided in terms of value, measured in billion.
11. Are there any specific market keywords associated with the report?
Yes, the market keyword associated with the report is "In-game Advertising Market," which aids in identifying and referencing the specific market segment covered.
12. How do I determine which pricing option suits my needs best?
The pricing options vary based on user requirements and access needs. Individual users may opt for single-user licenses, while businesses requiring broader access may choose multi-user or enterprise licenses for cost-effective access to the report.
13. Are there any additional resources or data provided in the In-game Advertising Market report?
While the report offers comprehensive insights, it's advisable to review the specific contents or supplementary materials provided to ascertain if additional resources or data are available.
14. How can I stay updated on further developments or reports in the In-game Advertising Market?
To stay informed about further developments, trends, and reports in the In-game Advertising Market, consider subscribing to industry newsletters, following relevant companies and organizations, or regularly checking reputable industry news sources and publications.
Methodology
Step 1 - Identification of Relevant Samples Size from Population Database


Step 2 - Approaches for Defining Global Market Size (Value, Volume* & Price*)

Note*: In applicable scenarios
Step 3 - Data Sources
Primary Research
- Web Analytics
- Survey Reports
- Research Institute
- Latest Research Reports
- Opinion Leaders
Secondary Research
- Annual Reports
- White Paper
- Latest Press Release
- Industry Association
- Paid Database
- Investor Presentations

Step 4 - Data Triangulation
Involves using different sources of information in order to increase the validity of a study
These sources are likely to be stakeholders in a program - participants, other researchers, program staff, other community members, and so on.
Then we put all data in single framework & apply various statistical tools to find out the dynamic on the market.
During the analysis stage, feedback from the stakeholder groups would be compared to determine areas of agreement as well as areas of divergence

