
Key Insights
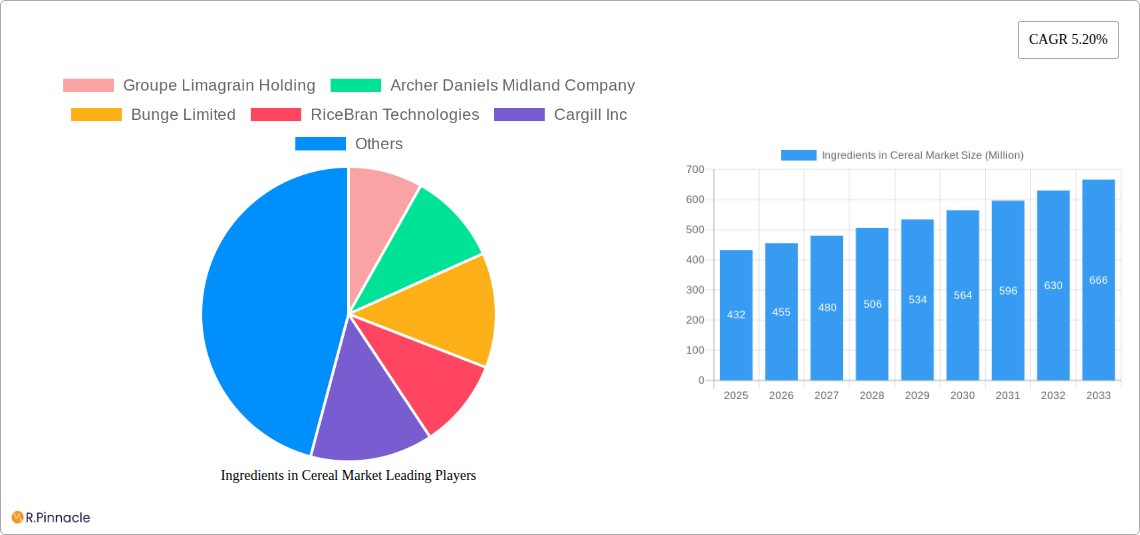
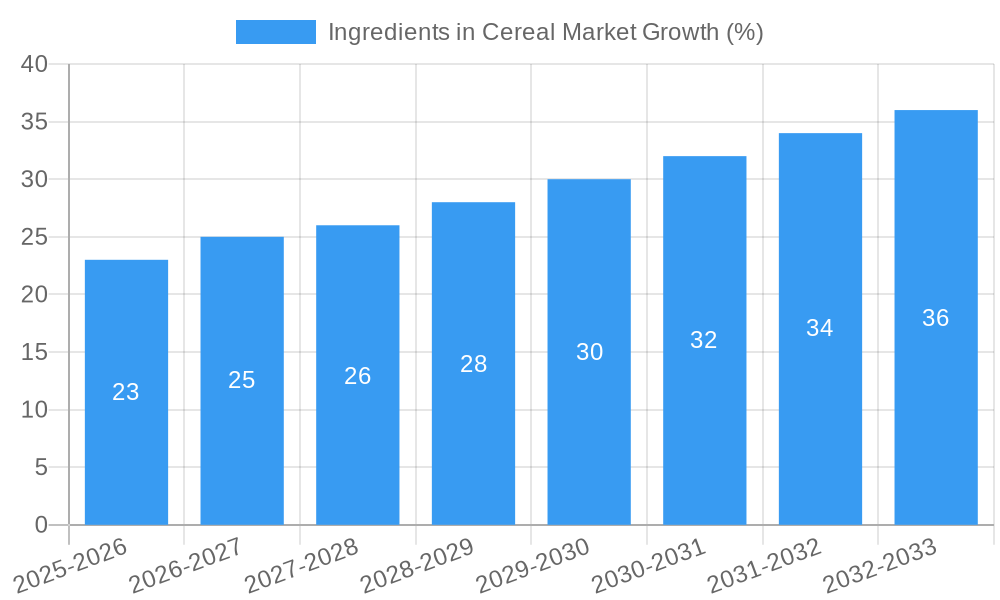
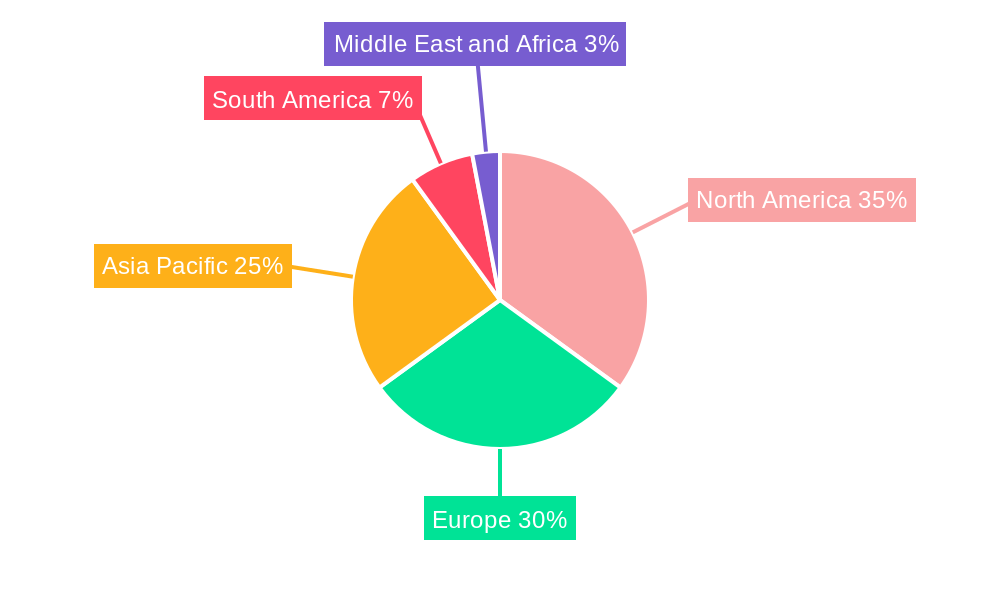
The global ingredients in cereal market, valued at $432 million in 2025, is projected to experience robust growth, driven by increasing consumer demand for breakfast cereals and expanding applications across food and beverage, animal feed, and biofuel sectors. The market's Compound Annual Growth Rate (CAGR) of 5.20% from 2025 to 2033 indicates a substantial expansion, fueled by several key factors. Health and wellness trends are pushing demand for cereals fortified with nutritious ingredients like oats and whole grains, while innovation in product formats—such as puffed, grit, and flake cereals—continues to cater to diverse consumer preferences. The burgeoning food and beverage industry, particularly in developing economies, is a significant driver, as cereals are versatile ingredients in numerous processed food products. Furthermore, the growing animal feed industry's reliance on cereal by-products as cost-effective feedstock contributes to market expansion. However, fluctuations in raw material prices, particularly grains like wheat and barley, could present challenges to sustained growth. Competition among established players and the emergence of new entrants are also expected to shape market dynamics. Regional variations are also notable; North America and Europe are currently major markets, but Asia Pacific is anticipated to witness significant growth driven by rising disposable incomes and changing dietary habits.
Geographical distribution reveals a significant concentration of market share within established regions, yet considerable growth potential exists in emerging markets. Regional differences in consumer preferences, regulatory frameworks, and economic conditions will influence future market share dynamics. The segmentation by form (puff, grit, flake), application (food and beverage, animal feed, biofuel), and ingredient type (wheat, barley, rice, oats) provides a granular view of the market, allowing for targeted strategies and insightful competitive analyses. Companies like Groupe Limagrain Holding, Archer Daniels Midland Company, and Cargill Inc. are major players, vying for market share through product innovation, strategic partnerships, and expansion into new geographical markets. Future market growth will likely be shaped by the continued interplay of consumer trends, technological advancements, and competitive dynamics within the global food industry.
Ingredients in Cereal Market: A Comprehensive Report (2019-2033)
This comprehensive report provides a detailed analysis of the Ingredients in Cereal Market, offering invaluable insights for industry professionals, investors, and strategic decision-makers. With a study period spanning 2019-2033, a base year of 2025, and a forecast period of 2025-2033, this report leverages rigorous data analysis and expert insights to illuminate current market dynamics and future growth trajectories. The report examines market size (in Millions of USD), growth drivers, challenges, and emerging opportunities, delivering actionable intelligence to navigate the complexities of this dynamic market.
Ingredients in Cereal Market Market Structure & Innovation Trends
This section delves into the competitive landscape of the Ingredients in Cereal Market, analyzing market concentration, innovation drivers, regulatory frameworks, product substitutes, end-user demographics, and M&A activities. We examine the market share held by key players such as Groupe Limagrain Holding, Archer Daniels Midland Company, Bunge Limited, RiceBran Technologies, Cargill Inc, Associated British Foods PLC, Kellogg's, General Mills, SunOpta Inc, and CII Foods (list not exhaustive). The analysis includes an assessment of recent mergers and acquisitions (M&A) within the industry, providing insights into deal values and their impact on market consolidation. The report also explores the influence of regulatory frameworks and technological innovations on market structure, examining the impact on innovation, competition, and product development. Specific metrics like market share percentages and M&A deal values (in Millions of USD) will be presented to quantify market structure and dynamism. The section further explores the evolving end-user demographics and their influence on product demand and market segmentation.
Ingredients in Cereal Market Market Dynamics & Trends
This section provides a detailed examination of the factors driving market growth, including technological advancements, evolving consumer preferences, and competitive dynamics. The report analyzes market growth drivers and explores how technological disruptions are shaping the industry landscape. We examine consumer trends, such as increasing demand for healthier and more sustainable cereal products, and analyze their impact on market segmentation and product innovation. Detailed analysis of competitive dynamics, including pricing strategies, market share battles, and the rise of new entrants, will be presented. Key performance indicators such as the Compound Annual Growth Rate (CAGR) and market penetration rates will be provided to quantify market dynamics and trends. This section offers a comprehensive overview of the market's trajectory and the key factors influencing its evolution.
Dominant Regions & Segments in Ingredients in Cereal Market
This section identifies the leading regions, countries, and segments within the Ingredients in Cereal Market across Form (Puff, Grit, Flake), Application (Food and Beverage, Brewing, Animal Feed, Biofuel, Other Applications), and Ingredient Type (Wheat, Barley, Rice, Oats, Other Ingredient Types). A detailed analysis of the market dominance will be provided, along with key drivers for each segment and region.
- Key Drivers (Examples):
- Favorable economic policies promoting agricultural production.
- Robust infrastructure supporting efficient transportation and distribution networks.
- Growing consumer demand in specific regions or segments.
- Government regulations and incentives.
The analysis will explain the reasons behind the dominance of specific regions and segments, providing a deep understanding of market geography and product preferences.
Ingredients in Cereal Market Product Innovations
This section provides a concise overview of recent product developments, highlighting key innovations and their competitive advantages. We will analyze technological trends shaping the market and evaluate the market fit of these new products, emphasizing factors such as consumer acceptance, cost-effectiveness, and sustainability.
Report Scope & Segmentation Analysis
This section details the market segmentation by Form (Puff, Grit, Flake), Application (Food and Beverage, Brewing, Animal Feed, Biofuel, Other Applications), and Ingredient Type (Wheat, Barley, Rice, Oats, Other Ingredient Types). Each segment will be analyzed individually, including growth projections, market size (in Millions of USD), and competitive dynamics. This in-depth analysis provides a clear understanding of the specific opportunities and challenges presented by each market segment.
Key Drivers of Ingredients in Cereal Market Growth
This section identifies the key factors driving market growth, including technological advancements, economic factors, and regulatory changes. Specific examples will be used to illustrate the influence of these factors on market expansion. This includes analyzing the impact of new processing technologies, shifting consumer preferences, and evolving regulatory landscapes on market growth.
Challenges in the Ingredients in Cereal Market Sector
This section outlines the key challenges impacting the Ingredients in Cereal Market. This includes an examination of regulatory hurdles, supply chain disruptions, and intense competitive pressures, quantifying their impact on market growth and profitability. This analysis will shed light on the hurdles faced by companies in this sector.
Emerging Opportunities in Ingredients in Cereal Market
This section highlights emerging opportunities within the Ingredients in Cereal Market, identifying potential new markets, technological innovations, and shifts in consumer preferences that could lead to substantial market growth. This section will offer valuable insight into future market expansion and potential investment avenues.
Leading Players in the Ingredients in Cereal Market Market
- Groupe Limagrain Holding
- Archer Daniels Midland Company (ADM)
- Bunge Limited (Bunge)
- RiceBran Technologies
- Cargill Inc (Cargill)
- Associated British Foods PLC (ABF)
- Kellogg's (Kellogg's)
- General Mills (General Mills)
- SunOpta Inc
- CII Foods
*List Not Exhaustive
Key Developments in Ingredients in Cereal Market Industry
- June 2021: General Mills invested USD 28 Million to expand its cereal production plant in Ohio.
- May 2021: Kellogg's invested approximately USD 121 Million to expand its Pringles production facility in Poland, increasing capacity by 34% to 60,000 tons annually.
- October 2020: Limagrain Ingredients opened a new production line in France (USD 9 Million investment), increasing production of functional cereal flours and products to 15,000 tons (45,000 tons total annual capacity).
Future Outlook for Ingredients in Cereal Market Market
This section summarizes the key growth accelerators for the Ingredients in Cereal Market, focusing on future market potential and strategic opportunities. The outlook will analyze the anticipated market trends and highlight areas with the greatest growth potential, providing a forward-looking perspective on market evolution and investment opportunities. This section provides an overall assessment of the market's future trajectory.
Ingredients in Cereal Market Segmentation
-
1. Ingredient Type
- 1.1. Wheat
- 1.2. Barley
- 1.3. Rice
- 1.4. Oats
- 1.5. Other Ingredient Types
-
2. Form
- 2.1. Puff
- 2.2. Grit
- 2.3. Flake
-
3. Application
-
3.1. Food and Beverage
- 3.1.1. Breakfast Cereals
- 3.1.2. Baked products
- 3.1.3. Brewing
- 3.2. Animal Feed
- 3.3. Biofuel
- 3.4. Other Applications
-
3.1. Food and Beverage
Ingredients in Cereal Market Segmentation By Geography
-
1. North America
- 1.1. United States
- 1.2. Canada
- 1.3. Mexico
- 1.4. Rest of North America
-
2. Europe
- 2.1. Spain
- 2.2. United Kingdom
- 2.3. Germany
- 2.4. France
- 2.5. Italy
- 2.6. Russia
- 2.7. Rest of Europe
-
3. Asia Pacific
- 3.1. China
- 3.2. Japan
- 3.3. India
- 3.4. Australia
- 3.5. Rest of Asia Pacific
-
4. South America
- 4.1. Brazil
- 4.2. Argentina
- 4.3. Rest of South America
-
5. Middle East and Africa
- 5.1. South Africa
- 5.2. United Arab Emirates
- 5.3. Rest of Middle East and Africa
Ingredients in Cereal Market REPORT HIGHLIGHTS
| Aspects | Details |
|---|---|
| Study Period | 2019-2033 |
| Base Year | 2024 |
| Estimated Year | 2025 |
| Forecast Period | 2025-2033 |
| Historical Period | 2019-2024 |
| Growth Rate | CAGR of 5.20% from 2019-2033 |
| Segmentation |
|
Table of Contents
- 1. Introduction
- 1.1. Research Scope
- 1.2. Market Segmentation
- 1.3. Research Methodology
- 1.4. Definitions and Assumptions
- 2. Executive Summary
- 2.1. Introduction
- 3. Market Dynamics
- 3.1. Introduction
- 3.2. Market Drivers
- 3.2.1. Growing Health and Fitness Consciousness Among Japanese; Increasing Demand for Meat Analogues
- 3.3. Market Restrains
- 3.3.1. Higher Production Costs and Limited Capacities
- 3.4. Market Trends
- 3.4.1. Increase in Demand for Products with Health Benefits
- 4. Market Factor Analysis
- 4.1. Porters Five Forces
- 4.2. Supply/Value Chain
- 4.3. PESTEL analysis
- 4.4. Market Entropy
- 4.5. Patent/Trademark Analysis
- 5. Global Ingredients in Cereal Market Analysis, Insights and Forecast, 2019-2031
- 5.1. Market Analysis, Insights and Forecast - by Ingredient Type
- 5.1.1. Wheat
- 5.1.2. Barley
- 5.1.3. Rice
- 5.1.4. Oats
- 5.1.5. Other Ingredient Types
- 5.2. Market Analysis, Insights and Forecast - by Form
- 5.2.1. Puff
- 5.2.2. Grit
- 5.2.3. Flake
- 5.3. Market Analysis, Insights and Forecast - by Application
- 5.3.1. Food and Beverage
- 5.3.1.1. Breakfast Cereals
- 5.3.1.2. Baked products
- 5.3.1.3. Brewing
- 5.3.2. Animal Feed
- 5.3.3. Biofuel
- 5.3.4. Other Applications
- 5.3.1. Food and Beverage
- 5.4. Market Analysis, Insights and Forecast - by Region
- 5.4.1. North America
- 5.4.2. Europe
- 5.4.3. Asia Pacific
- 5.4.4. South America
- 5.4.5. Middle East and Africa
- 5.1. Market Analysis, Insights and Forecast - by Ingredient Type
- 6. North America Ingredients in Cereal Market Analysis, Insights and Forecast, 2019-2031
- 6.1. Market Analysis, Insights and Forecast - by Ingredient Type
- 6.1.1. Wheat
- 6.1.2. Barley
- 6.1.3. Rice
- 6.1.4. Oats
- 6.1.5. Other Ingredient Types
- 6.2. Market Analysis, Insights and Forecast - by Form
- 6.2.1. Puff
- 6.2.2. Grit
- 6.2.3. Flake
- 6.3. Market Analysis, Insights and Forecast - by Application
- 6.3.1. Food and Beverage
- 6.3.1.1. Breakfast Cereals
- 6.3.1.2. Baked products
- 6.3.1.3. Brewing
- 6.3.2. Animal Feed
- 6.3.3. Biofuel
- 6.3.4. Other Applications
- 6.3.1. Food and Beverage
- 6.1. Market Analysis, Insights and Forecast - by Ingredient Type
- 7. Europe Ingredients in Cereal Market Analysis, Insights and Forecast, 2019-2031
- 7.1. Market Analysis, Insights and Forecast - by Ingredient Type
- 7.1.1. Wheat
- 7.1.2. Barley
- 7.1.3. Rice
- 7.1.4. Oats
- 7.1.5. Other Ingredient Types
- 7.2. Market Analysis, Insights and Forecast - by Form
- 7.2.1. Puff
- 7.2.2. Grit
- 7.2.3. Flake
- 7.3. Market Analysis, Insights and Forecast - by Application
- 7.3.1. Food and Beverage
- 7.3.1.1. Breakfast Cereals
- 7.3.1.2. Baked products
- 7.3.1.3. Brewing
- 7.3.2. Animal Feed
- 7.3.3. Biofuel
- 7.3.4. Other Applications
- 7.3.1. Food and Beverage
- 7.1. Market Analysis, Insights and Forecast - by Ingredient Type
- 8. Asia Pacific Ingredients in Cereal Market Analysis, Insights and Forecast, 2019-2031
- 8.1. Market Analysis, Insights and Forecast - by Ingredient Type
- 8.1.1. Wheat
- 8.1.2. Barley
- 8.1.3. Rice
- 8.1.4. Oats
- 8.1.5. Other Ingredient Types
- 8.2. Market Analysis, Insights and Forecast - by Form
- 8.2.1. Puff
- 8.2.2. Grit
- 8.2.3. Flake
- 8.3. Market Analysis, Insights and Forecast - by Application
- 8.3.1. Food and Beverage
- 8.3.1.1. Breakfast Cereals
- 8.3.1.2. Baked products
- 8.3.1.3. Brewing
- 8.3.2. Animal Feed
- 8.3.3. Biofuel
- 8.3.4. Other Applications
- 8.3.1. Food and Beverage
- 8.1. Market Analysis, Insights and Forecast - by Ingredient Type
- 9. South America Ingredients in Cereal Market Analysis, Insights and Forecast, 2019-2031
- 9.1. Market Analysis, Insights and Forecast - by Ingredient Type
- 9.1.1. Wheat
- 9.1.2. Barley
- 9.1.3. Rice
- 9.1.4. Oats
- 9.1.5. Other Ingredient Types
- 9.2. Market Analysis, Insights and Forecast - by Form
- 9.2.1. Puff
- 9.2.2. Grit
- 9.2.3. Flake
- 9.3. Market Analysis, Insights and Forecast - by Application
- 9.3.1. Food and Beverage
- 9.3.1.1. Breakfast Cereals
- 9.3.1.2. Baked products
- 9.3.1.3. Brewing
- 9.3.2. Animal Feed
- 9.3.3. Biofuel
- 9.3.4. Other Applications
- 9.3.1. Food and Beverage
- 9.1. Market Analysis, Insights and Forecast - by Ingredient Type
- 10. Middle East and Africa Ingredients in Cereal Market Analysis, Insights and Forecast, 2019-2031
- 10.1. Market Analysis, Insights and Forecast - by Ingredient Type
- 10.1.1. Wheat
- 10.1.2. Barley
- 10.1.3. Rice
- 10.1.4. Oats
- 10.1.5. Other Ingredient Types
- 10.2. Market Analysis, Insights and Forecast - by Form
- 10.2.1. Puff
- 10.2.2. Grit
- 10.2.3. Flake
- 10.3. Market Analysis, Insights and Forecast - by Application
- 10.3.1. Food and Beverage
- 10.3.1.1. Breakfast Cereals
- 10.3.1.2. Baked products
- 10.3.1.3. Brewing
- 10.3.2. Animal Feed
- 10.3.3. Biofuel
- 10.3.4. Other Applications
- 10.3.1. Food and Beverage
- 10.1. Market Analysis, Insights and Forecast - by Ingredient Type
- 11. North America Ingredients in Cereal Market Analysis, Insights and Forecast, 2019-2031
- 11.1. Market Analysis, Insights and Forecast - By Country/Sub-region
- 11.1.1 United States
- 11.1.2 Canada
- 11.1.3 Mexico
- 11.1.4 Rest of North America
- 12. Europe Ingredients in Cereal Market Analysis, Insights and Forecast, 2019-2031
- 12.1. Market Analysis, Insights and Forecast - By Country/Sub-region
- 12.1.1 Spain
- 12.1.2 United Kingdom
- 12.1.3 Germany
- 12.1.4 France
- 12.1.5 Italy
- 12.1.6 Russia
- 12.1.7 Rest of Europe
- 13. Asia Pacific Ingredients in Cereal Market Analysis, Insights and Forecast, 2019-2031
- 13.1. Market Analysis, Insights and Forecast - By Country/Sub-region
- 13.1.1 China
- 13.1.2 Japan
- 13.1.3 India
- 13.1.4 Australia
- 13.1.5 Rest of Asia Pacific
- 14. South America Ingredients in Cereal Market Analysis, Insights and Forecast, 2019-2031
- 14.1. Market Analysis, Insights and Forecast - By Country/Sub-region
- 14.1.1 Brazil
- 14.1.2 Argentina
- 14.1.3 Rest of South America
- 15. Middle East and Africa Ingredients in Cereal Market Analysis, Insights and Forecast, 2019-2031
- 15.1. Market Analysis, Insights and Forecast - By Country/Sub-region
- 15.1.1 South Africa
- 15.1.2 United Arab Emirates
- 15.1.3 Rest of Middle East and Africa
- 16. Competitive Analysis
- 16.1. Global Market Share Analysis 2024
- 16.2. Company Profiles
- 16.2.1 Groupe Limagrain Holding
- 16.2.1.1. Overview
- 16.2.1.2. Products
- 16.2.1.3. SWOT Analysis
- 16.2.1.4. Recent Developments
- 16.2.1.5. Financials (Based on Availability)
- 16.2.2 Archer Daniels Midland Company
- 16.2.2.1. Overview
- 16.2.2.2. Products
- 16.2.2.3. SWOT Analysis
- 16.2.2.4. Recent Developments
- 16.2.2.5. Financials (Based on Availability)
- 16.2.3 Bunge Limited
- 16.2.3.1. Overview
- 16.2.3.2. Products
- 16.2.3.3. SWOT Analysis
- 16.2.3.4. Recent Developments
- 16.2.3.5. Financials (Based on Availability)
- 16.2.4 RiceBran Technologies
- 16.2.4.1. Overview
- 16.2.4.2. Products
- 16.2.4.3. SWOT Analysis
- 16.2.4.4. Recent Developments
- 16.2.4.5. Financials (Based on Availability)
- 16.2.5 Cargill Inc
- 16.2.5.1. Overview
- 16.2.5.2. Products
- 16.2.5.3. SWOT Analysis
- 16.2.5.4. Recent Developments
- 16.2.5.5. Financials (Based on Availability)
- 16.2.6 Associated British Foods PLC
- 16.2.6.1. Overview
- 16.2.6.2. Products
- 16.2.6.3. SWOT Analysis
- 16.2.6.4. Recent Developments
- 16.2.6.5. Financials (Based on Availability)
- 16.2.7 Kellogg's
- 16.2.7.1. Overview
- 16.2.7.2. Products
- 16.2.7.3. SWOT Analysis
- 16.2.7.4. Recent Developments
- 16.2.7.5. Financials (Based on Availability)
- 16.2.8 General Mills *List Not Exhaustive
- 16.2.8.1. Overview
- 16.2.8.2. Products
- 16.2.8.3. SWOT Analysis
- 16.2.8.4. Recent Developments
- 16.2.8.5. Financials (Based on Availability)
- 16.2.9 SunOpta Inc
- 16.2.9.1. Overview
- 16.2.9.2. Products
- 16.2.9.3. SWOT Analysis
- 16.2.9.4. Recent Developments
- 16.2.9.5. Financials (Based on Availability)
- 16.2.10 CII Foods
- 16.2.10.1. Overview
- 16.2.10.2. Products
- 16.2.10.3. SWOT Analysis
- 16.2.10.4. Recent Developments
- 16.2.10.5. Financials (Based on Availability)
- 16.2.1 Groupe Limagrain Holding
List of Figures
- Figure 1: Global Ingredients in Cereal Market Revenue Breakdown (Million, %) by Region 2024 & 2032
- Figure 2: Global Ingredients in Cereal Market Volume Breakdown (K Tons, %) by Region 2024 & 2032
- Figure 3: North America Ingredients in Cereal Market Revenue (Million), by Country 2024 & 2032
- Figure 4: North America Ingredients in Cereal Market Volume (K Tons), by Country 2024 & 2032
- Figure 5: North America Ingredients in Cereal Market Revenue Share (%), by Country 2024 & 2032
- Figure 6: North America Ingredients in Cereal Market Volume Share (%), by Country 2024 & 2032
- Figure 7: Europe Ingredients in Cereal Market Revenue (Million), by Country 2024 & 2032
- Figure 8: Europe Ingredients in Cereal Market Volume (K Tons), by Country 2024 & 2032
- Figure 9: Europe Ingredients in Cereal Market Revenue Share (%), by Country 2024 & 2032
- Figure 10: Europe Ingredients in Cereal Market Volume Share (%), by Country 2024 & 2032
- Figure 11: Asia Pacific Ingredients in Cereal Market Revenue (Million), by Country 2024 & 2032
- Figure 12: Asia Pacific Ingredients in Cereal Market Volume (K Tons), by Country 2024 & 2032
- Figure 13: Asia Pacific Ingredients in Cereal Market Revenue Share (%), by Country 2024 & 2032
- Figure 14: Asia Pacific Ingredients in Cereal Market Volume Share (%), by Country 2024 & 2032
- Figure 15: South America Ingredients in Cereal Market Revenue (Million), by Country 2024 & 2032
- Figure 16: South America Ingredients in Cereal Market Volume (K Tons), by Country 2024 & 2032
- Figure 17: South America Ingredients in Cereal Market Revenue Share (%), by Country 2024 & 2032
- Figure 18: South America Ingredients in Cereal Market Volume Share (%), by Country 2024 & 2032
- Figure 19: Middle East and Africa Ingredients in Cereal Market Revenue (Million), by Country 2024 & 2032
- Figure 20: Middle East and Africa Ingredients in Cereal Market Volume (K Tons), by Country 2024 & 2032
- Figure 21: Middle East and Africa Ingredients in Cereal Market Revenue Share (%), by Country 2024 & 2032
- Figure 22: Middle East and Africa Ingredients in Cereal Market Volume Share (%), by Country 2024 & 2032
- Figure 23: North America Ingredients in Cereal Market Revenue (Million), by Ingredient Type 2024 & 2032
- Figure 24: North America Ingredients in Cereal Market Volume (K Tons), by Ingredient Type 2024 & 2032
- Figure 25: North America Ingredients in Cereal Market Revenue Share (%), by Ingredient Type 2024 & 2032
- Figure 26: North America Ingredients in Cereal Market Volume Share (%), by Ingredient Type 2024 & 2032
- Figure 27: North America Ingredients in Cereal Market Revenue (Million), by Form 2024 & 2032
- Figure 28: North America Ingredients in Cereal Market Volume (K Tons), by Form 2024 & 2032
- Figure 29: North America Ingredients in Cereal Market Revenue Share (%), by Form 2024 & 2032
- Figure 30: North America Ingredients in Cereal Market Volume Share (%), by Form 2024 & 2032
- Figure 31: North America Ingredients in Cereal Market Revenue (Million), by Application 2024 & 2032
- Figure 32: North America Ingredients in Cereal Market Volume (K Tons), by Application 2024 & 2032
- Figure 33: North America Ingredients in Cereal Market Revenue Share (%), by Application 2024 & 2032
- Figure 34: North America Ingredients in Cereal Market Volume Share (%), by Application 2024 & 2032
- Figure 35: North America Ingredients in Cereal Market Revenue (Million), by Country 2024 & 2032
- Figure 36: North America Ingredients in Cereal Market Volume (K Tons), by Country 2024 & 2032
- Figure 37: North America Ingredients in Cereal Market Revenue Share (%), by Country 2024 & 2032
- Figure 38: North America Ingredients in Cereal Market Volume Share (%), by Country 2024 & 2032
- Figure 39: Europe Ingredients in Cereal Market Revenue (Million), by Ingredient Type 2024 & 2032
- Figure 40: Europe Ingredients in Cereal Market Volume (K Tons), by Ingredient Type 2024 & 2032
- Figure 41: Europe Ingredients in Cereal Market Revenue Share (%), by Ingredient Type 2024 & 2032
- Figure 42: Europe Ingredients in Cereal Market Volume Share (%), by Ingredient Type 2024 & 2032
- Figure 43: Europe Ingredients in Cereal Market Revenue (Million), by Form 2024 & 2032
- Figure 44: Europe Ingredients in Cereal Market Volume (K Tons), by Form 2024 & 2032
- Figure 45: Europe Ingredients in Cereal Market Revenue Share (%), by Form 2024 & 2032
- Figure 46: Europe Ingredients in Cereal Market Volume Share (%), by Form 2024 & 2032
- Figure 47: Europe Ingredients in Cereal Market Revenue (Million), by Application 2024 & 2032
- Figure 48: Europe Ingredients in Cereal Market Volume (K Tons), by Application 2024 & 2032
- Figure 49: Europe Ingredients in Cereal Market Revenue Share (%), by Application 2024 & 2032
- Figure 50: Europe Ingredients in Cereal Market Volume Share (%), by Application 2024 & 2032
- Figure 51: Europe Ingredients in Cereal Market Revenue (Million), by Country 2024 & 2032
- Figure 52: Europe Ingredients in Cereal Market Volume (K Tons), by Country 2024 & 2032
- Figure 53: Europe Ingredients in Cereal Market Revenue Share (%), by Country 2024 & 2032
- Figure 54: Europe Ingredients in Cereal Market Volume Share (%), by Country 2024 & 2032
- Figure 55: Asia Pacific Ingredients in Cereal Market Revenue (Million), by Ingredient Type 2024 & 2032
- Figure 56: Asia Pacific Ingredients in Cereal Market Volume (K Tons), by Ingredient Type 2024 & 2032
- Figure 57: Asia Pacific Ingredients in Cereal Market Revenue Share (%), by Ingredient Type 2024 & 2032
- Figure 58: Asia Pacific Ingredients in Cereal Market Volume Share (%), by Ingredient Type 2024 & 2032
- Figure 59: Asia Pacific Ingredients in Cereal Market Revenue (Million), by Form 2024 & 2032
- Figure 60: Asia Pacific Ingredients in Cereal Market Volume (K Tons), by Form 2024 & 2032
- Figure 61: Asia Pacific Ingredients in Cereal Market Revenue Share (%), by Form 2024 & 2032
- Figure 62: Asia Pacific Ingredients in Cereal Market Volume Share (%), by Form 2024 & 2032
- Figure 63: Asia Pacific Ingredients in Cereal Market Revenue (Million), by Application 2024 & 2032
- Figure 64: Asia Pacific Ingredients in Cereal Market Volume (K Tons), by Application 2024 & 2032
- Figure 65: Asia Pacific Ingredients in Cereal Market Revenue Share (%), by Application 2024 & 2032
- Figure 66: Asia Pacific Ingredients in Cereal Market Volume Share (%), by Application 2024 & 2032
- Figure 67: Asia Pacific Ingredients in Cereal Market Revenue (Million), by Country 2024 & 2032
- Figure 68: Asia Pacific Ingredients in Cereal Market Volume (K Tons), by Country 2024 & 2032
- Figure 69: Asia Pacific Ingredients in Cereal Market Revenue Share (%), by Country 2024 & 2032
- Figure 70: Asia Pacific Ingredients in Cereal Market Volume Share (%), by Country 2024 & 2032
- Figure 71: South America Ingredients in Cereal Market Revenue (Million), by Ingredient Type 2024 & 2032
- Figure 72: South America Ingredients in Cereal Market Volume (K Tons), by Ingredient Type 2024 & 2032
- Figure 73: South America Ingredients in Cereal Market Revenue Share (%), by Ingredient Type 2024 & 2032
- Figure 74: South America Ingredients in Cereal Market Volume Share (%), by Ingredient Type 2024 & 2032
- Figure 75: South America Ingredients in Cereal Market Revenue (Million), by Form 2024 & 2032
- Figure 76: South America Ingredients in Cereal Market Volume (K Tons), by Form 2024 & 2032
- Figure 77: South America Ingredients in Cereal Market Revenue Share (%), by Form 2024 & 2032
- Figure 78: South America Ingredients in Cereal Market Volume Share (%), by Form 2024 & 2032
- Figure 79: South America Ingredients in Cereal Market Revenue (Million), by Application 2024 & 2032
- Figure 80: South America Ingredients in Cereal Market Volume (K Tons), by Application 2024 & 2032
- Figure 81: South America Ingredients in Cereal Market Revenue Share (%), by Application 2024 & 2032
- Figure 82: South America Ingredients in Cereal Market Volume Share (%), by Application 2024 & 2032
- Figure 83: South America Ingredients in Cereal Market Revenue (Million), by Country 2024 & 2032
- Figure 84: South America Ingredients in Cereal Market Volume (K Tons), by Country 2024 & 2032
- Figure 85: South America Ingredients in Cereal Market Revenue Share (%), by Country 2024 & 2032
- Figure 86: South America Ingredients in Cereal Market Volume Share (%), by Country 2024 & 2032
- Figure 87: Middle East and Africa Ingredients in Cereal Market Revenue (Million), by Ingredient Type 2024 & 2032
- Figure 88: Middle East and Africa Ingredients in Cereal Market Volume (K Tons), by Ingredient Type 2024 & 2032
- Figure 89: Middle East and Africa Ingredients in Cereal Market Revenue Share (%), by Ingredient Type 2024 & 2032
- Figure 90: Middle East and Africa Ingredients in Cereal Market Volume Share (%), by Ingredient Type 2024 & 2032
- Figure 91: Middle East and Africa Ingredients in Cereal Market Revenue (Million), by Form 2024 & 2032
- Figure 92: Middle East and Africa Ingredients in Cereal Market Volume (K Tons), by Form 2024 & 2032
- Figure 93: Middle East and Africa Ingredients in Cereal Market Revenue Share (%), by Form 2024 & 2032
- Figure 94: Middle East and Africa Ingredients in Cereal Market Volume Share (%), by Form 2024 & 2032
- Figure 95: Middle East and Africa Ingredients in Cereal Market Revenue (Million), by Application 2024 & 2032
- Figure 96: Middle East and Africa Ingredients in Cereal Market Volume (K Tons), by Application 2024 & 2032
- Figure 97: Middle East and Africa Ingredients in Cereal Market Revenue Share (%), by Application 2024 & 2032
- Figure 98: Middle East and Africa Ingredients in Cereal Market Volume Share (%), by Application 2024 & 2032
- Figure 99: Middle East and Africa Ingredients in Cereal Market Revenue (Million), by Country 2024 & 2032
- Figure 100: Middle East and Africa Ingredients in Cereal Market Volume (K Tons), by Country 2024 & 2032
- Figure 101: Middle East and Africa Ingredients in Cereal Market Revenue Share (%), by Country 2024 & 2032
- Figure 102: Middle East and Africa Ingredients in Cereal Market Volume Share (%), by Country 2024 & 2032
List of Tables
- Table 1: Global Ingredients in Cereal Market Revenue Million Forecast, by Region 2019 & 2032
- Table 2: Global Ingredients in Cereal Market Volume K Tons Forecast, by Region 2019 & 2032
- Table 3: Global Ingredients in Cereal Market Revenue Million Forecast, by Ingredient Type 2019 & 2032
- Table 4: Global Ingredients in Cereal Market Volume K Tons Forecast, by Ingredient Type 2019 & 2032
- Table 5: Global Ingredients in Cereal Market Revenue Million Forecast, by Form 2019 & 2032
- Table 6: Global Ingredients in Cereal Market Volume K Tons Forecast, by Form 2019 & 2032
- Table 7: Global Ingredients in Cereal Market Revenue Million Forecast, by Application 2019 & 2032
- Table 8: Global Ingredients in Cereal Market Volume K Tons Forecast, by Application 2019 & 2032
- Table 9: Global Ingredients in Cereal Market Revenue Million Forecast, by Region 2019 & 2032
- Table 10: Global Ingredients in Cereal Market Volume K Tons Forecast, by Region 2019 & 2032
- Table 11: Global Ingredients in Cereal Market Revenue Million Forecast, by Country 2019 & 2032
- Table 12: Global Ingredients in Cereal Market Volume K Tons Forecast, by Country 2019 & 2032
- Table 13: United States Ingredients in Cereal Market Revenue (Million) Forecast, by Application 2019 & 2032
- Table 14: United States Ingredients in Cereal Market Volume (K Tons) Forecast, by Application 2019 & 2032
- Table 15: Canada Ingredients in Cereal Market Revenue (Million) Forecast, by Application 2019 & 2032
- Table 16: Canada Ingredients in Cereal Market Volume (K Tons) Forecast, by Application 2019 & 2032
- Table 17: Mexico Ingredients in Cereal Market Revenue (Million) Forecast, by Application 2019 & 2032
- Table 18: Mexico Ingredients in Cereal Market Volume (K Tons) Forecast, by Application 2019 & 2032
- Table 19: Rest of North America Ingredients in Cereal Market Revenue (Million) Forecast, by Application 2019 & 2032
- Table 20: Rest of North America Ingredients in Cereal Market Volume (K Tons) Forecast, by Application 2019 & 2032
- Table 21: Global Ingredients in Cereal Market Revenue Million Forecast, by Country 2019 & 2032
- Table 22: Global Ingredients in Cereal Market Volume K Tons Forecast, by Country 2019 & 2032
- Table 23: Spain Ingredients in Cereal Market Revenue (Million) Forecast, by Application 2019 & 2032
- Table 24: Spain Ingredients in Cereal Market Volume (K Tons) Forecast, by Application 2019 & 2032
- Table 25: United Kingdom Ingredients in Cereal Market Revenue (Million) Forecast, by Application 2019 & 2032
- Table 26: United Kingdom Ingredients in Cereal Market Volume (K Tons) Forecast, by Application 2019 & 2032
- Table 27: Germany Ingredients in Cereal Market Revenue (Million) Forecast, by Application 2019 & 2032
- Table 28: Germany Ingredients in Cereal Market Volume (K Tons) Forecast, by Application 2019 & 2032
- Table 29: France Ingredients in Cereal Market Revenue (Million) Forecast, by Application 2019 & 2032
- Table 30: France Ingredients in Cereal Market Volume (K Tons) Forecast, by Application 2019 & 2032
- Table 31: Italy Ingredients in Cereal Market Revenue (Million) Forecast, by Application 2019 & 2032
- Table 32: Italy Ingredients in Cereal Market Volume (K Tons) Forecast, by Application 2019 & 2032
- Table 33: Russia Ingredients in Cereal Market Revenue (Million) Forecast, by Application 2019 & 2032
- Table 34: Russia Ingredients in Cereal Market Volume (K Tons) Forecast, by Application 2019 & 2032
- Table 35: Rest of Europe Ingredients in Cereal Market Revenue (Million) Forecast, by Application 2019 & 2032
- Table 36: Rest of Europe Ingredients in Cereal Market Volume (K Tons) Forecast, by Application 2019 & 2032
- Table 37: Global Ingredients in Cereal Market Revenue Million Forecast, by Country 2019 & 2032
- Table 38: Global Ingredients in Cereal Market Volume K Tons Forecast, by Country 2019 & 2032
- Table 39: China Ingredients in Cereal Market Revenue (Million) Forecast, by Application 2019 & 2032
- Table 40: China Ingredients in Cereal Market Volume (K Tons) Forecast, by Application 2019 & 2032
- Table 41: Japan Ingredients in Cereal Market Revenue (Million) Forecast, by Application 2019 & 2032
- Table 42: Japan Ingredients in Cereal Market Volume (K Tons) Forecast, by Application 2019 & 2032
- Table 43: India Ingredients in Cereal Market Revenue (Million) Forecast, by Application 2019 & 2032
- Table 44: India Ingredients in Cereal Market Volume (K Tons) Forecast, by Application 2019 & 2032
- Table 45: Australia Ingredients in Cereal Market Revenue (Million) Forecast, by Application 2019 & 2032
- Table 46: Australia Ingredients in Cereal Market Volume (K Tons) Forecast, by Application 2019 & 2032
- Table 47: Rest of Asia Pacific Ingredients in Cereal Market Revenue (Million) Forecast, by Application 2019 & 2032
- Table 48: Rest of Asia Pacific Ingredients in Cereal Market Volume (K Tons) Forecast, by Application 2019 & 2032
- Table 49: Global Ingredients in Cereal Market Revenue Million Forecast, by Country 2019 & 2032
- Table 50: Global Ingredients in Cereal Market Volume K Tons Forecast, by Country 2019 & 2032
- Table 51: Brazil Ingredients in Cereal Market Revenue (Million) Forecast, by Application 2019 & 2032
- Table 52: Brazil Ingredients in Cereal Market Volume (K Tons) Forecast, by Application 2019 & 2032
- Table 53: Argentina Ingredients in Cereal Market Revenue (Million) Forecast, by Application 2019 & 2032
- Table 54: Argentina Ingredients in Cereal Market Volume (K Tons) Forecast, by Application 2019 & 2032
- Table 55: Rest of South America Ingredients in Cereal Market Revenue (Million) Forecast, by Application 2019 & 2032
- Table 56: Rest of South America Ingredients in Cereal Market Volume (K Tons) Forecast, by Application 2019 & 2032
- Table 57: Global Ingredients in Cereal Market Revenue Million Forecast, by Country 2019 & 2032
- Table 58: Global Ingredients in Cereal Market Volume K Tons Forecast, by Country 2019 & 2032
- Table 59: South Africa Ingredients in Cereal Market Revenue (Million) Forecast, by Application 2019 & 2032
- Table 60: South Africa Ingredients in Cereal Market Volume (K Tons) Forecast, by Application 2019 & 2032
- Table 61: United Arab Emirates Ingredients in Cereal Market Revenue (Million) Forecast, by Application 2019 & 2032
- Table 62: United Arab Emirates Ingredients in Cereal Market Volume (K Tons) Forecast, by Application 2019 & 2032
- Table 63: Rest of Middle East and Africa Ingredients in Cereal Market Revenue (Million) Forecast, by Application 2019 & 2032
- Table 64: Rest of Middle East and Africa Ingredients in Cereal Market Volume (K Tons) Forecast, by Application 2019 & 2032
- Table 65: Global Ingredients in Cereal Market Revenue Million Forecast, by Ingredient Type 2019 & 2032
- Table 66: Global Ingredients in Cereal Market Volume K Tons Forecast, by Ingredient Type 2019 & 2032
- Table 67: Global Ingredients in Cereal Market Revenue Million Forecast, by Form 2019 & 2032
- Table 68: Global Ingredients in Cereal Market Volume K Tons Forecast, by Form 2019 & 2032
- Table 69: Global Ingredients in Cereal Market Revenue Million Forecast, by Application 2019 & 2032
- Table 70: Global Ingredients in Cereal Market Volume K Tons Forecast, by Application 2019 & 2032
- Table 71: Global Ingredients in Cereal Market Revenue Million Forecast, by Country 2019 & 2032
- Table 72: Global Ingredients in Cereal Market Volume K Tons Forecast, by Country 2019 & 2032
- Table 73: United States Ingredients in Cereal Market Revenue (Million) Forecast, by Application 2019 & 2032
- Table 74: United States Ingredients in Cereal Market Volume (K Tons) Forecast, by Application 2019 & 2032
- Table 75: Canada Ingredients in Cereal Market Revenue (Million) Forecast, by Application 2019 & 2032
- Table 76: Canada Ingredients in Cereal Market Volume (K Tons) Forecast, by Application 2019 & 2032
- Table 77: Mexico Ingredients in Cereal Market Revenue (Million) Forecast, by Application 2019 & 2032
- Table 78: Mexico Ingredients in Cereal Market Volume (K Tons) Forecast, by Application 2019 & 2032
- Table 79: Rest of North America Ingredients in Cereal Market Revenue (Million) Forecast, by Application 2019 & 2032
- Table 80: Rest of North America Ingredients in Cereal Market Volume (K Tons) Forecast, by Application 2019 & 2032
- Table 81: Global Ingredients in Cereal Market Revenue Million Forecast, by Ingredient Type 2019 & 2032
- Table 82: Global Ingredients in Cereal Market Volume K Tons Forecast, by Ingredient Type 2019 & 2032
- Table 83: Global Ingredients in Cereal Market Revenue Million Forecast, by Form 2019 & 2032
- Table 84: Global Ingredients in Cereal Market Volume K Tons Forecast, by Form 2019 & 2032
- Table 85: Global Ingredients in Cereal Market Revenue Million Forecast, by Application 2019 & 2032
- Table 86: Global Ingredients in Cereal Market Volume K Tons Forecast, by Application 2019 & 2032
- Table 87: Global Ingredients in Cereal Market Revenue Million Forecast, by Country 2019 & 2032
- Table 88: Global Ingredients in Cereal Market Volume K Tons Forecast, by Country 2019 & 2032
- Table 89: Spain Ingredients in Cereal Market Revenue (Million) Forecast, by Application 2019 & 2032
- Table 90: Spain Ingredients in Cereal Market Volume (K Tons) Forecast, by Application 2019 & 2032
- Table 91: United Kingdom Ingredients in Cereal Market Revenue (Million) Forecast, by Application 2019 & 2032
- Table 92: United Kingdom Ingredients in Cereal Market Volume (K Tons) Forecast, by Application 2019 & 2032
- Table 93: Germany Ingredients in Cereal Market Revenue (Million) Forecast, by Application 2019 & 2032
- Table 94: Germany Ingredients in Cereal Market Volume (K Tons) Forecast, by Application 2019 & 2032
- Table 95: France Ingredients in Cereal Market Revenue (Million) Forecast, by Application 2019 & 2032
- Table 96: France Ingredients in Cereal Market Volume (K Tons) Forecast, by Application 2019 & 2032
- Table 97: Italy Ingredients in Cereal Market Revenue (Million) Forecast, by Application 2019 & 2032
- Table 98: Italy Ingredients in Cereal Market Volume (K Tons) Forecast, by Application 2019 & 2032
- Table 99: Russia Ingredients in Cereal Market Revenue (Million) Forecast, by Application 2019 & 2032
- Table 100: Russia Ingredients in Cereal Market Volume (K Tons) Forecast, by Application 2019 & 2032
- Table 101: Rest of Europe Ingredients in Cereal Market Revenue (Million) Forecast, by Application 2019 & 2032
- Table 102: Rest of Europe Ingredients in Cereal Market Volume (K Tons) Forecast, by Application 2019 & 2032
- Table 103: Global Ingredients in Cereal Market Revenue Million Forecast, by Ingredient Type 2019 & 2032
- Table 104: Global Ingredients in Cereal Market Volume K Tons Forecast, by Ingredient Type 2019 & 2032
- Table 105: Global Ingredients in Cereal Market Revenue Million Forecast, by Form 2019 & 2032
- Table 106: Global Ingredients in Cereal Market Volume K Tons Forecast, by Form 2019 & 2032
- Table 107: Global Ingredients in Cereal Market Revenue Million Forecast, by Application 2019 & 2032
- Table 108: Global Ingredients in Cereal Market Volume K Tons Forecast, by Application 2019 & 2032
- Table 109: Global Ingredients in Cereal Market Revenue Million Forecast, by Country 2019 & 2032
- Table 110: Global Ingredients in Cereal Market Volume K Tons Forecast, by Country 2019 & 2032
- Table 111: China Ingredients in Cereal Market Revenue (Million) Forecast, by Application 2019 & 2032
- Table 112: China Ingredients in Cereal Market Volume (K Tons) Forecast, by Application 2019 & 2032
- Table 113: Japan Ingredients in Cereal Market Revenue (Million) Forecast, by Application 2019 & 2032
- Table 114: Japan Ingredients in Cereal Market Volume (K Tons) Forecast, by Application 2019 & 2032
- Table 115: India Ingredients in Cereal Market Revenue (Million) Forecast, by Application 2019 & 2032
- Table 116: India Ingredients in Cereal Market Volume (K Tons) Forecast, by Application 2019 & 2032
- Table 117: Australia Ingredients in Cereal Market Revenue (Million) Forecast, by Application 2019 & 2032
- Table 118: Australia Ingredients in Cereal Market Volume (K Tons) Forecast, by Application 2019 & 2032
- Table 119: Rest of Asia Pacific Ingredients in Cereal Market Revenue (Million) Forecast, by Application 2019 & 2032
- Table 120: Rest of Asia Pacific Ingredients in Cereal Market Volume (K Tons) Forecast, by Application 2019 & 2032
- Table 121: Global Ingredients in Cereal Market Revenue Million Forecast, by Ingredient Type 2019 & 2032
- Table 122: Global Ingredients in Cereal Market Volume K Tons Forecast, by Ingredient Type 2019 & 2032
- Table 123: Global Ingredients in Cereal Market Revenue Million Forecast, by Form 2019 & 2032
- Table 124: Global Ingredients in Cereal Market Volume K Tons Forecast, by Form 2019 & 2032
- Table 125: Global Ingredients in Cereal Market Revenue Million Forecast, by Application 2019 & 2032
- Table 126: Global Ingredients in Cereal Market Volume K Tons Forecast, by Application 2019 & 2032
- Table 127: Global Ingredients in Cereal Market Revenue Million Forecast, by Country 2019 & 2032
- Table 128: Global Ingredients in Cereal Market Volume K Tons Forecast, by Country 2019 & 2032
- Table 129: Brazil Ingredients in Cereal Market Revenue (Million) Forecast, by Application 2019 & 2032
- Table 130: Brazil Ingredients in Cereal Market Volume (K Tons) Forecast, by Application 2019 & 2032
- Table 131: Argentina Ingredients in Cereal Market Revenue (Million) Forecast, by Application 2019 & 2032
- Table 132: Argentina Ingredients in Cereal Market Volume (K Tons) Forecast, by Application 2019 & 2032
- Table 133: Rest of South America Ingredients in Cereal Market Revenue (Million) Forecast, by Application 2019 & 2032
- Table 134: Rest of South America Ingredients in Cereal Market Volume (K Tons) Forecast, by Application 2019 & 2032
- Table 135: Global Ingredients in Cereal Market Revenue Million Forecast, by Ingredient Type 2019 & 2032
- Table 136: Global Ingredients in Cereal Market Volume K Tons Forecast, by Ingredient Type 2019 & 2032
- Table 137: Global Ingredients in Cereal Market Revenue Million Forecast, by Form 2019 & 2032
- Table 138: Global Ingredients in Cereal Market Volume K Tons Forecast, by Form 2019 & 2032
- Table 139: Global Ingredients in Cereal Market Revenue Million Forecast, by Application 2019 & 2032
- Table 140: Global Ingredients in Cereal Market Volume K Tons Forecast, by Application 2019 & 2032
- Table 141: Global Ingredients in Cereal Market Revenue Million Forecast, by Country 2019 & 2032
- Table 142: Global Ingredients in Cereal Market Volume K Tons Forecast, by Country 2019 & 2032
- Table 143: South Africa Ingredients in Cereal Market Revenue (Million) Forecast, by Application 2019 & 2032
- Table 144: South Africa Ingredients in Cereal Market Volume (K Tons) Forecast, by Application 2019 & 2032
- Table 145: United Arab Emirates Ingredients in Cereal Market Revenue (Million) Forecast, by Application 2019 & 2032
- Table 146: United Arab Emirates Ingredients in Cereal Market Volume (K Tons) Forecast, by Application 2019 & 2032
- Table 147: Rest of Middle East and Africa Ingredients in Cereal Market Revenue (Million) Forecast, by Application 2019 & 2032
- Table 148: Rest of Middle East and Africa Ingredients in Cereal Market Volume (K Tons) Forecast, by Application 2019 & 2032
Frequently Asked Questions
1. What is the projected Compound Annual Growth Rate (CAGR) of the Ingredients in Cereal Market?
The projected CAGR is approximately 5.20%.
2. Which companies are prominent players in the Ingredients in Cereal Market?
Key companies in the market include Groupe Limagrain Holding, Archer Daniels Midland Company, Bunge Limited, RiceBran Technologies, Cargill Inc, Associated British Foods PLC, Kellogg's, General Mills *List Not Exhaustive, SunOpta Inc, CII Foods.
3. What are the main segments of the Ingredients in Cereal Market?
The market segments include Ingredient Type, Form, Application.
4. Can you provide details about the market size?
The market size is estimated to be USD 432 Million as of 2022.
5. What are some drivers contributing to market growth?
Growing Health and Fitness Consciousness Among Japanese; Increasing Demand for Meat Analogues.
6. What are the notable trends driving market growth?
Increase in Demand for Products with Health Benefits.
7. Are there any restraints impacting market growth?
Higher Production Costs and Limited Capacities.
8. Can you provide examples of recent developments in the market?
In June 2021, General Mills invested USD 28 million to expand its cereal production plant in Ohio. The expansion includes building renovation and installing sophisticated equipment.
9. What pricing options are available for accessing the report?
Pricing options include single-user, multi-user, and enterprise licenses priced at USD 4750, USD 5250, and USD 8750 respectively.
10. Is the market size provided in terms of value or volume?
The market size is provided in terms of value, measured in Million and volume, measured in K Tons.
11. Are there any specific market keywords associated with the report?
Yes, the market keyword associated with the report is "Ingredients in Cereal Market," which aids in identifying and referencing the specific market segment covered.
12. How do I determine which pricing option suits my needs best?
The pricing options vary based on user requirements and access needs. Individual users may opt for single-user licenses, while businesses requiring broader access may choose multi-user or enterprise licenses for cost-effective access to the report.
13. Are there any additional resources or data provided in the Ingredients in Cereal Market report?
While the report offers comprehensive insights, it's advisable to review the specific contents or supplementary materials provided to ascertain if additional resources or data are available.
14. How can I stay updated on further developments or reports in the Ingredients in Cereal Market?
To stay informed about further developments, trends, and reports in the Ingredients in Cereal Market, consider subscribing to industry newsletters, following relevant companies and organizations, or regularly checking reputable industry news sources and publications.
Methodology
Step 1 - Identification of Relevant Samples Size from Population Database


Step 2 - Approaches for Defining Global Market Size (Value, Volume* & Price*)

Note*: In applicable scenarios
Step 3 - Data Sources
Primary Research
- Web Analytics
- Survey Reports
- Research Institute
- Latest Research Reports
- Opinion Leaders
Secondary Research
- Annual Reports
- White Paper
- Latest Press Release
- Industry Association
- Paid Database
- Investor Presentations

Step 4 - Data Triangulation
Involves using different sources of information in order to increase the validity of a study
These sources are likely to be stakeholders in a program - participants, other researchers, program staff, other community members, and so on.
Then we put all data in single framework & apply various statistical tools to find out the dynamic on the market.
During the analysis stage, feedback from the stakeholder groups would be compared to determine areas of agreement as well as areas of divergence


