
Key Insights
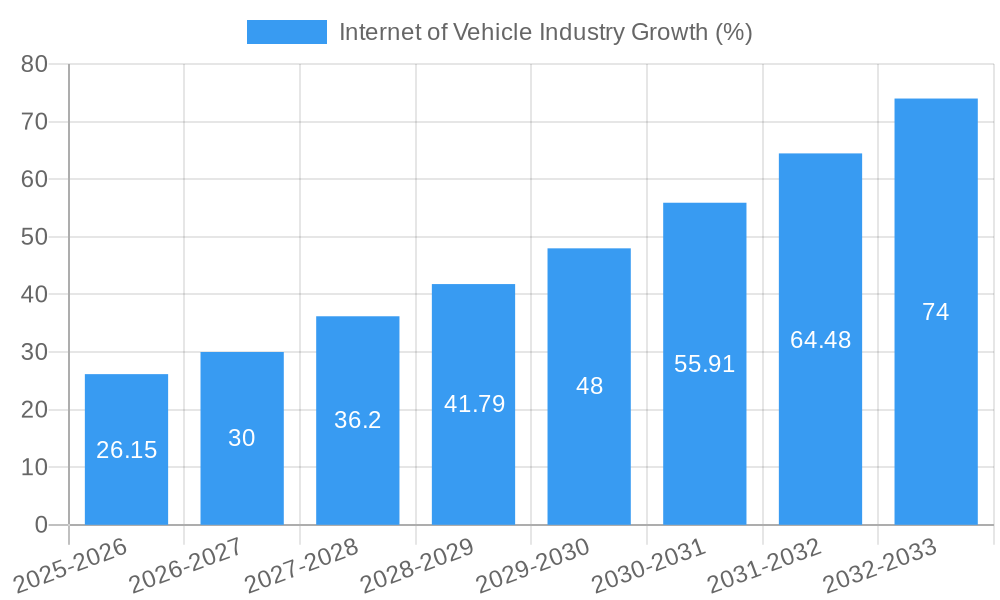
The Internet of Vehicles (IoV) industry is experiencing robust growth, projected to reach a market size of $161.51 million in 2025 and exhibiting a Compound Annual Growth Rate (CAGR) of 16.38%. This expansion is fueled by several key drivers. The increasing demand for enhanced safety features, such as real-time transit management and remote monitoring systems, is a significant factor. Furthermore, the rising adoption of connected car technologies, including integrated entertainment and fleet management solutions, is boosting market penetration. Government initiatives promoting smart transportation and autonomous driving are also contributing to this growth. The automotive and transportation and logistics sectors are leading adopters, driving demand for various IoV software solutions and applications. However, challenges such as data security concerns and the high initial investment costs associated with implementing IoV infrastructure pose restraints to market growth. Overcoming these hurdles through robust cybersecurity measures and innovative financing models will be crucial for sustained expansion.
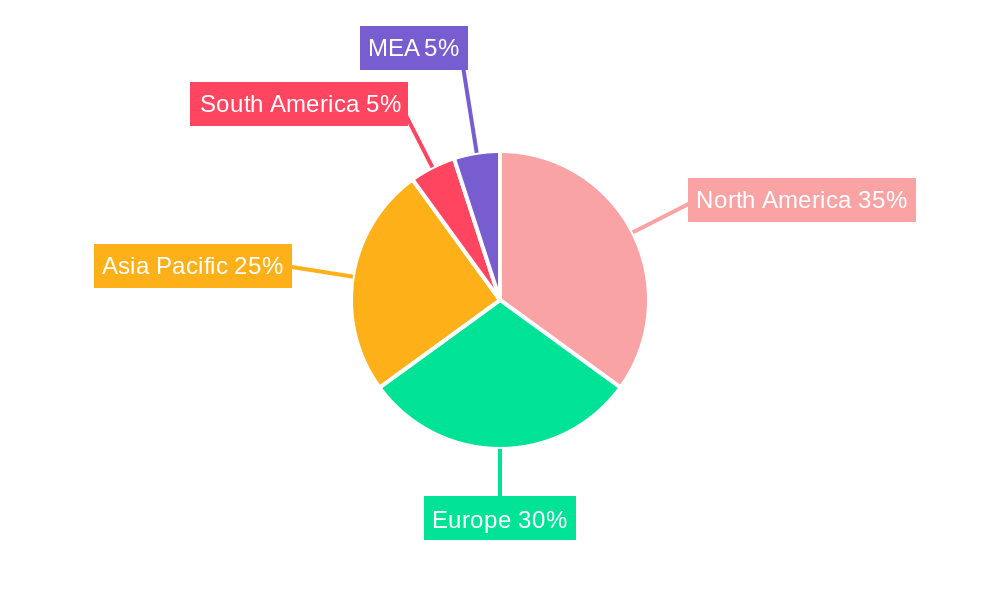
Looking ahead, several trends are shaping the future of the IoV market. The increasing integration of artificial intelligence (AI) and machine learning (ML) in IoV applications is improving predictive maintenance, optimizing traffic flow, and enhancing driver safety. The growing adoption of 5G technology is enabling faster data transmission and supporting real-time communication between vehicles and infrastructure. Furthermore, the development of sophisticated cybersecurity protocols is mitigating data breach risks. Regionally, North America and Europe currently hold significant market share, driven by early adoption and well-established automotive and technology industries. However, Asia-Pacific is expected to witness significant growth in the coming years due to rapid infrastructure development and increasing vehicle ownership. The continued innovation in software solutions, coupled with supportive regulatory environments, will pave the way for accelerated growth of the IoV market in the coming decade.
Internet of Vehicle (IoV) Industry Market Report: 2019-2033
This comprehensive report provides a detailed analysis of the Internet of Vehicle (IoV) industry, offering invaluable insights for industry professionals, investors, and strategists. Covering the period from 2019 to 2033, with a focus on 2025, this report leverages extensive market research to forecast future trends and opportunities within this rapidly evolving sector. The global IoV market is projected to reach xx Million by 2033, showcasing significant growth potential.
Internet of Vehicle Industry Market Structure & Innovation Trends
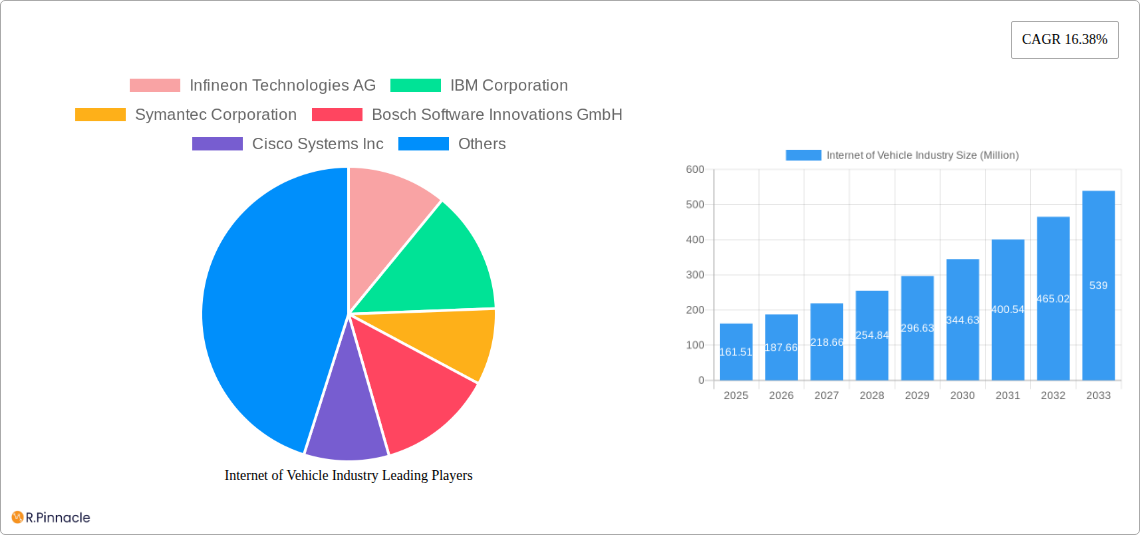
This section analyzes the competitive landscape of the IoV market, examining market concentration, key innovation drivers, regulatory influences, and the impact of mergers and acquisitions (M&A). The market is characterized by a mix of established players like Infineon Technologies AG, IBM Corporation, Symantec Corporation, Bosch Software Innovations GmbH, Cisco Systems Inc, Microsoft Corporation, Tesla Motors Inc, Waymo LLC (Alphabet Inc), Oracle Corporation, General Electric Company, and SAP SE, and emerging technology companies.
- Market Concentration: The market exhibits a moderately concentrated structure, with a few dominant players controlling a significant portion (xx%) of the market share. However, a considerable number of smaller players contribute to the overall market dynamics.
- Innovation Drivers: Advancements in areas like 5G connectivity, AI, cloud computing, and cybersecurity are key drivers of innovation. The development of autonomous driving features and improved vehicle-to-everything (V2X) communication are significantly impacting market growth.
- Regulatory Frameworks: Government regulations regarding data privacy, cybersecurity, and autonomous vehicle deployment play a crucial role in shaping market developments. Compliance and standardization efforts are ongoing and influence market strategies.
- Product Substitutes: The primary substitutes are conventional in-vehicle systems and services without connected capabilities. However, increasing demand for enhanced safety, convenience, and efficiency is driving adoption of IoV solutions.
- End-User Demographics: The target audience spans across various segments, including individual vehicle owners, fleet operators, transportation and logistics companies, and automotive manufacturers. The increasing adoption of connected cars across all demographics is driving market expansion.
- M&A Activities: The IoV sector has witnessed substantial M&A activity in recent years, with deals valued at xx Million, driven by the desire to expand capabilities, acquire technological expertise, and gain market share.
Internet of Vehicle Industry Market Dynamics & Trends
The IoV market is experiencing robust growth, driven by several factors. The Compound Annual Growth Rate (CAGR) during the forecast period (2025-2033) is estimated at xx%. Market penetration is steadily increasing, with an estimated xx% of vehicles expected to be connected by 2033.
Technological advancements, such as the proliferation of 5G networks and improvements in sensor technology, are significantly influencing market expansion. Consumer preferences are shifting toward enhanced safety features, infotainment systems, and autonomous driving capabilities. Competitive dynamics are marked by intense rivalry, with companies focusing on differentiation through innovative product offerings and strategic partnerships. The rising demand for data-driven insights and improved fleet management solutions is further fueling market growth. The increasing adoption of connected cars for both personal and commercial use is also driving the market forward. Government regulations concerning data privacy, cybersecurity and autonomous driving are constantly evolving which shapes and influences strategic business decisions.
Dominant Regions & Segments in Internet of Vehicle Industry
The [Dominant Region, e.g., North America] region holds the largest market share in the IoV industry, driven by factors such as advanced technological infrastructure, higher vehicle ownership rates, and favorable government policies. Other significant regions include [Region 2] and [Region 3]. Within segments:
By Software Solutions:
- Security Solution: High demand for robust cybersecurity measures to protect against data breaches and cyberattacks.
- Real-time Transit Management System: The need for efficient and real-time monitoring and management of public transportation systems.
- Remote Monitoring System: Growing adoption for improved vehicle maintenance, diagnostics, and operational efficiency.
By Applications:
- Mobility Management: The increasing use of ride-hailing services and shared mobility solutions is accelerating adoption.
- Vehicle Management: The need for better monitoring of fleet vehicles to enhance efficiency and reduce operational costs is high.
By End-user Industry:
- Automotive: The automotive sector is leading adoption, driving the largest segment of the market. This is further propelled by increasing competition and the introduction of new features in advanced driver-assistance systems (ADAS) and autonomous vehicle technology.
- Transportation and Logistics: The demand for enhanced fleet management, route optimization, and improved supply chain visibility is driving growth in this segment.
Key drivers in the dominant regions include robust technological infrastructure, supportive government policies, and a growing consumer base.
Internet of Vehicle Industry Product Innovations
Recent innovations focus on enhancing vehicle safety, improving driver assistance features, and integrating seamless connectivity. The development of advanced driver-assistance systems (ADAS) using artificial intelligence (AI) and machine learning (ML) is a significant trend. The integration of improved V2X communication and advanced telematics systems enhances safety and efficiency. These innovations are improving the user experience and streamlining the functionality of vehicles.
Report Scope & Segmentation Analysis
This report comprehensively segments the IoV market by software solutions (Real-time Transit Management System, Security Solution, Remote Monitoring System, Network Bandwidth Management, Fleet Management), applications (Mobility Management, Vehicle Management, Integrated Entertainment), and end-user industries (Transportation and Logistics, Automotive, Others). Each segment's growth projections, market size, and competitive dynamics are analyzed, providing a granular understanding of market opportunities. Growth projections vary across segments, with software solutions and the automotive end-user industry showing high growth potential.
Key Drivers of Internet of Vehicle Industry Growth
Several factors are driving the growth of the IoV industry: Firstly, advancements in technology, such as 5G connectivity and AI, are crucial for improved performance and increased capabilities. Secondly, economic incentives, including government subsidies for the adoption of connected vehicles and initiatives to promote smart cities, are driving market expansion. Finally, favorable regulations and standards relating to data privacy and cybersecurity are creating a conducive environment for market growth.
Challenges in the Internet of Vehicle Industry Sector
Challenges include high initial investment costs for implementing IoV solutions, concerns over data security and privacy, and the complexity of integrating various technologies and systems within vehicles. Regulatory uncertainties concerning data privacy and autonomous vehicle deployment also pose significant hurdles. Supply chain disruptions can also impact production and availability of IoV components and technology. Competitive pressures and the need for continuous innovation to stay ahead of competitors are constant concerns for the market players.
Emerging Opportunities in Internet of Vehicle Industry
Emerging opportunities lie in the expansion of V2X communication, the integration of AI-powered features, and the development of new services based on data analytics from connected vehicles. The growth of autonomous driving is expected to create significant opportunities in this sector, as is the increasing integration of IoT solutions into other vehicular systems. This is projected to be further accelerated by the increase in the adoption of connected cars and improved access to the internet.
Leading Players in the Internet of Vehicle Industry Market
- Infineon Technologies AG
- IBM Corporation
- Symantec Corporation
- Bosch Software Innovations GmbH
- Cisco Systems Inc
- Microsoft Corporation
- Tesla Motors Inc
- Waymo LLC (Alphabet Inc)
- Oracle Corporation
- General Electric Company
- SAP SE
Key Developments in Internet of Vehicle Industry
- September 2022: Bosch and Mercedes-Benz's driverless parking system received commercial approval, highlighting advancements in autonomous driving technology.
- February 2023: Cisco Systems, Inc. partnered with Mercedes-Benz to enhance the in-car mobile office experience in the new E-Class vehicles, indicating the growing integration of workplace technologies within vehicles.
Future Outlook for Internet of Vehicle Industry Market
The IoV market exhibits significant growth potential, driven by continuous technological advancements, expanding adoption rates, and increasing demand for enhanced safety, convenience, and efficiency. Strategic partnerships, collaborations, and continuous innovation will be crucial for companies to capitalize on the significant opportunities presented by this evolving market. The market shows increasing consolidation and market share gains by players who successfully integrate new technologies and offer value added services.
Internet of Vehicle Industry Segmentation
-
1. Software Solutions
- 1.1. Real time Transit Management System
- 1.2. Security Solution
- 1.3. Remote Monitoring System
- 1.4. Network Bandwidth Management
- 1.5. Fleet Management
-
2. Applications
- 2.1. Mobility Management
- 2.2. Vehicle Management
- 2.3. Integrated Entertainment
-
3. End-user Industry
- 3.1. Transportation and Logistics
- 3.2. Automotive
- 3.3. Others End User Industries
Internet of Vehicle Industry Segmentation By Geography
- 1. North America
- 2. Europe
- 3. Asia Pacific
- 4. Rest of the World
Internet of Vehicle Industry REPORT HIGHLIGHTS
| Aspects | Details |
|---|---|
| Study Period | 2019-2033 |
| Base Year | 2024 |
| Estimated Year | 2025 |
| Forecast Period | 2025-2033 |
| Historical Period | 2019-2024 |
| Growth Rate | CAGR of 16.38% from 2019-2033 |
| Segmentation |
|
Table of Contents
- 1. Introduction
- 1.1. Research Scope
- 1.2. Market Segmentation
- 1.3. Research Methodology
- 1.4. Definitions and Assumptions
- 2. Executive Summary
- 2.1. Introduction
- 3. Market Dynamics
- 3.1. Introduction
- 3.2. Market Drivers
- 3.2.1. Increased Government Funding and Investments in Connected Transport System; Growing Demand for Smart Applications in Cars
- 3.3. Market Restrains
- 3.3.1. Slower Rate of Penetration of Connected Systems across the Developing Economies; High Initial Cost of Smart Transportation System
- 3.4. Market Trends
- 3.4.1. Automotive Sector to Witness the Growth
- 4. Market Factor Analysis
- 4.1. Porters Five Forces
- 4.2. Supply/Value Chain
- 4.3. PESTEL analysis
- 4.4. Market Entropy
- 4.5. Patent/Trademark Analysis
- 5. Global Internet of Vehicle Industry Analysis, Insights and Forecast, 2019-2031
- 5.1. Market Analysis, Insights and Forecast - by Software Solutions
- 5.1.1. Real time Transit Management System
- 5.1.2. Security Solution
- 5.1.3. Remote Monitoring System
- 5.1.4. Network Bandwidth Management
- 5.1.5. Fleet Management
- 5.2. Market Analysis, Insights and Forecast - by Applications
- 5.2.1. Mobility Management
- 5.2.2. Vehicle Management
- 5.2.3. Integrated Entertainment
- 5.3. Market Analysis, Insights and Forecast - by End-user Industry
- 5.3.1. Transportation and Logistics
- 5.3.2. Automotive
- 5.3.3. Others End User Industries
- 5.4. Market Analysis, Insights and Forecast - by Region
- 5.4.1. North America
- 5.4.2. Europe
- 5.4.3. Asia Pacific
- 5.4.4. Rest of the World
- 5.1. Market Analysis, Insights and Forecast - by Software Solutions
- 6. North America Internet of Vehicle Industry Analysis, Insights and Forecast, 2019-2031
- 6.1. Market Analysis, Insights and Forecast - by Software Solutions
- 6.1.1. Real time Transit Management System
- 6.1.2. Security Solution
- 6.1.3. Remote Monitoring System
- 6.1.4. Network Bandwidth Management
- 6.1.5. Fleet Management
- 6.2. Market Analysis, Insights and Forecast - by Applications
- 6.2.1. Mobility Management
- 6.2.2. Vehicle Management
- 6.2.3. Integrated Entertainment
- 6.3. Market Analysis, Insights and Forecast - by End-user Industry
- 6.3.1. Transportation and Logistics
- 6.3.2. Automotive
- 6.3.3. Others End User Industries
- 6.1. Market Analysis, Insights and Forecast - by Software Solutions
- 7. Europe Internet of Vehicle Industry Analysis, Insights and Forecast, 2019-2031
- 7.1. Market Analysis, Insights and Forecast - by Software Solutions
- 7.1.1. Real time Transit Management System
- 7.1.2. Security Solution
- 7.1.3. Remote Monitoring System
- 7.1.4. Network Bandwidth Management
- 7.1.5. Fleet Management
- 7.2. Market Analysis, Insights and Forecast - by Applications
- 7.2.1. Mobility Management
- 7.2.2. Vehicle Management
- 7.2.3. Integrated Entertainment
- 7.3. Market Analysis, Insights and Forecast - by End-user Industry
- 7.3.1. Transportation and Logistics
- 7.3.2. Automotive
- 7.3.3. Others End User Industries
- 7.1. Market Analysis, Insights and Forecast - by Software Solutions
- 8. Asia Pacific Internet of Vehicle Industry Analysis, Insights and Forecast, 2019-2031
- 8.1. Market Analysis, Insights and Forecast - by Software Solutions
- 8.1.1. Real time Transit Management System
- 8.1.2. Security Solution
- 8.1.3. Remote Monitoring System
- 8.1.4. Network Bandwidth Management
- 8.1.5. Fleet Management
- 8.2. Market Analysis, Insights and Forecast - by Applications
- 8.2.1. Mobility Management
- 8.2.2. Vehicle Management
- 8.2.3. Integrated Entertainment
- 8.3. Market Analysis, Insights and Forecast - by End-user Industry
- 8.3.1. Transportation and Logistics
- 8.3.2. Automotive
- 8.3.3. Others End User Industries
- 8.1. Market Analysis, Insights and Forecast - by Software Solutions
- 9. Rest of the World Internet of Vehicle Industry Analysis, Insights and Forecast, 2019-2031
- 9.1. Market Analysis, Insights and Forecast - by Software Solutions
- 9.1.1. Real time Transit Management System
- 9.1.2. Security Solution
- 9.1.3. Remote Monitoring System
- 9.1.4. Network Bandwidth Management
- 9.1.5. Fleet Management
- 9.2. Market Analysis, Insights and Forecast - by Applications
- 9.2.1. Mobility Management
- 9.2.2. Vehicle Management
- 9.2.3. Integrated Entertainment
- 9.3. Market Analysis, Insights and Forecast - by End-user Industry
- 9.3.1. Transportation and Logistics
- 9.3.2. Automotive
- 9.3.3. Others End User Industries
- 9.1. Market Analysis, Insights and Forecast - by Software Solutions
- 10. North America Internet of Vehicle Industry Analysis, Insights and Forecast, 2019-2031
- 10.1. Market Analysis, Insights and Forecast - By Country/Sub-region
- 10.1.1 United States
- 10.1.2 Canada
- 10.1.3 Mexico
- 11. Europe Internet of Vehicle Industry Analysis, Insights and Forecast, 2019-2031
- 11.1. Market Analysis, Insights and Forecast - By Country/Sub-region
- 11.1.1 Germany
- 11.1.2 United Kingdom
- 11.1.3 France
- 11.1.4 Spain
- 11.1.5 Italy
- 11.1.6 Spain
- 11.1.7 Belgium
- 11.1.8 Netherland
- 11.1.9 Nordics
- 11.1.10 Rest of Europe
- 12. Asia Pacific Internet of Vehicle Industry Analysis, Insights and Forecast, 2019-2031
- 12.1. Market Analysis, Insights and Forecast - By Country/Sub-region
- 12.1.1 China
- 12.1.2 Japan
- 12.1.3 India
- 12.1.4 South Korea
- 12.1.5 Southeast Asia
- 12.1.6 Australia
- 12.1.7 Indonesia
- 12.1.8 Phillipes
- 12.1.9 Singapore
- 12.1.10 Thailandc
- 12.1.11 Rest of Asia Pacific
- 13. South America Internet of Vehicle Industry Analysis, Insights and Forecast, 2019-2031
- 13.1. Market Analysis, Insights and Forecast - By Country/Sub-region
- 13.1.1 Brazil
- 13.1.2 Argentina
- 13.1.3 Peru
- 13.1.4 Chile
- 13.1.5 Colombia
- 13.1.6 Ecuador
- 13.1.7 Venezuela
- 13.1.8 Rest of South America
- 14. North America Internet of Vehicle Industry Analysis, Insights and Forecast, 2019-2031
- 14.1. Market Analysis, Insights and Forecast - By Country/Sub-region
- 14.1.1 United States
- 14.1.2 Canada
- 14.1.3 Mexico
- 15. MEA Internet of Vehicle Industry Analysis, Insights and Forecast, 2019-2031
- 15.1. Market Analysis, Insights and Forecast - By Country/Sub-region
- 15.1.1 United Arab Emirates
- 15.1.2 Saudi Arabia
- 15.1.3 South Africa
- 15.1.4 Rest of Middle East and Africa
- 16. Competitive Analysis
- 16.1. Global Market Share Analysis 2024
- 16.2. Company Profiles
- 16.2.1 Infineon Technologies AG
- 16.2.1.1. Overview
- 16.2.1.2. Products
- 16.2.1.3. SWOT Analysis
- 16.2.1.4. Recent Developments
- 16.2.1.5. Financials (Based on Availability)
- 16.2.2 IBM Corporation
- 16.2.2.1. Overview
- 16.2.2.2. Products
- 16.2.2.3. SWOT Analysis
- 16.2.2.4. Recent Developments
- 16.2.2.5. Financials (Based on Availability)
- 16.2.3 Symantec Corporation
- 16.2.3.1. Overview
- 16.2.3.2. Products
- 16.2.3.3. SWOT Analysis
- 16.2.3.4. Recent Developments
- 16.2.3.5. Financials (Based on Availability)
- 16.2.4 Bosch Software Innovations GmbH
- 16.2.4.1. Overview
- 16.2.4.2. Products
- 16.2.4.3. SWOT Analysis
- 16.2.4.4. Recent Developments
- 16.2.4.5. Financials (Based on Availability)
- 16.2.5 Cisco Systems Inc
- 16.2.5.1. Overview
- 16.2.5.2. Products
- 16.2.5.3. SWOT Analysis
- 16.2.5.4. Recent Developments
- 16.2.5.5. Financials (Based on Availability)
- 16.2.6 Microsoft Corporation
- 16.2.6.1. Overview
- 16.2.6.2. Products
- 16.2.6.3. SWOT Analysis
- 16.2.6.4. Recent Developments
- 16.2.6.5. Financials (Based on Availability)
- 16.2.7 Tesla Motors Inc
- 16.2.7.1. Overview
- 16.2.7.2. Products
- 16.2.7.3. SWOT Analysis
- 16.2.7.4. Recent Developments
- 16.2.7.5. Financials (Based on Availability)
- 16.2.8 Waymo LLC (Alphabet Inc )
- 16.2.8.1. Overview
- 16.2.8.2. Products
- 16.2.8.3. SWOT Analysis
- 16.2.8.4. Recent Developments
- 16.2.8.5. Financials (Based on Availability)
- 16.2.9 Oracle Corporation
- 16.2.9.1. Overview
- 16.2.9.2. Products
- 16.2.9.3. SWOT Analysis
- 16.2.9.4. Recent Developments
- 16.2.9.5. Financials (Based on Availability)
- 16.2.10 General Electric Company
- 16.2.10.1. Overview
- 16.2.10.2. Products
- 16.2.10.3. SWOT Analysis
- 16.2.10.4. Recent Developments
- 16.2.10.5. Financials (Based on Availability)
- 16.2.11 SAP SE
- 16.2.11.1. Overview
- 16.2.11.2. Products
- 16.2.11.3. SWOT Analysis
- 16.2.11.4. Recent Developments
- 16.2.11.5. Financials (Based on Availability)
- 16.2.1 Infineon Technologies AG
List of Figures
- Figure 1: Global Internet of Vehicle Industry Revenue Breakdown (Million, %) by Region 2024 & 2032
- Figure 2: North America Internet of Vehicle Industry Revenue (Million), by Country 2024 & 2032
- Figure 3: North America Internet of Vehicle Industry Revenue Share (%), by Country 2024 & 2032
- Figure 4: Europe Internet of Vehicle Industry Revenue (Million), by Country 2024 & 2032
- Figure 5: Europe Internet of Vehicle Industry Revenue Share (%), by Country 2024 & 2032
- Figure 6: Asia Pacific Internet of Vehicle Industry Revenue (Million), by Country 2024 & 2032
- Figure 7: Asia Pacific Internet of Vehicle Industry Revenue Share (%), by Country 2024 & 2032
- Figure 8: South America Internet of Vehicle Industry Revenue (Million), by Country 2024 & 2032
- Figure 9: South America Internet of Vehicle Industry Revenue Share (%), by Country 2024 & 2032
- Figure 10: North America Internet of Vehicle Industry Revenue (Million), by Country 2024 & 2032
- Figure 11: North America Internet of Vehicle Industry Revenue Share (%), by Country 2024 & 2032
- Figure 12: MEA Internet of Vehicle Industry Revenue (Million), by Country 2024 & 2032
- Figure 13: MEA Internet of Vehicle Industry Revenue Share (%), by Country 2024 & 2032
- Figure 14: North America Internet of Vehicle Industry Revenue (Million), by Software Solutions 2024 & 2032
- Figure 15: North America Internet of Vehicle Industry Revenue Share (%), by Software Solutions 2024 & 2032
- Figure 16: North America Internet of Vehicle Industry Revenue (Million), by Applications 2024 & 2032
- Figure 17: North America Internet of Vehicle Industry Revenue Share (%), by Applications 2024 & 2032
- Figure 18: North America Internet of Vehicle Industry Revenue (Million), by End-user Industry 2024 & 2032
- Figure 19: North America Internet of Vehicle Industry Revenue Share (%), by End-user Industry 2024 & 2032
- Figure 20: North America Internet of Vehicle Industry Revenue (Million), by Country 2024 & 2032
- Figure 21: North America Internet of Vehicle Industry Revenue Share (%), by Country 2024 & 2032
- Figure 22: Europe Internet of Vehicle Industry Revenue (Million), by Software Solutions 2024 & 2032
- Figure 23: Europe Internet of Vehicle Industry Revenue Share (%), by Software Solutions 2024 & 2032
- Figure 24: Europe Internet of Vehicle Industry Revenue (Million), by Applications 2024 & 2032
- Figure 25: Europe Internet of Vehicle Industry Revenue Share (%), by Applications 2024 & 2032
- Figure 26: Europe Internet of Vehicle Industry Revenue (Million), by End-user Industry 2024 & 2032
- Figure 27: Europe Internet of Vehicle Industry Revenue Share (%), by End-user Industry 2024 & 2032
- Figure 28: Europe Internet of Vehicle Industry Revenue (Million), by Country 2024 & 2032
- Figure 29: Europe Internet of Vehicle Industry Revenue Share (%), by Country 2024 & 2032
- Figure 30: Asia Pacific Internet of Vehicle Industry Revenue (Million), by Software Solutions 2024 & 2032
- Figure 31: Asia Pacific Internet of Vehicle Industry Revenue Share (%), by Software Solutions 2024 & 2032
- Figure 32: Asia Pacific Internet of Vehicle Industry Revenue (Million), by Applications 2024 & 2032
- Figure 33: Asia Pacific Internet of Vehicle Industry Revenue Share (%), by Applications 2024 & 2032
- Figure 34: Asia Pacific Internet of Vehicle Industry Revenue (Million), by End-user Industry 2024 & 2032
- Figure 35: Asia Pacific Internet of Vehicle Industry Revenue Share (%), by End-user Industry 2024 & 2032
- Figure 36: Asia Pacific Internet of Vehicle Industry Revenue (Million), by Country 2024 & 2032
- Figure 37: Asia Pacific Internet of Vehicle Industry Revenue Share (%), by Country 2024 & 2032
- Figure 38: Rest of the World Internet of Vehicle Industry Revenue (Million), by Software Solutions 2024 & 2032
- Figure 39: Rest of the World Internet of Vehicle Industry Revenue Share (%), by Software Solutions 2024 & 2032
- Figure 40: Rest of the World Internet of Vehicle Industry Revenue (Million), by Applications 2024 & 2032
- Figure 41: Rest of the World Internet of Vehicle Industry Revenue Share (%), by Applications 2024 & 2032
- Figure 42: Rest of the World Internet of Vehicle Industry Revenue (Million), by End-user Industry 2024 & 2032
- Figure 43: Rest of the World Internet of Vehicle Industry Revenue Share (%), by End-user Industry 2024 & 2032
- Figure 44: Rest of the World Internet of Vehicle Industry Revenue (Million), by Country 2024 & 2032
- Figure 45: Rest of the World Internet of Vehicle Industry Revenue Share (%), by Country 2024 & 2032
List of Tables
- Table 1: Global Internet of Vehicle Industry Revenue Million Forecast, by Region 2019 & 2032
- Table 2: Global Internet of Vehicle Industry Revenue Million Forecast, by Software Solutions 2019 & 2032
- Table 3: Global Internet of Vehicle Industry Revenue Million Forecast, by Applications 2019 & 2032
- Table 4: Global Internet of Vehicle Industry Revenue Million Forecast, by End-user Industry 2019 & 2032
- Table 5: Global Internet of Vehicle Industry Revenue Million Forecast, by Region 2019 & 2032
- Table 6: Global Internet of Vehicle Industry Revenue Million Forecast, by Country 2019 & 2032
- Table 7: United States Internet of Vehicle Industry Revenue (Million) Forecast, by Application 2019 & 2032
- Table 8: Canada Internet of Vehicle Industry Revenue (Million) Forecast, by Application 2019 & 2032
- Table 9: Mexico Internet of Vehicle Industry Revenue (Million) Forecast, by Application 2019 & 2032
- Table 10: Global Internet of Vehicle Industry Revenue Million Forecast, by Country 2019 & 2032
- Table 11: Germany Internet of Vehicle Industry Revenue (Million) Forecast, by Application 2019 & 2032
- Table 12: United Kingdom Internet of Vehicle Industry Revenue (Million) Forecast, by Application 2019 & 2032
- Table 13: France Internet of Vehicle Industry Revenue (Million) Forecast, by Application 2019 & 2032
- Table 14: Spain Internet of Vehicle Industry Revenue (Million) Forecast, by Application 2019 & 2032
- Table 15: Italy Internet of Vehicle Industry Revenue (Million) Forecast, by Application 2019 & 2032
- Table 16: Spain Internet of Vehicle Industry Revenue (Million) Forecast, by Application 2019 & 2032
- Table 17: Belgium Internet of Vehicle Industry Revenue (Million) Forecast, by Application 2019 & 2032
- Table 18: Netherland Internet of Vehicle Industry Revenue (Million) Forecast, by Application 2019 & 2032
- Table 19: Nordics Internet of Vehicle Industry Revenue (Million) Forecast, by Application 2019 & 2032
- Table 20: Rest of Europe Internet of Vehicle Industry Revenue (Million) Forecast, by Application 2019 & 2032
- Table 21: Global Internet of Vehicle Industry Revenue Million Forecast, by Country 2019 & 2032
- Table 22: China Internet of Vehicle Industry Revenue (Million) Forecast, by Application 2019 & 2032
- Table 23: Japan Internet of Vehicle Industry Revenue (Million) Forecast, by Application 2019 & 2032
- Table 24: India Internet of Vehicle Industry Revenue (Million) Forecast, by Application 2019 & 2032
- Table 25: South Korea Internet of Vehicle Industry Revenue (Million) Forecast, by Application 2019 & 2032
- Table 26: Southeast Asia Internet of Vehicle Industry Revenue (Million) Forecast, by Application 2019 & 2032
- Table 27: Australia Internet of Vehicle Industry Revenue (Million) Forecast, by Application 2019 & 2032
- Table 28: Indonesia Internet of Vehicle Industry Revenue (Million) Forecast, by Application 2019 & 2032
- Table 29: Phillipes Internet of Vehicle Industry Revenue (Million) Forecast, by Application 2019 & 2032
- Table 30: Singapore Internet of Vehicle Industry Revenue (Million) Forecast, by Application 2019 & 2032
- Table 31: Thailandc Internet of Vehicle Industry Revenue (Million) Forecast, by Application 2019 & 2032
- Table 32: Rest of Asia Pacific Internet of Vehicle Industry Revenue (Million) Forecast, by Application 2019 & 2032
- Table 33: Global Internet of Vehicle Industry Revenue Million Forecast, by Country 2019 & 2032
- Table 34: Brazil Internet of Vehicle Industry Revenue (Million) Forecast, by Application 2019 & 2032
- Table 35: Argentina Internet of Vehicle Industry Revenue (Million) Forecast, by Application 2019 & 2032
- Table 36: Peru Internet of Vehicle Industry Revenue (Million) Forecast, by Application 2019 & 2032
- Table 37: Chile Internet of Vehicle Industry Revenue (Million) Forecast, by Application 2019 & 2032
- Table 38: Colombia Internet of Vehicle Industry Revenue (Million) Forecast, by Application 2019 & 2032
- Table 39: Ecuador Internet of Vehicle Industry Revenue (Million) Forecast, by Application 2019 & 2032
- Table 40: Venezuela Internet of Vehicle Industry Revenue (Million) Forecast, by Application 2019 & 2032
- Table 41: Rest of South America Internet of Vehicle Industry Revenue (Million) Forecast, by Application 2019 & 2032
- Table 42: Global Internet of Vehicle Industry Revenue Million Forecast, by Country 2019 & 2032
- Table 43: United States Internet of Vehicle Industry Revenue (Million) Forecast, by Application 2019 & 2032
- Table 44: Canada Internet of Vehicle Industry Revenue (Million) Forecast, by Application 2019 & 2032
- Table 45: Mexico Internet of Vehicle Industry Revenue (Million) Forecast, by Application 2019 & 2032
- Table 46: Global Internet of Vehicle Industry Revenue Million Forecast, by Country 2019 & 2032
- Table 47: United Arab Emirates Internet of Vehicle Industry Revenue (Million) Forecast, by Application 2019 & 2032
- Table 48: Saudi Arabia Internet of Vehicle Industry Revenue (Million) Forecast, by Application 2019 & 2032
- Table 49: South Africa Internet of Vehicle Industry Revenue (Million) Forecast, by Application 2019 & 2032
- Table 50: Rest of Middle East and Africa Internet of Vehicle Industry Revenue (Million) Forecast, by Application 2019 & 2032
- Table 51: Global Internet of Vehicle Industry Revenue Million Forecast, by Software Solutions 2019 & 2032
- Table 52: Global Internet of Vehicle Industry Revenue Million Forecast, by Applications 2019 & 2032
- Table 53: Global Internet of Vehicle Industry Revenue Million Forecast, by End-user Industry 2019 & 2032
- Table 54: Global Internet of Vehicle Industry Revenue Million Forecast, by Country 2019 & 2032
- Table 55: Global Internet of Vehicle Industry Revenue Million Forecast, by Software Solutions 2019 & 2032
- Table 56: Global Internet of Vehicle Industry Revenue Million Forecast, by Applications 2019 & 2032
- Table 57: Global Internet of Vehicle Industry Revenue Million Forecast, by End-user Industry 2019 & 2032
- Table 58: Global Internet of Vehicle Industry Revenue Million Forecast, by Country 2019 & 2032
- Table 59: Global Internet of Vehicle Industry Revenue Million Forecast, by Software Solutions 2019 & 2032
- Table 60: Global Internet of Vehicle Industry Revenue Million Forecast, by Applications 2019 & 2032
- Table 61: Global Internet of Vehicle Industry Revenue Million Forecast, by End-user Industry 2019 & 2032
- Table 62: Global Internet of Vehicle Industry Revenue Million Forecast, by Country 2019 & 2032
- Table 63: Global Internet of Vehicle Industry Revenue Million Forecast, by Software Solutions 2019 & 2032
- Table 64: Global Internet of Vehicle Industry Revenue Million Forecast, by Applications 2019 & 2032
- Table 65: Global Internet of Vehicle Industry Revenue Million Forecast, by End-user Industry 2019 & 2032
- Table 66: Global Internet of Vehicle Industry Revenue Million Forecast, by Country 2019 & 2032
Frequently Asked Questions
1. What is the projected Compound Annual Growth Rate (CAGR) of the Internet of Vehicle Industry?
The projected CAGR is approximately 16.38%.
2. Which companies are prominent players in the Internet of Vehicle Industry?
Key companies in the market include Infineon Technologies AG, IBM Corporation, Symantec Corporation, Bosch Software Innovations GmbH, Cisco Systems Inc, Microsoft Corporation, Tesla Motors Inc, Waymo LLC (Alphabet Inc ), Oracle Corporation, General Electric Company, SAP SE.
3. What are the main segments of the Internet of Vehicle Industry?
The market segments include Software Solutions, Applications, End-user Industry.
4. Can you provide details about the market size?
The market size is estimated to be USD 161.51 Million as of 2022.
5. What are some drivers contributing to market growth?
Increased Government Funding and Investments in Connected Transport System; Growing Demand for Smart Applications in Cars.
6. What are the notable trends driving market growth?
Automotive Sector to Witness the Growth.
7. Are there any restraints impacting market growth?
Slower Rate of Penetration of Connected Systems across the Developing Economies; High Initial Cost of Smart Transportation System.
8. Can you provide examples of recent developments in the market?
February 2023 - Cisco Systems, Inc has announced it is working with Mercedes-Benz to provide an optimal mobile office experience in its new Mercedes-Benz E Class vehicles. Where the partnership will help people get work done safely, securely, and comfortably in their cars, with the modern luxury and intuitive features that Mercedes-Benz and Webex customers are accustomed to
9. What pricing options are available for accessing the report?
Pricing options include single-user, multi-user, and enterprise licenses priced at USD 4750, USD 5250, and USD 8750 respectively.
10. Is the market size provided in terms of value or volume?
The market size is provided in terms of value, measured in Million.
11. Are there any specific market keywords associated with the report?
Yes, the market keyword associated with the report is "Internet of Vehicle Industry," which aids in identifying and referencing the specific market segment covered.
12. How do I determine which pricing option suits my needs best?
The pricing options vary based on user requirements and access needs. Individual users may opt for single-user licenses, while businesses requiring broader access may choose multi-user or enterprise licenses for cost-effective access to the report.
13. Are there any additional resources or data provided in the Internet of Vehicle Industry report?
While the report offers comprehensive insights, it's advisable to review the specific contents or supplementary materials provided to ascertain if additional resources or data are available.
14. How can I stay updated on further developments or reports in the Internet of Vehicle Industry?
To stay informed about further developments, trends, and reports in the Internet of Vehicle Industry, consider subscribing to industry newsletters, following relevant companies and organizations, or regularly checking reputable industry news sources and publications.
Methodology
Step 1 - Identification of Relevant Samples Size from Population Database


Step 2 - Approaches for Defining Global Market Size (Value, Volume* & Price*)

Note*: In applicable scenarios
Step 3 - Data Sources
Primary Research
- Web Analytics
- Survey Reports
- Research Institute
- Latest Research Reports
- Opinion Leaders
Secondary Research
- Annual Reports
- White Paper
- Latest Press Release
- Industry Association
- Paid Database
- Investor Presentations

Step 4 - Data Triangulation
Involves using different sources of information in order to increase the validity of a study
These sources are likely to be stakeholders in a program - participants, other researchers, program staff, other community members, and so on.
Then we put all data in single framework & apply various statistical tools to find out the dynamic on the market.
During the analysis stage, feedback from the stakeholder groups would be compared to determine areas of agreement as well as areas of divergence


