
Key Insights
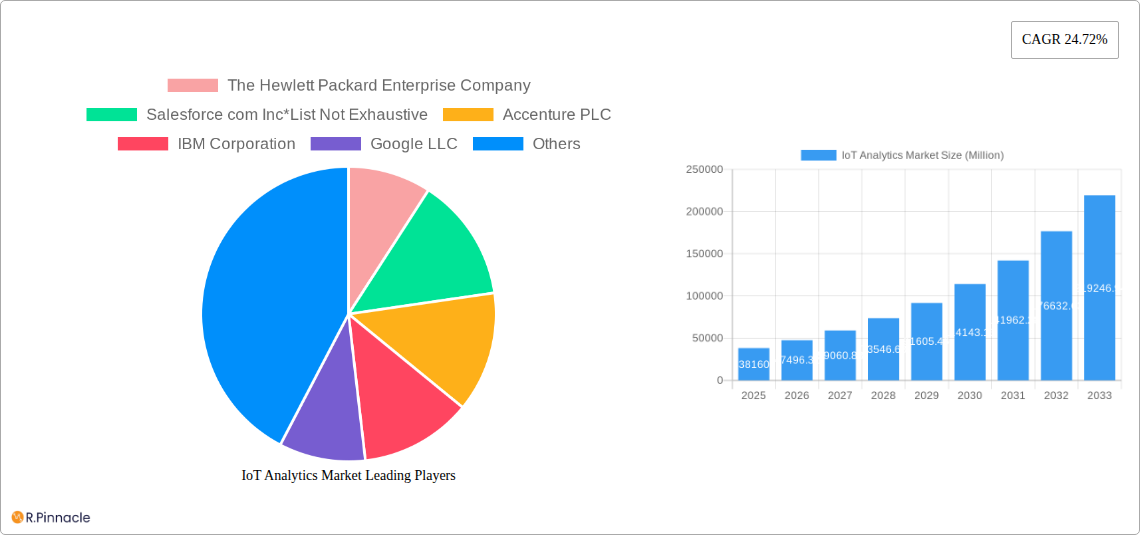
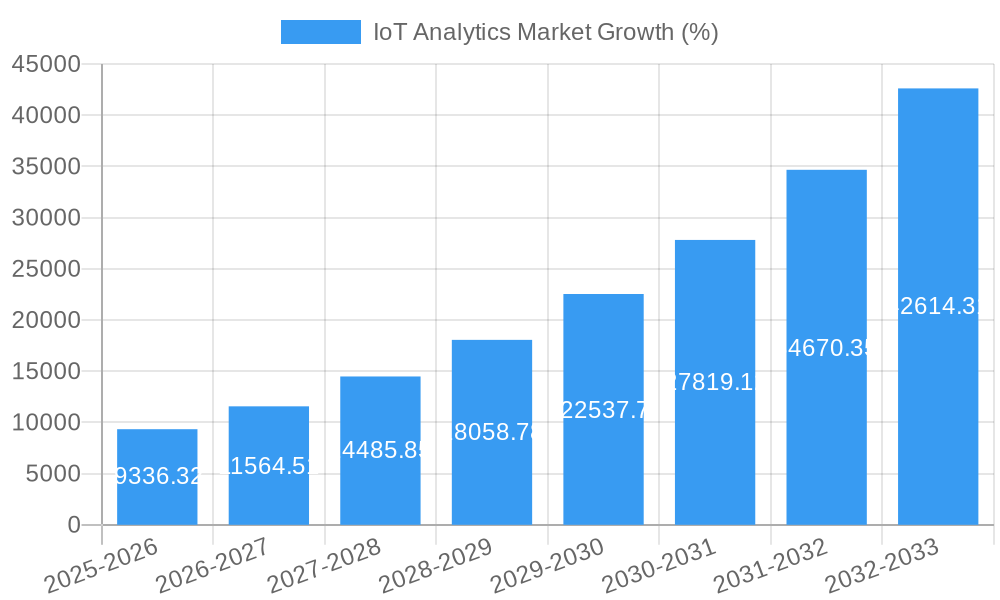
The Internet of Things (IoT) Analytics market is experiencing robust growth, projected to reach \$38.16 billion in 2025 and maintain a Compound Annual Growth Rate (CAGR) of 24.72% from 2025 to 2033. This expansion is fueled by several key factors. The increasing adoption of IoT devices across various sectors—including energy & utilities, BFSI (Banking, Financial Services, and Insurance), retail, manufacturing, and healthcare—is generating massive amounts of data requiring sophisticated analytics for actionable insights. Furthermore, advancements in cloud computing, big data technologies, and artificial intelligence (AI) are enabling more efficient and effective data processing and analysis, leading to improved operational efficiency, predictive maintenance, enhanced customer experience, and optimized resource allocation. The shift towards cloud-based IoT analytics solutions is also a significant driver, offering scalability, flexibility, and cost-effectiveness compared to on-premise deployments. Competitive pressures are driving companies to invest in analytics to gain a competitive edge by optimizing processes and improving decision-making.
However, challenges remain. Data security and privacy concerns continue to be a major restraint, especially with the increasing amount of sensitive data collected by IoT devices. The complexity of integrating IoT data from diverse sources and the need for skilled professionals to manage and interpret this data present hurdles for many organizations. Despite these challenges, the long-term growth trajectory of the IoT Analytics market remains highly positive, driven by sustained technological innovation and increasing demand for data-driven decision-making across various industries. The market is segmented by solution type (software and hardware), deployment model (on-premise and cloud), and end-user vertical, providing opportunities for specialized solutions tailored to specific industry needs. Major players like Hewlett Packard Enterprise, Salesforce, Accenture, IBM, Google, and others are actively shaping the market landscape through innovation and strategic partnerships.
IoT Analytics Market Report: 2019-2033 Forecast
This comprehensive report provides an in-depth analysis of the IoT Analytics Market, offering actionable insights for industry professionals and strategic decision-makers. Covering the period from 2019 to 2033, with a focus on 2025, this report meticulously examines market dynamics, segmentation, key players, and future growth potential. The report leverages robust data and expert analysis to provide a clear picture of this rapidly evolving market.
IoT Analytics Market Structure & Innovation Trends
This section analyzes the competitive landscape of the IoT Analytics market, exploring market concentration, innovation drivers, regulatory frameworks, and M&A activities. The analysis encompasses the period from 2019 to 2024, providing a historical context for understanding current market dynamics.
Market Concentration: The market exhibits a moderately concentrated structure, with a handful of major players holding significant market share. Precise market share figures for each player are unavailable but are estimated at xx% for the top 5 players, with the remaining xx% divided amongst numerous smaller players. This concentration is likely to remain relatively stable in the short term, with the potential for consolidation through mergers and acquisitions (M&A) activity.
Innovation Drivers: The rapid advancement of AI, machine learning, and big data technologies is a key driver for innovation in IoT analytics. The increasing demand for real-time data insights across diverse industry verticals is further stimulating innovative product and service offerings.
Regulatory Frameworks: Government regulations regarding data privacy and security are increasingly influencing the IoT analytics market. Compliance with regulations like GDPR and CCPA is a significant factor for market participants.
Product Substitutes: While there aren't direct substitutes for IoT analytics solutions, alternative data analysis techniques could be considered substitutes to a certain extent, albeit with reduced effectiveness in IoT-specific use cases.
End-User Demographics: The end-user base spans various sectors, including Energy & Utility, BFSI, Retail, Manufacturing, Healthcare, and IT & Telecom, with significant growth expected across all segments.
M&A Activities: The IoT analytics market has witnessed considerable M&A activity in recent years, with deal values totaling an estimated xx Million in the period 2019-2024. These activities aim to strengthen market positions, expand product portfolios, and acquire specialized expertise.
IoT Analytics Market Dynamics & Trends
This section delves into the key market growth drivers, technological disruptions, consumer preferences, and competitive dynamics influencing the IoT analytics market. The analysis uses data from the historical period (2019-2024) and extends to the forecast period (2025-2033).
The market exhibits a strong growth trajectory, driven by the increasing adoption of IoT devices and the need for sophisticated data analytics to extract valuable insights. The compound annual growth rate (CAGR) is projected at xx% during the forecast period. Key factors driving growth include the rising demand for improved operational efficiency, predictive maintenance, and data-driven decision-making across various industries. Technological disruptions, such as the advancement of edge computing and AI-powered analytics, are further accelerating market expansion. Market penetration is expected to increase significantly, particularly in developing economies, as the cost of IoT solutions declines and digital transformation initiatives gather momentum. Consumer preferences are shifting towards cloud-based IoT analytics solutions due to their scalability, cost-effectiveness, and accessibility. Competitive dynamics are characterized by intense rivalry among established players and emerging entrants.
Dominant Regions & Segments in IoT Analytics Market
This section identifies the leading regions and segments within the IoT analytics market, providing insights into their performance and growth drivers.
By Type:
- Solutions: The solutions segment holds the largest market share, driven by the increasing demand for advanced analytics tools and platforms.
- Services: The services segment is experiencing strong growth, fueled by the rising need for professional expertise in implementing and managing IoT analytics solutions.
By Deployment:
- Cloud: The cloud deployment model dominates the market, driven by its scalability, flexibility, and cost-effectiveness.
- On-premise: The on-premise deployment model retains a significant market share, particularly in sectors with stringent data security requirements.
By End-User Vertical:
- Manufacturing: The manufacturing sector is a leading adopter of IoT analytics solutions, leveraging them for predictive maintenance, quality control, and supply chain optimization.
- Energy & Utility: The energy and utility sector is witnessing strong growth in IoT analytics adoption, driven by the need for enhanced grid management, smart metering, and renewable energy integration. Key drivers include government policies supporting smart grid development and the increasing penetration of renewable energy sources.
- BFSI: The BFSI sector is adopting IoT analytics for fraud detection, risk management, and customer service improvements.
- Retail: The retail sector leverages IoT analytics to enhance customer experience, optimize supply chain efficiency, and personalize marketing efforts.
- Healthcare: The healthcare sector is embracing IoT analytics for remote patient monitoring, improved diagnosis, and enhanced healthcare delivery.
Other verticals, including IT & Telecom and Transportation, are also witnessing significant growth in IoT analytics adoption, driven by their respective industry needs.
IoT Analytics Market Product Innovations
Recent advancements in IoT analytics have centered on the integration of AI and machine learning capabilities to enhance data processing, analysis, and insights generation. This has resulted in more sophisticated predictive models and improved decision-making support. New products are focused on ease of use, reducing the technical expertise required for implementation and management. This trend is driving broader adoption across various industry verticals. The market is also witnessing the rise of edge analytics solutions, addressing the challenges of data latency and bandwidth limitations in remote locations.
Report Scope & Segmentation Analysis
This report segments the IoT analytics market by type (solutions and services), deployment (on-premise and cloud), and end-user vertical (energy & utility, BFSI, retail, manufacturing, healthcare, and others). Each segment's market size, growth projections, and competitive dynamics are analyzed in detail. For example, the cloud deployment segment is projected to witness significant growth due to its scalability and cost-effectiveness. Within the manufacturing sector, the demand for predictive maintenance solutions is expected to drive market expansion.
Key Drivers of IoT Analytics Market Growth
The IoT analytics market is driven by several key factors, including:
- Technological advancements: The continuous development of AI, machine learning, and big data technologies is enhancing the capabilities of IoT analytics platforms.
- Increasing adoption of IoT devices: The proliferation of connected devices across various industries is generating massive amounts of data, necessitating advanced analytics solutions.
- Demand for improved operational efficiency: Businesses are increasingly looking to leverage IoT analytics to optimize their operations and reduce costs.
- Government initiatives and regulations: Regulatory frameworks promoting data-driven decision-making and digital transformation are stimulating market growth.
Challenges in the IoT Analytics Market Sector
Despite the significant growth potential, the IoT analytics market faces several challenges:
- Data security and privacy concerns: The increasing volume and sensitivity of data collected through IoT devices raise concerns about security breaches and privacy violations.
- Lack of skilled professionals: The shortage of professionals with expertise in IoT analytics hinders market adoption and implementation.
- High initial investment costs: The cost of implementing IoT analytics solutions can be prohibitive for some businesses.
- Data integration complexities: Integrating data from multiple sources can be challenging and time-consuming.
Emerging Opportunities in IoT Analytics Market
The IoT analytics market presents numerous emerging opportunities, including:
- Growth in developing economies: Rapid digital transformation in developing countries is creating significant demand for IoT analytics solutions.
- Expansion into new industry verticals: The applicability of IoT analytics is expanding across various sectors, creating new market opportunities.
- Development of edge analytics solutions: Edge computing addresses the challenges of data latency and bandwidth limitations, unlocking new applications.
- Advancements in AI and machine learning: These technological advancements will further enhance the capabilities of IoT analytics platforms.
Leading Players in the IoT Analytics Market
- The Hewlett Packard Enterprise Company
- Salesforce.com Inc
- Accenture PLC
- IBM Corporation
- Google LLC
- Teradata Corporation
- Cisco Systems Inc
- Microsoft Corporation
- Amazon Web Services Inc
- Oracle Corporation
- Dell Technologies Inc
- SAP SE
Key Developments in IoT Analytics Market Industry
October 2022: KTD SYNNEX launched Data-IoTSolv in the Americas, offering partners tools to leverage IoT and data analytics for business growth. This significantly expands the reach of IoT analytics solutions to a wider partner network.
May 2022: Kajeet launched Sentinel Insights, a cloud-based data analytics product enhancing its IoT management platform. This improved platform offers a more robust and user-friendly analytics experience, potentially boosting market adoption.
Future Outlook for IoT Analytics Market
The future of the IoT analytics market appears promising, with significant growth potential driven by technological advancements, increasing adoption across various sectors, and government support for digital transformation initiatives. The market is poised to benefit from further integration of AI and machine learning, leading to more sophisticated and insightful analytics solutions. Strategic partnerships and mergers and acquisitions will continue to shape the competitive landscape.
IoT Analytics Market Segmentation
-
1. Type
- 1.1. Solution
- 1.2. Services
-
2. Deployment
- 2.1. On-premise
- 2.2. Cloud
-
3. End-User Vertical
- 3.1. Energy & Utility
- 3.2. BFSI
- 3.3. Retail
- 3.4. Manufacturing
- 3.5. Healthcare
- 3.6. Other En
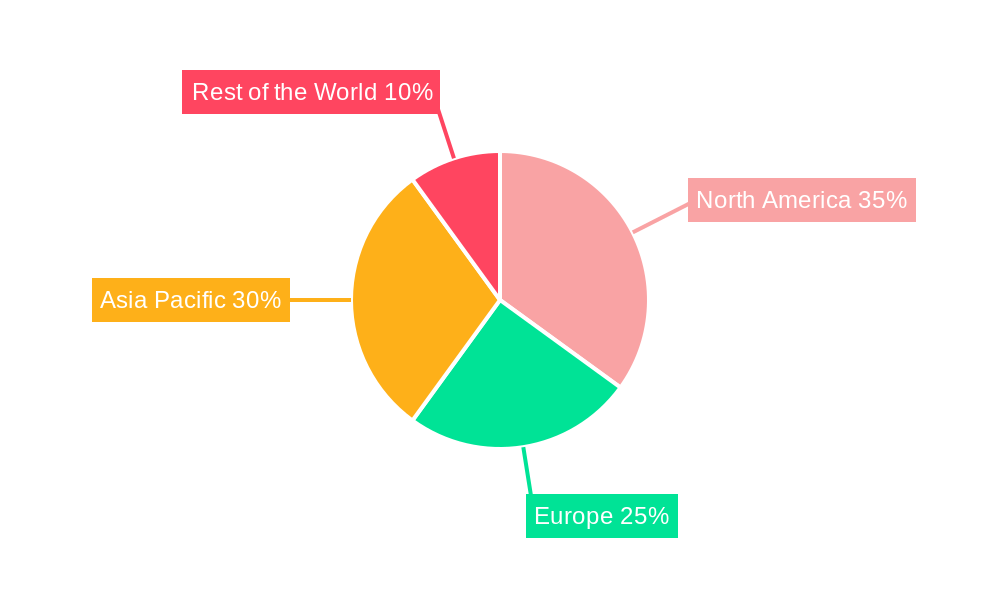
IoT Analytics Market Segmentation By Geography
- 1. North America
- 2. Europe
- 3. Asia Pacific
- 4. Rest of the World
IoT Analytics Market REPORT HIGHLIGHTS
| Aspects | Details |
|---|---|
| Study Period | 2019-2033 |
| Base Year | 2024 |
| Estimated Year | 2025 |
| Forecast Period | 2025-2033 |
| Historical Period | 2019-2024 |
| Growth Rate | CAGR of 24.72% from 2019-2033 |
| Segmentation |
|
Table of Contents
- 1. Introduction
- 1.1. Research Scope
- 1.2. Market Segmentation
- 1.3. Research Methodology
- 1.4. Definitions and Assumptions
- 2. Executive Summary
- 2.1. Introduction
- 3. Market Dynamics
- 3.1. Introduction
- 3.2. Market Drivers
- 3.2.1. Increasing Volume of IoT Data; Emergence of Connected Cars and Smart Cities
- 3.3. Market Restrains
- 3.3.1. Concerns Associated with Data Privacy and Security
- 3.4. Market Trends
- 3.4.1. Healthcare is Expected to Witness Significant Growth
- 4. Market Factor Analysis
- 4.1. Porters Five Forces
- 4.2. Supply/Value Chain
- 4.3. PESTEL analysis
- 4.4. Market Entropy
- 4.5. Patent/Trademark Analysis
- 5. Global IoT Analytics Market Analysis, Insights and Forecast, 2019-2031
- 5.1. Market Analysis, Insights and Forecast - by Type
- 5.1.1. Solution
- 5.1.2. Services
- 5.2. Market Analysis, Insights and Forecast - by Deployment
- 5.2.1. On-premise
- 5.2.2. Cloud
- 5.3. Market Analysis, Insights and Forecast - by End-User Vertical
- 5.3.1. Energy & Utility
- 5.3.2. BFSI
- 5.3.3. Retail
- 5.3.4. Manufacturing
- 5.3.5. Healthcare
- 5.3.6. Other En
- 5.4. Market Analysis, Insights and Forecast - by Region
- 5.4.1. North America
- 5.4.2. Europe
- 5.4.3. Asia Pacific
- 5.4.4. Rest of the World
- 5.1. Market Analysis, Insights and Forecast - by Type
- 6. North America IoT Analytics Market Analysis, Insights and Forecast, 2019-2031
- 6.1. Market Analysis, Insights and Forecast - by Type
- 6.1.1. Solution
- 6.1.2. Services
- 6.2. Market Analysis, Insights and Forecast - by Deployment
- 6.2.1. On-premise
- 6.2.2. Cloud
- 6.3. Market Analysis, Insights and Forecast - by End-User Vertical
- 6.3.1. Energy & Utility
- 6.3.2. BFSI
- 6.3.3. Retail
- 6.3.4. Manufacturing
- 6.3.5. Healthcare
- 6.3.6. Other En
- 6.1. Market Analysis, Insights and Forecast - by Type
- 7. Europe IoT Analytics Market Analysis, Insights and Forecast, 2019-2031
- 7.1. Market Analysis, Insights and Forecast - by Type
- 7.1.1. Solution
- 7.1.2. Services
- 7.2. Market Analysis, Insights and Forecast - by Deployment
- 7.2.1. On-premise
- 7.2.2. Cloud
- 7.3. Market Analysis, Insights and Forecast - by End-User Vertical
- 7.3.1. Energy & Utility
- 7.3.2. BFSI
- 7.3.3. Retail
- 7.3.4. Manufacturing
- 7.3.5. Healthcare
- 7.3.6. Other En
- 7.1. Market Analysis, Insights and Forecast - by Type
- 8. Asia Pacific IoT Analytics Market Analysis, Insights and Forecast, 2019-2031
- 8.1. Market Analysis, Insights and Forecast - by Type
- 8.1.1. Solution
- 8.1.2. Services
- 8.2. Market Analysis, Insights and Forecast - by Deployment
- 8.2.1. On-premise
- 8.2.2. Cloud
- 8.3. Market Analysis, Insights and Forecast - by End-User Vertical
- 8.3.1. Energy & Utility
- 8.3.2. BFSI
- 8.3.3. Retail
- 8.3.4. Manufacturing
- 8.3.5. Healthcare
- 8.3.6. Other En
- 8.1. Market Analysis, Insights and Forecast - by Type
- 9. Rest of the World IoT Analytics Market Analysis, Insights and Forecast, 2019-2031
- 9.1. Market Analysis, Insights and Forecast - by Type
- 9.1.1. Solution
- 9.1.2. Services
- 9.2. Market Analysis, Insights and Forecast - by Deployment
- 9.2.1. On-premise
- 9.2.2. Cloud
- 9.3. Market Analysis, Insights and Forecast - by End-User Vertical
- 9.3.1. Energy & Utility
- 9.3.2. BFSI
- 9.3.3. Retail
- 9.3.4. Manufacturing
- 9.3.5. Healthcare
- 9.3.6. Other En
- 9.1. Market Analysis, Insights and Forecast - by Type
- 10. North America IoT Analytics Market Analysis, Insights and Forecast, 2019-2031
- 10.1. Market Analysis, Insights and Forecast - By Country/Sub-region
- 10.1.1.
- 11. Europe IoT Analytics Market Analysis, Insights and Forecast, 2019-2031
- 11.1. Market Analysis, Insights and Forecast - By Country/Sub-region
- 11.1.1.
- 12. Asia Pacific IoT Analytics Market Analysis, Insights and Forecast, 2019-2031
- 12.1. Market Analysis, Insights and Forecast - By Country/Sub-region
- 12.1.1.
- 13. Rest of the World IoT Analytics Market Analysis, Insights and Forecast, 2019-2031
- 13.1. Market Analysis, Insights and Forecast - By Country/Sub-region
- 13.1.1.
- 14. Competitive Analysis
- 14.1. Global Market Share Analysis 2024
- 14.2. Company Profiles
- 14.2.1 The Hewlett Packard Enterprise Company
- 14.2.1.1. Overview
- 14.2.1.2. Products
- 14.2.1.3. SWOT Analysis
- 14.2.1.4. Recent Developments
- 14.2.1.5. Financials (Based on Availability)
- 14.2.2 Salesforce com Inc*List Not Exhaustive
- 14.2.2.1. Overview
- 14.2.2.2. Products
- 14.2.2.3. SWOT Analysis
- 14.2.2.4. Recent Developments
- 14.2.2.5. Financials (Based on Availability)
- 14.2.3 Accenture PLC
- 14.2.3.1. Overview
- 14.2.3.2. Products
- 14.2.3.3. SWOT Analysis
- 14.2.3.4. Recent Developments
- 14.2.3.5. Financials (Based on Availability)
- 14.2.4 IBM Corporation
- 14.2.4.1. Overview
- 14.2.4.2. Products
- 14.2.4.3. SWOT Analysis
- 14.2.4.4. Recent Developments
- 14.2.4.5. Financials (Based on Availability)
- 14.2.5 Google LLC
- 14.2.5.1. Overview
- 14.2.5.2. Products
- 14.2.5.3. SWOT Analysis
- 14.2.5.4. Recent Developments
- 14.2.5.5. Financials (Based on Availability)
- 14.2.6 Teradata Corporation
- 14.2.6.1. Overview
- 14.2.6.2. Products
- 14.2.6.3. SWOT Analysis
- 14.2.6.4. Recent Developments
- 14.2.6.5. Financials (Based on Availability)
- 14.2.7 Cisco Systems Inc
- 14.2.7.1. Overview
- 14.2.7.2. Products
- 14.2.7.3. SWOT Analysis
- 14.2.7.4. Recent Developments
- 14.2.7.5. Financials (Based on Availability)
- 14.2.8 Microsoft Corporation
- 14.2.8.1. Overview
- 14.2.8.2. Products
- 14.2.8.3. SWOT Analysis
- 14.2.8.4. Recent Developments
- 14.2.8.5. Financials (Based on Availability)
- 14.2.9 Amazon Web Services Inc
- 14.2.9.1. Overview
- 14.2.9.2. Products
- 14.2.9.3. SWOT Analysis
- 14.2.9.4. Recent Developments
- 14.2.9.5. Financials (Based on Availability)
- 14.2.10 Oracle Corporation
- 14.2.10.1. Overview
- 14.2.10.2. Products
- 14.2.10.3. SWOT Analysis
- 14.2.10.4. Recent Developments
- 14.2.10.5. Financials (Based on Availability)
- 14.2.11 Dell Technologies Inc
- 14.2.11.1. Overview
- 14.2.11.2. Products
- 14.2.11.3. SWOT Analysis
- 14.2.11.4. Recent Developments
- 14.2.11.5. Financials (Based on Availability)
- 14.2.12 SAP SE
- 14.2.12.1. Overview
- 14.2.12.2. Products
- 14.2.12.3. SWOT Analysis
- 14.2.12.4. Recent Developments
- 14.2.12.5. Financials (Based on Availability)
- 14.2.1 The Hewlett Packard Enterprise Company
List of Figures
- Figure 1: Global IoT Analytics Market Revenue Breakdown (Million, %) by Region 2024 & 2032
- Figure 2: North America IoT Analytics Market Revenue (Million), by Country 2024 & 2032
- Figure 3: North America IoT Analytics Market Revenue Share (%), by Country 2024 & 2032
- Figure 4: Europe IoT Analytics Market Revenue (Million), by Country 2024 & 2032
- Figure 5: Europe IoT Analytics Market Revenue Share (%), by Country 2024 & 2032
- Figure 6: Asia Pacific IoT Analytics Market Revenue (Million), by Country 2024 & 2032
- Figure 7: Asia Pacific IoT Analytics Market Revenue Share (%), by Country 2024 & 2032
- Figure 8: Rest of the World IoT Analytics Market Revenue (Million), by Country 2024 & 2032
- Figure 9: Rest of the World IoT Analytics Market Revenue Share (%), by Country 2024 & 2032
- Figure 10: North America IoT Analytics Market Revenue (Million), by Type 2024 & 2032
- Figure 11: North America IoT Analytics Market Revenue Share (%), by Type 2024 & 2032
- Figure 12: North America IoT Analytics Market Revenue (Million), by Deployment 2024 & 2032
- Figure 13: North America IoT Analytics Market Revenue Share (%), by Deployment 2024 & 2032
- Figure 14: North America IoT Analytics Market Revenue (Million), by End-User Vertical 2024 & 2032
- Figure 15: North America IoT Analytics Market Revenue Share (%), by End-User Vertical 2024 & 2032
- Figure 16: North America IoT Analytics Market Revenue (Million), by Country 2024 & 2032
- Figure 17: North America IoT Analytics Market Revenue Share (%), by Country 2024 & 2032
- Figure 18: Europe IoT Analytics Market Revenue (Million), by Type 2024 & 2032
- Figure 19: Europe IoT Analytics Market Revenue Share (%), by Type 2024 & 2032
- Figure 20: Europe IoT Analytics Market Revenue (Million), by Deployment 2024 & 2032
- Figure 21: Europe IoT Analytics Market Revenue Share (%), by Deployment 2024 & 2032
- Figure 22: Europe IoT Analytics Market Revenue (Million), by End-User Vertical 2024 & 2032
- Figure 23: Europe IoT Analytics Market Revenue Share (%), by End-User Vertical 2024 & 2032
- Figure 24: Europe IoT Analytics Market Revenue (Million), by Country 2024 & 2032
- Figure 25: Europe IoT Analytics Market Revenue Share (%), by Country 2024 & 2032
- Figure 26: Asia Pacific IoT Analytics Market Revenue (Million), by Type 2024 & 2032
- Figure 27: Asia Pacific IoT Analytics Market Revenue Share (%), by Type 2024 & 2032
- Figure 28: Asia Pacific IoT Analytics Market Revenue (Million), by Deployment 2024 & 2032
- Figure 29: Asia Pacific IoT Analytics Market Revenue Share (%), by Deployment 2024 & 2032
- Figure 30: Asia Pacific IoT Analytics Market Revenue (Million), by End-User Vertical 2024 & 2032
- Figure 31: Asia Pacific IoT Analytics Market Revenue Share (%), by End-User Vertical 2024 & 2032
- Figure 32: Asia Pacific IoT Analytics Market Revenue (Million), by Country 2024 & 2032
- Figure 33: Asia Pacific IoT Analytics Market Revenue Share (%), by Country 2024 & 2032
- Figure 34: Rest of the World IoT Analytics Market Revenue (Million), by Type 2024 & 2032
- Figure 35: Rest of the World IoT Analytics Market Revenue Share (%), by Type 2024 & 2032
- Figure 36: Rest of the World IoT Analytics Market Revenue (Million), by Deployment 2024 & 2032
- Figure 37: Rest of the World IoT Analytics Market Revenue Share (%), by Deployment 2024 & 2032
- Figure 38: Rest of the World IoT Analytics Market Revenue (Million), by End-User Vertical 2024 & 2032
- Figure 39: Rest of the World IoT Analytics Market Revenue Share (%), by End-User Vertical 2024 & 2032
- Figure 40: Rest of the World IoT Analytics Market Revenue (Million), by Country 2024 & 2032
- Figure 41: Rest of the World IoT Analytics Market Revenue Share (%), by Country 2024 & 2032
List of Tables
- Table 1: Global IoT Analytics Market Revenue Million Forecast, by Region 2019 & 2032
- Table 2: Global IoT Analytics Market Revenue Million Forecast, by Type 2019 & 2032
- Table 3: Global IoT Analytics Market Revenue Million Forecast, by Deployment 2019 & 2032
- Table 4: Global IoT Analytics Market Revenue Million Forecast, by End-User Vertical 2019 & 2032
- Table 5: Global IoT Analytics Market Revenue Million Forecast, by Region 2019 & 2032
- Table 6: Global IoT Analytics Market Revenue Million Forecast, by Country 2019 & 2032
- Table 7: IoT Analytics Market Revenue (Million) Forecast, by Application 2019 & 2032
- Table 8: Global IoT Analytics Market Revenue Million Forecast, by Country 2019 & 2032
- Table 9: IoT Analytics Market Revenue (Million) Forecast, by Application 2019 & 2032
- Table 10: Global IoT Analytics Market Revenue Million Forecast, by Country 2019 & 2032
- Table 11: IoT Analytics Market Revenue (Million) Forecast, by Application 2019 & 2032
- Table 12: Global IoT Analytics Market Revenue Million Forecast, by Country 2019 & 2032
- Table 13: IoT Analytics Market Revenue (Million) Forecast, by Application 2019 & 2032
- Table 14: Global IoT Analytics Market Revenue Million Forecast, by Type 2019 & 2032
- Table 15: Global IoT Analytics Market Revenue Million Forecast, by Deployment 2019 & 2032
- Table 16: Global IoT Analytics Market Revenue Million Forecast, by End-User Vertical 2019 & 2032
- Table 17: Global IoT Analytics Market Revenue Million Forecast, by Country 2019 & 2032
- Table 18: Global IoT Analytics Market Revenue Million Forecast, by Type 2019 & 2032
- Table 19: Global IoT Analytics Market Revenue Million Forecast, by Deployment 2019 & 2032
- Table 20: Global IoT Analytics Market Revenue Million Forecast, by End-User Vertical 2019 & 2032
- Table 21: Global IoT Analytics Market Revenue Million Forecast, by Country 2019 & 2032
- Table 22: Global IoT Analytics Market Revenue Million Forecast, by Type 2019 & 2032
- Table 23: Global IoT Analytics Market Revenue Million Forecast, by Deployment 2019 & 2032
- Table 24: Global IoT Analytics Market Revenue Million Forecast, by End-User Vertical 2019 & 2032
- Table 25: Global IoT Analytics Market Revenue Million Forecast, by Country 2019 & 2032
- Table 26: Global IoT Analytics Market Revenue Million Forecast, by Type 2019 & 2032
- Table 27: Global IoT Analytics Market Revenue Million Forecast, by Deployment 2019 & 2032
- Table 28: Global IoT Analytics Market Revenue Million Forecast, by End-User Vertical 2019 & 2032
- Table 29: Global IoT Analytics Market Revenue Million Forecast, by Country 2019 & 2032
Frequently Asked Questions
1. What is the projected Compound Annual Growth Rate (CAGR) of the IoT Analytics Market?
The projected CAGR is approximately 24.72%.
2. Which companies are prominent players in the IoT Analytics Market?
Key companies in the market include The Hewlett Packard Enterprise Company, Salesforce com Inc*List Not Exhaustive, Accenture PLC, IBM Corporation, Google LLC, Teradata Corporation, Cisco Systems Inc, Microsoft Corporation, Amazon Web Services Inc, Oracle Corporation, Dell Technologies Inc, SAP SE.
3. What are the main segments of the IoT Analytics Market?
The market segments include Type, Deployment, End-User Vertical.
4. Can you provide details about the market size?
The market size is estimated to be USD 38.16 Million as of 2022.
5. What are some drivers contributing to market growth?
Increasing Volume of IoT Data; Emergence of Connected Cars and Smart Cities.
6. What are the notable trends driving market growth?
Healthcare is Expected to Witness Significant Growth.
7. Are there any restraints impacting market growth?
Concerns Associated with Data Privacy and Security.
8. Can you provide examples of recent developments in the market?
October 2022 : KTD SYNNEX announced the launch of Data-IoTSolv in the Americas, a new set of solutions that offers partners the tools to leverage the Internet of Things (IoT) and data analytics to accelerate business growth. The Data-IneTSolv solution gives resellers access to the best technologies across the IoT edge continuum, from artificial intelligence (AI) to advanced analytics.
9. What pricing options are available for accessing the report?
Pricing options include single-user, multi-user, and enterprise licenses priced at USD 4750, USD 5250, and USD 8750 respectively.
10. Is the market size provided in terms of value or volume?
The market size is provided in terms of value, measured in Million.
11. Are there any specific market keywords associated with the report?
Yes, the market keyword associated with the report is "IoT Analytics Market," which aids in identifying and referencing the specific market segment covered.
12. How do I determine which pricing option suits my needs best?
The pricing options vary based on user requirements and access needs. Individual users may opt for single-user licenses, while businesses requiring broader access may choose multi-user or enterprise licenses for cost-effective access to the report.
13. Are there any additional resources or data provided in the IoT Analytics Market report?
While the report offers comprehensive insights, it's advisable to review the specific contents or supplementary materials provided to ascertain if additional resources or data are available.
14. How can I stay updated on further developments or reports in the IoT Analytics Market?
To stay informed about further developments, trends, and reports in the IoT Analytics Market, consider subscribing to industry newsletters, following relevant companies and organizations, or regularly checking reputable industry news sources and publications.
Methodology
Step 1 - Identification of Relevant Samples Size from Population Database


Step 2 - Approaches for Defining Global Market Size (Value, Volume* & Price*)

Note*: In applicable scenarios
Step 3 - Data Sources
Primary Research
- Web Analytics
- Survey Reports
- Research Institute
- Latest Research Reports
- Opinion Leaders
Secondary Research
- Annual Reports
- White Paper
- Latest Press Release
- Industry Association
- Paid Database
- Investor Presentations

Step 4 - Data Triangulation
Involves using different sources of information in order to increase the validity of a study
These sources are likely to be stakeholders in a program - participants, other researchers, program staff, other community members, and so on.
Then we put all data in single framework & apply various statistical tools to find out the dynamic on the market.
During the analysis stage, feedback from the stakeholder groups would be compared to determine areas of agreement as well as areas of divergence


