
Key Insights
The IT Robotic Process Automation (RPA) market is experiencing explosive growth, projected to reach \$4.02 billion in 2025 and exhibiting a remarkable Compound Annual Growth Rate (CAGR) of 29.70%. This expansion is fueled by several key factors. Firstly, the increasing need for operational efficiency and cost reduction across various industries is driving widespread adoption. Businesses are leveraging RPA to automate repetitive, rule-based tasks, freeing human employees for more strategic initiatives. Secondly, advancements in artificial intelligence (AI) and machine learning (ML) are enhancing RPA capabilities, allowing for more complex automation scenarios and improved accuracy. This includes the rise of intelligent automation (IA), combining RPA with AI for more sophisticated workflows. Thirdly, the shift towards cloud-based deployments offers scalability, flexibility, and reduced infrastructure costs, further accelerating market growth. The market is segmented by solution (software and services), enterprise size (SMEs and large enterprises), end-user industry (IT & Telecom, BFSI, Healthcare, Retail, Manufacturing, and others), and deployment (on-premise and cloud). Software solutions currently dominate the market, but services are witnessing faster growth due to increasing demand for implementation, integration, and maintenance support. Large enterprises are the primary adopters, but SMEs are rapidly increasing their adoption rates due to the availability of affordable and scalable solutions. Geographically, North America and Europe currently hold the largest market share, but Asia-Pacific is poised for significant growth, driven by increasing digitalization and technological advancements in countries like China and India. Competitive landscape is intense with established players like UiPath, Automation Anywhere, and Blue Prism alongside several niche players offering specialized solutions.
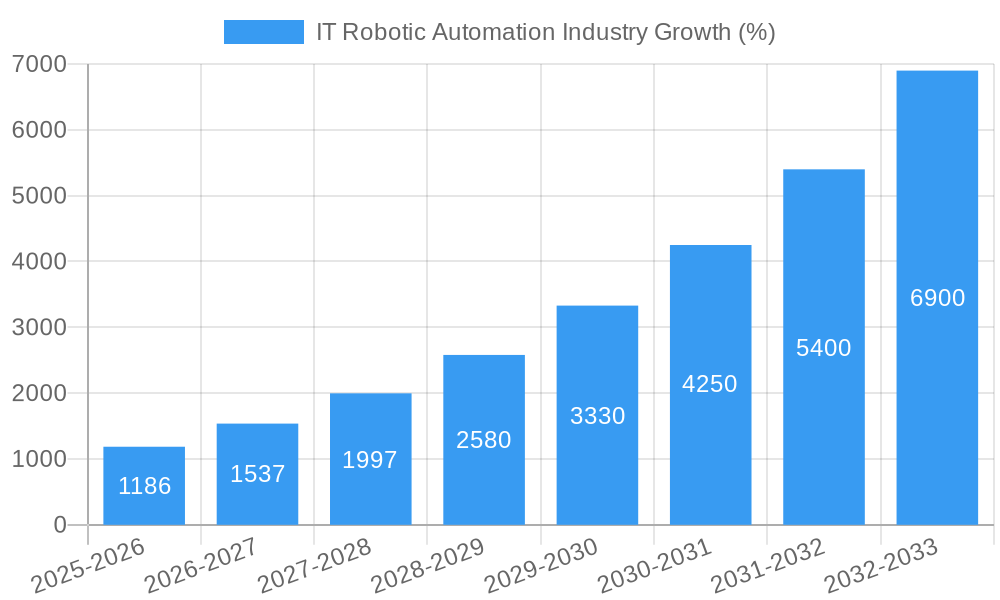
The sustained growth in the IT RPA market is expected to continue through 2033, driven by factors such as the increasing volume of data requiring processing, the growing need for improved customer experience through faster service delivery, and the expanding adoption of digital transformation strategies across industries. However, challenges such as integration complexities, security concerns, and the need for skilled professionals to implement and manage RPA solutions could potentially restrain market growth to some extent. Nevertheless, the overall outlook remains highly positive, with continuous innovation and evolving applications of RPA technology promising further market expansion across various sectors and geographical regions. The increasing focus on hyperautomation, which combines RPA with other technologies like business process management (BPM) and AI, represents a major future trend impacting the market dynamics.
IT Robotic Automation Industry Market Report: 2019-2033
This comprehensive report provides an in-depth analysis of the IT Robotic Automation industry, projecting a market size exceeding $XX Million by 2033. The study covers the period from 2019 to 2033, with 2025 serving as the base and estimated year. It offers actionable insights for industry professionals, investors, and stakeholders seeking to understand the market's dynamics, growth drivers, and future prospects. The report analyzes key segments, including software and service solutions, across various enterprise sizes and end-user industries. Leading players like UiPath, Automation Anywhere, and Blue Prism are profiled, alongside emerging competitors. Download now for a competitive advantage.
IT Robotic Automation Industry Market Structure & Innovation Trends
The IT Robotic Automation market exhibits a moderately concentrated structure, with key players such as UiPath, Automation Anywhere, and Blue Prism holding significant market share. However, the presence of numerous smaller, specialized firms fosters innovation and competition. Market share distribution among the top 5 players is estimated at xx%, while the remaining xx% is spread across numerous players. Recent years have witnessed increased M&A activity, with deals such as Thoma Bravo's acquisition of Kofax and HGGC's acquisition of HelpSystems valuing at $XX Million and $XX Million respectively, reflecting industry consolidation and the pursuit of expansion. These activities aim to enhance technological capabilities and broaden market reach.
Innovation is driven by advancements in artificial intelligence (AI), machine learning (ML), and cloud computing. Regulatory frameworks, while generally supportive of automation, vary across geographies, influencing market growth and adoption rates. The primary product substitute is manual labor, but robotic automation's efficiency and cost-effectiveness offer a compelling value proposition. The end-user demographic is expanding beyond large enterprises to encompass SMEs seeking operational efficiency.
IT Robotic Automation Industry Market Dynamics & Trends
The IT Robotic Automation market is experiencing robust growth, driven by the increasing need for automation across various industries. The Compound Annual Growth Rate (CAGR) is projected at xx% during the forecast period (2025-2033). This growth is fueled by factors such as rising labor costs, the need for improved operational efficiency, and the increasing availability of sophisticated and user-friendly automation solutions. Technological disruptions, particularly advancements in AI and ML, are continually enhancing the capabilities of robotic automation systems, leading to increased market penetration. Consumer preferences are shifting towards cloud-based deployments due to their scalability, cost-effectiveness, and ease of maintenance. Competitive dynamics are characterized by continuous innovation, strategic partnerships, and mergers and acquisitions, all aimed at securing market share and expanding capabilities. Market penetration in the BFSI sector, for instance, is projected at xx% by 2033, reflecting the sector's high adoption rate.
Dominant Regions & Segments in IT Robotic Automation Industry
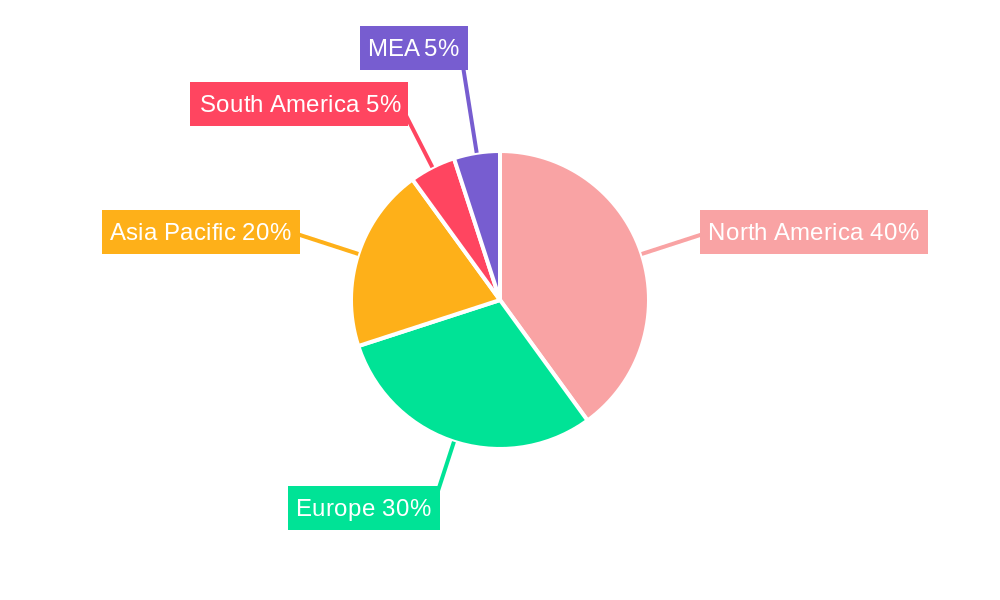
Leading Region: North America currently holds the largest market share, driven by early adoption of technology, robust IT infrastructure, and a large number of early adopters. Europe follows closely, with considerable growth potential in developing economies.
Dominant Segments:
- Solution: The software segment dominates due to its scalability, flexibility, and ability to integrate with existing systems. However, the service segment is exhibiting high growth, driven by the increasing demand for implementation, support, and maintenance services.
- Enterprise Size: Large enterprises currently account for a significant portion of the market, but SMEs are demonstrating rapid adoption rates due to the affordability and scalability of cloud-based solutions.
- End-User Industry: The IT and Telecom, BFSI, and Healthcare sectors lead in adoption, driven by their high operational complexities and the significant benefits derived from automation. However, Retail, Manufacturing, and other industries are showing significant growth potential.
- Deployment: Cloud deployment is gaining traction due to its inherent advantages, but on-premise deployments remain prevalent, particularly among enterprises with stringent data security and regulatory compliance requirements. Key drivers include government support for digital transformation, robust IT infrastructure, and the availability of skilled professionals in developed regions. Factors driving dominance include advanced technological adoption, strong economic growth, and favorable regulatory environments.
IT Robotic Automation Industry Product Innovations
Recent product developments focus on improving user experience, enhancing integration capabilities, and expanding functionalities. The trend leans toward AI-powered solutions that can handle more complex tasks and adapt to changing business needs. These innovations provide competitive advantages by offering greater efficiency, reduced operational costs, and improved accuracy. The market fit is strong, reflecting the industry's continuous pursuit of better automation capabilities.
Report Scope & Segmentation Analysis
This report segments the IT Robotic Automation market by solution (Software, Service), enterprise size (Small and Medium Enterprises, Large Enterprises), end-user industry (IT and Telecom, BFSI, Healthcare, Retail, Manufacturing, Other End User Industries), and deployment (On-premise, Cloud). Each segment's growth projections, market sizes, and competitive dynamics are analyzed in detail. The Software segment is projected to grow at xx% CAGR, while the Service segment is anticipated to grow at xx% CAGR. The Large Enterprise segment is currently larger but SMEs are showing higher growth rate. Similarly, the IT & Telecom and BFSI sectors lead in terms of market size, with robust growth predicted across all industry segments. The cloud deployment segment is predicted to witness faster growth.
Key Drivers of IT Robotic Automation Industry Growth
The IT Robotic Automation industry's growth is fueled by several key factors:
- Technological advancements: AI, ML, and cloud computing are constantly enhancing automation capabilities.
- Rising labor costs: Automation offers a cost-effective alternative to manual labor.
- Increased demand for efficiency: Businesses seek to streamline operations and improve productivity.
- Regulatory support: Government initiatives promoting digital transformation are fostering adoption.
Challenges in the IT Robotic Automation Industry Sector
The industry faces challenges such as:
- High initial investment costs: Implementing robotic automation solutions can require significant upfront investment.
- Skill gap: A shortage of skilled professionals to design, implement, and maintain automation systems is a barrier to entry.
- Security concerns: Data security and privacy are significant concerns, particularly with cloud-based deployments. The cumulative impact of these challenges is estimated to reduce market growth by approximately xx% by 2033.
Emerging Opportunities in IT Robotic Automation Industry
Emerging opportunities include:
- Expansion into new markets: Untapped potential exists in developing economies and emerging industries.
- Hyperautomation: Integrating various automation technologies to create comprehensive solutions.
- AI-powered RPA: Leveraging AI and ML to enhance decision-making and adaptability.
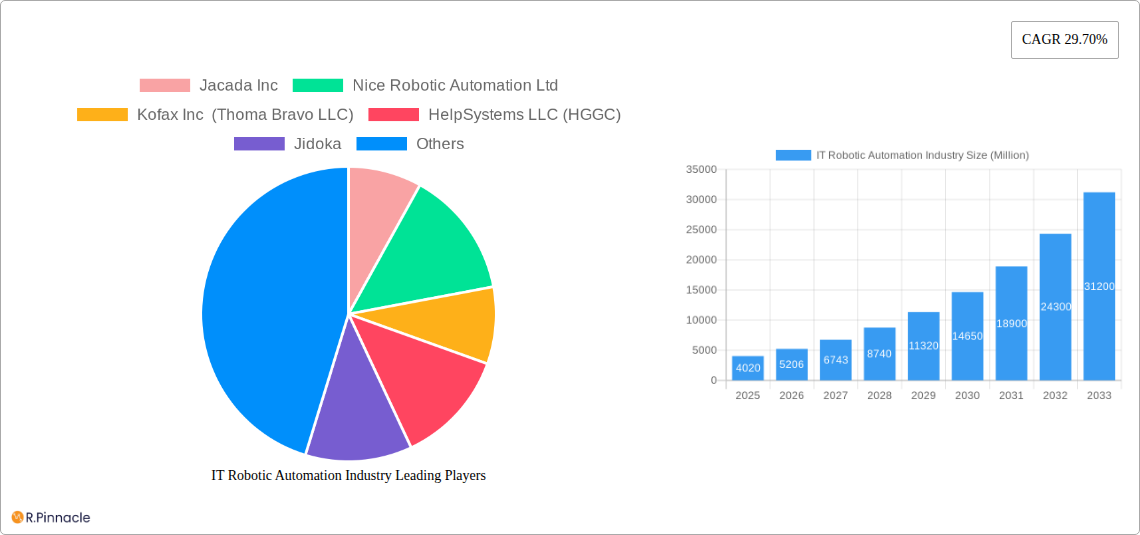
Leading Players in the IT Robotic Automation Industry Market
- Jacada Inc
- Nice Robotic Automation Ltd
- Kofax Inc (Thoma Bravo LLC)
- HelpSystems LLC (HGGC)
- Jidoka
- UIPath Inc
- Datamatics Global Services Limited
- Automation Anywhere Inc
- Be Informed BV (Hoogenberg Beheer BV)
- Pegasystems Inc
- AutomationEdge Technologies Inc
- Blue Prism Group PLC
- CGI Inc
Key Developments in IT Robotic Automation Industry Industry
- September 2022: UiPath and Snowflake launched a new bi-directional integration, enhancing automation capabilities.
- August 2022: Digital Workforce Services partnered with Keva, migrating RPA solutions to a cloud service.
Future Outlook for IT Robotic Automation Industry Market
The IT Robotic Automation market is poised for significant growth, driven by continuous technological advancements, increasing demand for efficiency, and expanding adoption across various industries. Strategic partnerships, mergers and acquisitions, and the development of AI-powered solutions will further shape the market landscape, creating opportunities for innovation and expansion. The market is expected to witness a sustained growth trajectory in the coming years, driven by the factors mentioned above.
IT Robotic Automation Industry Segmentation
-
1. Deployment
- 1.1. On-premise
- 1.2. Cloud
-
2. Solution
- 2.1. Software
- 2.2. Service
-
3. Size of Enterprise
- 3.1. Small and Medium Enterprises
- 3.2. Large Enterprises
-
4. End User Industry
- 4.1. IT and Telecom
- 4.2. BFSI
- 4.3. Healthcare
- 4.4. Retail
- 4.5. Manufacturing
- 4.6. Other End User Industries
IT Robotic Automation Industry Segmentation By Geography
- 1. North America
- 2. Europe
- 3. Asia Pacific
- 4. Latin America
- 5. Middle East and Africa
IT Robotic Automation Industry REPORT HIGHLIGHTS
| Aspects | Details |
|---|---|
| Study Period | 2019-2033 |
| Base Year | 2024 |
| Estimated Year | 2025 |
| Forecast Period | 2025-2033 |
| Historical Period | 2019-2024 |
| Growth Rate | CAGR of 29.70% from 2019-2033 |
| Segmentation |
|
Table of Contents
- 1. Introduction
- 1.1. Research Scope
- 1.2. Market Segmentation
- 1.3. Research Methodology
- 1.4. Definitions and Assumptions
- 2. Executive Summary
- 2.1. Introduction
- 3. Market Dynamics
- 3.1. Introduction
- 3.2. Market Drivers
- 3.2.1. Retail Sector to hold major share in RPA Market; Adoption of AI- and Cloud-based Solutions for Internal Efficiency among SMEs
- 3.3. Market Restrains
- 3.3.1. Data Security Concerns
- 3.4. Market Trends
- 3.4.1. Retail Sector to hold major share in RPA Market
- 4. Market Factor Analysis
- 4.1. Porters Five Forces
- 4.2. Supply/Value Chain
- 4.3. PESTEL analysis
- 4.4. Market Entropy
- 4.5. Patent/Trademark Analysis
- 5. Global IT Robotic Automation Industry Analysis, Insights and Forecast, 2019-2031
- 5.1. Market Analysis, Insights and Forecast - by Deployment
- 5.1.1. On-premise
- 5.1.2. Cloud
- 5.2. Market Analysis, Insights and Forecast - by Solution
- 5.2.1. Software
- 5.2.2. Service
- 5.3. Market Analysis, Insights and Forecast - by Size of Enterprise
- 5.3.1. Small and Medium Enterprises
- 5.3.2. Large Enterprises
- 5.4. Market Analysis, Insights and Forecast - by End User Industry
- 5.4.1. IT and Telecom
- 5.4.2. BFSI
- 5.4.3. Healthcare
- 5.4.4. Retail
- 5.4.5. Manufacturing
- 5.4.6. Other End User Industries
- 5.5. Market Analysis, Insights and Forecast - by Region
- 5.5.1. North America
- 5.5.2. Europe
- 5.5.3. Asia Pacific
- 5.5.4. Latin America
- 5.5.5. Middle East and Africa
- 5.1. Market Analysis, Insights and Forecast - by Deployment
- 6. North America IT Robotic Automation Industry Analysis, Insights and Forecast, 2019-2031
- 6.1. Market Analysis, Insights and Forecast - by Deployment
- 6.1.1. On-premise
- 6.1.2. Cloud
- 6.2. Market Analysis, Insights and Forecast - by Solution
- 6.2.1. Software
- 6.2.2. Service
- 6.3. Market Analysis, Insights and Forecast - by Size of Enterprise
- 6.3.1. Small and Medium Enterprises
- 6.3.2. Large Enterprises
- 6.4. Market Analysis, Insights and Forecast - by End User Industry
- 6.4.1. IT and Telecom
- 6.4.2. BFSI
- 6.4.3. Healthcare
- 6.4.4. Retail
- 6.4.5. Manufacturing
- 6.4.6. Other End User Industries
- 6.1. Market Analysis, Insights and Forecast - by Deployment
- 7. Europe IT Robotic Automation Industry Analysis, Insights and Forecast, 2019-2031
- 7.1. Market Analysis, Insights and Forecast - by Deployment
- 7.1.1. On-premise
- 7.1.2. Cloud
- 7.2. Market Analysis, Insights and Forecast - by Solution
- 7.2.1. Software
- 7.2.2. Service
- 7.3. Market Analysis, Insights and Forecast - by Size of Enterprise
- 7.3.1. Small and Medium Enterprises
- 7.3.2. Large Enterprises
- 7.4. Market Analysis, Insights and Forecast - by End User Industry
- 7.4.1. IT and Telecom
- 7.4.2. BFSI
- 7.4.3. Healthcare
- 7.4.4. Retail
- 7.4.5. Manufacturing
- 7.4.6. Other End User Industries
- 7.1. Market Analysis, Insights and Forecast - by Deployment
- 8. Asia Pacific IT Robotic Automation Industry Analysis, Insights and Forecast, 2019-2031
- 8.1. Market Analysis, Insights and Forecast - by Deployment
- 8.1.1. On-premise
- 8.1.2. Cloud
- 8.2. Market Analysis, Insights and Forecast - by Solution
- 8.2.1. Software
- 8.2.2. Service
- 8.3. Market Analysis, Insights and Forecast - by Size of Enterprise
- 8.3.1. Small and Medium Enterprises
- 8.3.2. Large Enterprises
- 8.4. Market Analysis, Insights and Forecast - by End User Industry
- 8.4.1. IT and Telecom
- 8.4.2. BFSI
- 8.4.3. Healthcare
- 8.4.4. Retail
- 8.4.5. Manufacturing
- 8.4.6. Other End User Industries
- 8.1. Market Analysis, Insights and Forecast - by Deployment
- 9. Latin America IT Robotic Automation Industry Analysis, Insights and Forecast, 2019-2031
- 9.1. Market Analysis, Insights and Forecast - by Deployment
- 9.1.1. On-premise
- 9.1.2. Cloud
- 9.2. Market Analysis, Insights and Forecast - by Solution
- 9.2.1. Software
- 9.2.2. Service
- 9.3. Market Analysis, Insights and Forecast - by Size of Enterprise
- 9.3.1. Small and Medium Enterprises
- 9.3.2. Large Enterprises
- 9.4. Market Analysis, Insights and Forecast - by End User Industry
- 9.4.1. IT and Telecom
- 9.4.2. BFSI
- 9.4.3. Healthcare
- 9.4.4. Retail
- 9.4.5. Manufacturing
- 9.4.6. Other End User Industries
- 9.1. Market Analysis, Insights and Forecast - by Deployment
- 10. Middle East and Africa IT Robotic Automation Industry Analysis, Insights and Forecast, 2019-2031
- 10.1. Market Analysis, Insights and Forecast - by Deployment
- 10.1.1. On-premise
- 10.1.2. Cloud
- 10.2. Market Analysis, Insights and Forecast - by Solution
- 10.2.1. Software
- 10.2.2. Service
- 10.3. Market Analysis, Insights and Forecast - by Size of Enterprise
- 10.3.1. Small and Medium Enterprises
- 10.3.2. Large Enterprises
- 10.4. Market Analysis, Insights and Forecast - by End User Industry
- 10.4.1. IT and Telecom
- 10.4.2. BFSI
- 10.4.3. Healthcare
- 10.4.4. Retail
- 10.4.5. Manufacturing
- 10.4.6. Other End User Industries
- 10.1. Market Analysis, Insights and Forecast - by Deployment
- 11. North America IT Robotic Automation Industry Analysis, Insights and Forecast, 2019-2031
- 11.1. Market Analysis, Insights and Forecast - By Country/Sub-region
- 11.1.1 United States
- 11.1.2 Canada
- 11.1.3 Mexico
- 12. Europe IT Robotic Automation Industry Analysis, Insights and Forecast, 2019-2031
- 12.1. Market Analysis, Insights and Forecast - By Country/Sub-region
- 12.1.1 Germany
- 12.1.2 United Kingdom
- 12.1.3 France
- 12.1.4 Spain
- 12.1.5 Italy
- 12.1.6 Spain
- 12.1.7 Belgium
- 12.1.8 Netherland
- 12.1.9 Nordics
- 12.1.10 Rest of Europe
- 13. Asia Pacific IT Robotic Automation Industry Analysis, Insights and Forecast, 2019-2031
- 13.1. Market Analysis, Insights and Forecast - By Country/Sub-region
- 13.1.1 China
- 13.1.2 Japan
- 13.1.3 India
- 13.1.4 South Korea
- 13.1.5 Southeast Asia
- 13.1.6 Australia
- 13.1.7 Indonesia
- 13.1.8 Phillipes
- 13.1.9 Singapore
- 13.1.10 Thailandc
- 13.1.11 Rest of Asia Pacific
- 14. South America IT Robotic Automation Industry Analysis, Insights and Forecast, 2019-2031
- 14.1. Market Analysis, Insights and Forecast - By Country/Sub-region
- 14.1.1 Brazil
- 14.1.2 Argentina
- 14.1.3 Peru
- 14.1.4 Chile
- 14.1.5 Colombia
- 14.1.6 Ecuador
- 14.1.7 Venezuela
- 14.1.8 Rest of South America
- 15. North America IT Robotic Automation Industry Analysis, Insights and Forecast, 2019-2031
- 15.1. Market Analysis, Insights and Forecast - By Country/Sub-region
- 15.1.1 United States
- 15.1.2 Canada
- 15.1.3 Mexico
- 16. MEA IT Robotic Automation Industry Analysis, Insights and Forecast, 2019-2031
- 16.1. Market Analysis, Insights and Forecast - By Country/Sub-region
- 16.1.1 United Arab Emirates
- 16.1.2 Saudi Arabia
- 16.1.3 South Africa
- 16.1.4 Rest of Middle East and Africa
- 17. Competitive Analysis
- 17.1. Global Market Share Analysis 2024
- 17.2. Company Profiles
- 17.2.1 Jacada Inc
- 17.2.1.1. Overview
- 17.2.1.2. Products
- 17.2.1.3. SWOT Analysis
- 17.2.1.4. Recent Developments
- 17.2.1.5. Financials (Based on Availability)
- 17.2.2 Nice Robotic Automation Ltd
- 17.2.2.1. Overview
- 17.2.2.2. Products
- 17.2.2.3. SWOT Analysis
- 17.2.2.4. Recent Developments
- 17.2.2.5. Financials (Based on Availability)
- 17.2.3 Kofax Inc (Thoma Bravo LLC)
- 17.2.3.1. Overview
- 17.2.3.2. Products
- 17.2.3.3. SWOT Analysis
- 17.2.3.4. Recent Developments
- 17.2.3.5. Financials (Based on Availability)
- 17.2.4 HelpSystems LLC (HGGC)
- 17.2.4.1. Overview
- 17.2.4.2. Products
- 17.2.4.3. SWOT Analysis
- 17.2.4.4. Recent Developments
- 17.2.4.5. Financials (Based on Availability)
- 17.2.5 Jidoka
- 17.2.5.1. Overview
- 17.2.5.2. Products
- 17.2.5.3. SWOT Analysis
- 17.2.5.4. Recent Developments
- 17.2.5.5. Financials (Based on Availability)
- 17.2.6 UIPath Inc
- 17.2.6.1. Overview
- 17.2.6.2. Products
- 17.2.6.3. SWOT Analysis
- 17.2.6.4. Recent Developments
- 17.2.6.5. Financials (Based on Availability)
- 17.2.7 Datamatics Global Services Limited
- 17.2.7.1. Overview
- 17.2.7.2. Products
- 17.2.7.3. SWOT Analysis
- 17.2.7.4. Recent Developments
- 17.2.7.5. Financials (Based on Availability)
- 17.2.8 Automation Anywhere Inc
- 17.2.8.1. Overview
- 17.2.8.2. Products
- 17.2.8.3. SWOT Analysis
- 17.2.8.4. Recent Developments
- 17.2.8.5. Financials (Based on Availability)
- 17.2.9 Be Informed BV (Hoogenberg Beheer BV)
- 17.2.9.1. Overview
- 17.2.9.2. Products
- 17.2.9.3. SWOT Analysis
- 17.2.9.4. Recent Developments
- 17.2.9.5. Financials (Based on Availability)
- 17.2.10 Pegasystems Inc
- 17.2.10.1. Overview
- 17.2.10.2. Products
- 17.2.10.3. SWOT Analysis
- 17.2.10.4. Recent Developments
- 17.2.10.5. Financials (Based on Availability)
- 17.2.11 AutomationEdge Technologies Inc
- 17.2.11.1. Overview
- 17.2.11.2. Products
- 17.2.11.3. SWOT Analysis
- 17.2.11.4. Recent Developments
- 17.2.11.5. Financials (Based on Availability)
- 17.2.12 Blue Prism Group PLC
- 17.2.12.1. Overview
- 17.2.12.2. Products
- 17.2.12.3. SWOT Analysis
- 17.2.12.4. Recent Developments
- 17.2.12.5. Financials (Based on Availability)
- 17.2.13 CGI Inc
- 17.2.13.1. Overview
- 17.2.13.2. Products
- 17.2.13.3. SWOT Analysis
- 17.2.13.4. Recent Developments
- 17.2.13.5. Financials (Based on Availability)
- 17.2.1 Jacada Inc
List of Figures
- Figure 1: Global IT Robotic Automation Industry Revenue Breakdown (Million, %) by Region 2024 & 2032
- Figure 2: Global IT Robotic Automation Industry Volume Breakdown (K Unit, %) by Region 2024 & 2032
- Figure 3: North America IT Robotic Automation Industry Revenue (Million), by Country 2024 & 2032
- Figure 4: North America IT Robotic Automation Industry Volume (K Unit), by Country 2024 & 2032
- Figure 5: North America IT Robotic Automation Industry Revenue Share (%), by Country 2024 & 2032
- Figure 6: North America IT Robotic Automation Industry Volume Share (%), by Country 2024 & 2032
- Figure 7: Europe IT Robotic Automation Industry Revenue (Million), by Country 2024 & 2032
- Figure 8: Europe IT Robotic Automation Industry Volume (K Unit), by Country 2024 & 2032
- Figure 9: Europe IT Robotic Automation Industry Revenue Share (%), by Country 2024 & 2032
- Figure 10: Europe IT Robotic Automation Industry Volume Share (%), by Country 2024 & 2032
- Figure 11: Asia Pacific IT Robotic Automation Industry Revenue (Million), by Country 2024 & 2032
- Figure 12: Asia Pacific IT Robotic Automation Industry Volume (K Unit), by Country 2024 & 2032
- Figure 13: Asia Pacific IT Robotic Automation Industry Revenue Share (%), by Country 2024 & 2032
- Figure 14: Asia Pacific IT Robotic Automation Industry Volume Share (%), by Country 2024 & 2032
- Figure 15: South America IT Robotic Automation Industry Revenue (Million), by Country 2024 & 2032
- Figure 16: South America IT Robotic Automation Industry Volume (K Unit), by Country 2024 & 2032
- Figure 17: South America IT Robotic Automation Industry Revenue Share (%), by Country 2024 & 2032
- Figure 18: South America IT Robotic Automation Industry Volume Share (%), by Country 2024 & 2032
- Figure 19: North America IT Robotic Automation Industry Revenue (Million), by Country 2024 & 2032
- Figure 20: North America IT Robotic Automation Industry Volume (K Unit), by Country 2024 & 2032
- Figure 21: North America IT Robotic Automation Industry Revenue Share (%), by Country 2024 & 2032
- Figure 22: North America IT Robotic Automation Industry Volume Share (%), by Country 2024 & 2032
- Figure 23: MEA IT Robotic Automation Industry Revenue (Million), by Country 2024 & 2032
- Figure 24: MEA IT Robotic Automation Industry Volume (K Unit), by Country 2024 & 2032
- Figure 25: MEA IT Robotic Automation Industry Revenue Share (%), by Country 2024 & 2032
- Figure 26: MEA IT Robotic Automation Industry Volume Share (%), by Country 2024 & 2032
- Figure 27: North America IT Robotic Automation Industry Revenue (Million), by Deployment 2024 & 2032
- Figure 28: North America IT Robotic Automation Industry Volume (K Unit), by Deployment 2024 & 2032
- Figure 29: North America IT Robotic Automation Industry Revenue Share (%), by Deployment 2024 & 2032
- Figure 30: North America IT Robotic Automation Industry Volume Share (%), by Deployment 2024 & 2032
- Figure 31: North America IT Robotic Automation Industry Revenue (Million), by Solution 2024 & 2032
- Figure 32: North America IT Robotic Automation Industry Volume (K Unit), by Solution 2024 & 2032
- Figure 33: North America IT Robotic Automation Industry Revenue Share (%), by Solution 2024 & 2032
- Figure 34: North America IT Robotic Automation Industry Volume Share (%), by Solution 2024 & 2032
- Figure 35: North America IT Robotic Automation Industry Revenue (Million), by Size of Enterprise 2024 & 2032
- Figure 36: North America IT Robotic Automation Industry Volume (K Unit), by Size of Enterprise 2024 & 2032
- Figure 37: North America IT Robotic Automation Industry Revenue Share (%), by Size of Enterprise 2024 & 2032
- Figure 38: North America IT Robotic Automation Industry Volume Share (%), by Size of Enterprise 2024 & 2032
- Figure 39: North America IT Robotic Automation Industry Revenue (Million), by End User Industry 2024 & 2032
- Figure 40: North America IT Robotic Automation Industry Volume (K Unit), by End User Industry 2024 & 2032
- Figure 41: North America IT Robotic Automation Industry Revenue Share (%), by End User Industry 2024 & 2032
- Figure 42: North America IT Robotic Automation Industry Volume Share (%), by End User Industry 2024 & 2032
- Figure 43: North America IT Robotic Automation Industry Revenue (Million), by Country 2024 & 2032
- Figure 44: North America IT Robotic Automation Industry Volume (K Unit), by Country 2024 & 2032
- Figure 45: North America IT Robotic Automation Industry Revenue Share (%), by Country 2024 & 2032
- Figure 46: North America IT Robotic Automation Industry Volume Share (%), by Country 2024 & 2032
- Figure 47: Europe IT Robotic Automation Industry Revenue (Million), by Deployment 2024 & 2032
- Figure 48: Europe IT Robotic Automation Industry Volume (K Unit), by Deployment 2024 & 2032
- Figure 49: Europe IT Robotic Automation Industry Revenue Share (%), by Deployment 2024 & 2032
- Figure 50: Europe IT Robotic Automation Industry Volume Share (%), by Deployment 2024 & 2032
- Figure 51: Europe IT Robotic Automation Industry Revenue (Million), by Solution 2024 & 2032
- Figure 52: Europe IT Robotic Automation Industry Volume (K Unit), by Solution 2024 & 2032
- Figure 53: Europe IT Robotic Automation Industry Revenue Share (%), by Solution 2024 & 2032
- Figure 54: Europe IT Robotic Automation Industry Volume Share (%), by Solution 2024 & 2032
- Figure 55: Europe IT Robotic Automation Industry Revenue (Million), by Size of Enterprise 2024 & 2032
- Figure 56: Europe IT Robotic Automation Industry Volume (K Unit), by Size of Enterprise 2024 & 2032
- Figure 57: Europe IT Robotic Automation Industry Revenue Share (%), by Size of Enterprise 2024 & 2032
- Figure 58: Europe IT Robotic Automation Industry Volume Share (%), by Size of Enterprise 2024 & 2032
- Figure 59: Europe IT Robotic Automation Industry Revenue (Million), by End User Industry 2024 & 2032
- Figure 60: Europe IT Robotic Automation Industry Volume (K Unit), by End User Industry 2024 & 2032
- Figure 61: Europe IT Robotic Automation Industry Revenue Share (%), by End User Industry 2024 & 2032
- Figure 62: Europe IT Robotic Automation Industry Volume Share (%), by End User Industry 2024 & 2032
- Figure 63: Europe IT Robotic Automation Industry Revenue (Million), by Country 2024 & 2032
- Figure 64: Europe IT Robotic Automation Industry Volume (K Unit), by Country 2024 & 2032
- Figure 65: Europe IT Robotic Automation Industry Revenue Share (%), by Country 2024 & 2032
- Figure 66: Europe IT Robotic Automation Industry Volume Share (%), by Country 2024 & 2032
- Figure 67: Asia Pacific IT Robotic Automation Industry Revenue (Million), by Deployment 2024 & 2032
- Figure 68: Asia Pacific IT Robotic Automation Industry Volume (K Unit), by Deployment 2024 & 2032
- Figure 69: Asia Pacific IT Robotic Automation Industry Revenue Share (%), by Deployment 2024 & 2032
- Figure 70: Asia Pacific IT Robotic Automation Industry Volume Share (%), by Deployment 2024 & 2032
- Figure 71: Asia Pacific IT Robotic Automation Industry Revenue (Million), by Solution 2024 & 2032
- Figure 72: Asia Pacific IT Robotic Automation Industry Volume (K Unit), by Solution 2024 & 2032
- Figure 73: Asia Pacific IT Robotic Automation Industry Revenue Share (%), by Solution 2024 & 2032
- Figure 74: Asia Pacific IT Robotic Automation Industry Volume Share (%), by Solution 2024 & 2032
- Figure 75: Asia Pacific IT Robotic Automation Industry Revenue (Million), by Size of Enterprise 2024 & 2032
- Figure 76: Asia Pacific IT Robotic Automation Industry Volume (K Unit), by Size of Enterprise 2024 & 2032
- Figure 77: Asia Pacific IT Robotic Automation Industry Revenue Share (%), by Size of Enterprise 2024 & 2032
- Figure 78: Asia Pacific IT Robotic Automation Industry Volume Share (%), by Size of Enterprise 2024 & 2032
- Figure 79: Asia Pacific IT Robotic Automation Industry Revenue (Million), by End User Industry 2024 & 2032
- Figure 80: Asia Pacific IT Robotic Automation Industry Volume (K Unit), by End User Industry 2024 & 2032
- Figure 81: Asia Pacific IT Robotic Automation Industry Revenue Share (%), by End User Industry 2024 & 2032
- Figure 82: Asia Pacific IT Robotic Automation Industry Volume Share (%), by End User Industry 2024 & 2032
- Figure 83: Asia Pacific IT Robotic Automation Industry Revenue (Million), by Country 2024 & 2032
- Figure 84: Asia Pacific IT Robotic Automation Industry Volume (K Unit), by Country 2024 & 2032
- Figure 85: Asia Pacific IT Robotic Automation Industry Revenue Share (%), by Country 2024 & 2032
- Figure 86: Asia Pacific IT Robotic Automation Industry Volume Share (%), by Country 2024 & 2032
- Figure 87: Latin America IT Robotic Automation Industry Revenue (Million), by Deployment 2024 & 2032
- Figure 88: Latin America IT Robotic Automation Industry Volume (K Unit), by Deployment 2024 & 2032
- Figure 89: Latin America IT Robotic Automation Industry Revenue Share (%), by Deployment 2024 & 2032
- Figure 90: Latin America IT Robotic Automation Industry Volume Share (%), by Deployment 2024 & 2032
- Figure 91: Latin America IT Robotic Automation Industry Revenue (Million), by Solution 2024 & 2032
- Figure 92: Latin America IT Robotic Automation Industry Volume (K Unit), by Solution 2024 & 2032
- Figure 93: Latin America IT Robotic Automation Industry Revenue Share (%), by Solution 2024 & 2032
- Figure 94: Latin America IT Robotic Automation Industry Volume Share (%), by Solution 2024 & 2032
- Figure 95: Latin America IT Robotic Automation Industry Revenue (Million), by Size of Enterprise 2024 & 2032
- Figure 96: Latin America IT Robotic Automation Industry Volume (K Unit), by Size of Enterprise 2024 & 2032
- Figure 97: Latin America IT Robotic Automation Industry Revenue Share (%), by Size of Enterprise 2024 & 2032
- Figure 98: Latin America IT Robotic Automation Industry Volume Share (%), by Size of Enterprise 2024 & 2032
- Figure 99: Latin America IT Robotic Automation Industry Revenue (Million), by End User Industry 2024 & 2032
- Figure 100: Latin America IT Robotic Automation Industry Volume (K Unit), by End User Industry 2024 & 2032
- Figure 101: Latin America IT Robotic Automation Industry Revenue Share (%), by End User Industry 2024 & 2032
- Figure 102: Latin America IT Robotic Automation Industry Volume Share (%), by End User Industry 2024 & 2032
- Figure 103: Latin America IT Robotic Automation Industry Revenue (Million), by Country 2024 & 2032
- Figure 104: Latin America IT Robotic Automation Industry Volume (K Unit), by Country 2024 & 2032
- Figure 105: Latin America IT Robotic Automation Industry Revenue Share (%), by Country 2024 & 2032
- Figure 106: Latin America IT Robotic Automation Industry Volume Share (%), by Country 2024 & 2032
- Figure 107: Middle East and Africa IT Robotic Automation Industry Revenue (Million), by Deployment 2024 & 2032
- Figure 108: Middle East and Africa IT Robotic Automation Industry Volume (K Unit), by Deployment 2024 & 2032
- Figure 109: Middle East and Africa IT Robotic Automation Industry Revenue Share (%), by Deployment 2024 & 2032
- Figure 110: Middle East and Africa IT Robotic Automation Industry Volume Share (%), by Deployment 2024 & 2032
- Figure 111: Middle East and Africa IT Robotic Automation Industry Revenue (Million), by Solution 2024 & 2032
- Figure 112: Middle East and Africa IT Robotic Automation Industry Volume (K Unit), by Solution 2024 & 2032
- Figure 113: Middle East and Africa IT Robotic Automation Industry Revenue Share (%), by Solution 2024 & 2032
- Figure 114: Middle East and Africa IT Robotic Automation Industry Volume Share (%), by Solution 2024 & 2032
- Figure 115: Middle East and Africa IT Robotic Automation Industry Revenue (Million), by Size of Enterprise 2024 & 2032
- Figure 116: Middle East and Africa IT Robotic Automation Industry Volume (K Unit), by Size of Enterprise 2024 & 2032
- Figure 117: Middle East and Africa IT Robotic Automation Industry Revenue Share (%), by Size of Enterprise 2024 & 2032
- Figure 118: Middle East and Africa IT Robotic Automation Industry Volume Share (%), by Size of Enterprise 2024 & 2032
- Figure 119: Middle East and Africa IT Robotic Automation Industry Revenue (Million), by End User Industry 2024 & 2032
- Figure 120: Middle East and Africa IT Robotic Automation Industry Volume (K Unit), by End User Industry 2024 & 2032
- Figure 121: Middle East and Africa IT Robotic Automation Industry Revenue Share (%), by End User Industry 2024 & 2032
- Figure 122: Middle East and Africa IT Robotic Automation Industry Volume Share (%), by End User Industry 2024 & 2032
- Figure 123: Middle East and Africa IT Robotic Automation Industry Revenue (Million), by Country 2024 & 2032
- Figure 124: Middle East and Africa IT Robotic Automation Industry Volume (K Unit), by Country 2024 & 2032
- Figure 125: Middle East and Africa IT Robotic Automation Industry Revenue Share (%), by Country 2024 & 2032
- Figure 126: Middle East and Africa IT Robotic Automation Industry Volume Share (%), by Country 2024 & 2032
List of Tables
- Table 1: Global IT Robotic Automation Industry Revenue Million Forecast, by Region 2019 & 2032
- Table 2: Global IT Robotic Automation Industry Volume K Unit Forecast, by Region 2019 & 2032
- Table 3: Global IT Robotic Automation Industry Revenue Million Forecast, by Deployment 2019 & 2032
- Table 4: Global IT Robotic Automation Industry Volume K Unit Forecast, by Deployment 2019 & 2032
- Table 5: Global IT Robotic Automation Industry Revenue Million Forecast, by Solution 2019 & 2032
- Table 6: Global IT Robotic Automation Industry Volume K Unit Forecast, by Solution 2019 & 2032
- Table 7: Global IT Robotic Automation Industry Revenue Million Forecast, by Size of Enterprise 2019 & 2032
- Table 8: Global IT Robotic Automation Industry Volume K Unit Forecast, by Size of Enterprise 2019 & 2032
- Table 9: Global IT Robotic Automation Industry Revenue Million Forecast, by End User Industry 2019 & 2032
- Table 10: Global IT Robotic Automation Industry Volume K Unit Forecast, by End User Industry 2019 & 2032
- Table 11: Global IT Robotic Automation Industry Revenue Million Forecast, by Region 2019 & 2032
- Table 12: Global IT Robotic Automation Industry Volume K Unit Forecast, by Region 2019 & 2032
- Table 13: Global IT Robotic Automation Industry Revenue Million Forecast, by Country 2019 & 2032
- Table 14: Global IT Robotic Automation Industry Volume K Unit Forecast, by Country 2019 & 2032
- Table 15: United States IT Robotic Automation Industry Revenue (Million) Forecast, by Application 2019 & 2032
- Table 16: United States IT Robotic Automation Industry Volume (K Unit) Forecast, by Application 2019 & 2032
- Table 17: Canada IT Robotic Automation Industry Revenue (Million) Forecast, by Application 2019 & 2032
- Table 18: Canada IT Robotic Automation Industry Volume (K Unit) Forecast, by Application 2019 & 2032
- Table 19: Mexico IT Robotic Automation Industry Revenue (Million) Forecast, by Application 2019 & 2032
- Table 20: Mexico IT Robotic Automation Industry Volume (K Unit) Forecast, by Application 2019 & 2032
- Table 21: Global IT Robotic Automation Industry Revenue Million Forecast, by Country 2019 & 2032
- Table 22: Global IT Robotic Automation Industry Volume K Unit Forecast, by Country 2019 & 2032
- Table 23: Germany IT Robotic Automation Industry Revenue (Million) Forecast, by Application 2019 & 2032
- Table 24: Germany IT Robotic Automation Industry Volume (K Unit) Forecast, by Application 2019 & 2032
- Table 25: United Kingdom IT Robotic Automation Industry Revenue (Million) Forecast, by Application 2019 & 2032
- Table 26: United Kingdom IT Robotic Automation Industry Volume (K Unit) Forecast, by Application 2019 & 2032
- Table 27: France IT Robotic Automation Industry Revenue (Million) Forecast, by Application 2019 & 2032
- Table 28: France IT Robotic Automation Industry Volume (K Unit) Forecast, by Application 2019 & 2032
- Table 29: Spain IT Robotic Automation Industry Revenue (Million) Forecast, by Application 2019 & 2032
- Table 30: Spain IT Robotic Automation Industry Volume (K Unit) Forecast, by Application 2019 & 2032
- Table 31: Italy IT Robotic Automation Industry Revenue (Million) Forecast, by Application 2019 & 2032
- Table 32: Italy IT Robotic Automation Industry Volume (K Unit) Forecast, by Application 2019 & 2032
- Table 33: Spain IT Robotic Automation Industry Revenue (Million) Forecast, by Application 2019 & 2032
- Table 34: Spain IT Robotic Automation Industry Volume (K Unit) Forecast, by Application 2019 & 2032
- Table 35: Belgium IT Robotic Automation Industry Revenue (Million) Forecast, by Application 2019 & 2032
- Table 36: Belgium IT Robotic Automation Industry Volume (K Unit) Forecast, by Application 2019 & 2032
- Table 37: Netherland IT Robotic Automation Industry Revenue (Million) Forecast, by Application 2019 & 2032
- Table 38: Netherland IT Robotic Automation Industry Volume (K Unit) Forecast, by Application 2019 & 2032
- Table 39: Nordics IT Robotic Automation Industry Revenue (Million) Forecast, by Application 2019 & 2032
- Table 40: Nordics IT Robotic Automation Industry Volume (K Unit) Forecast, by Application 2019 & 2032
- Table 41: Rest of Europe IT Robotic Automation Industry Revenue (Million) Forecast, by Application 2019 & 2032
- Table 42: Rest of Europe IT Robotic Automation Industry Volume (K Unit) Forecast, by Application 2019 & 2032
- Table 43: Global IT Robotic Automation Industry Revenue Million Forecast, by Country 2019 & 2032
- Table 44: Global IT Robotic Automation Industry Volume K Unit Forecast, by Country 2019 & 2032
- Table 45: China IT Robotic Automation Industry Revenue (Million) Forecast, by Application 2019 & 2032
- Table 46: China IT Robotic Automation Industry Volume (K Unit) Forecast, by Application 2019 & 2032
- Table 47: Japan IT Robotic Automation Industry Revenue (Million) Forecast, by Application 2019 & 2032
- Table 48: Japan IT Robotic Automation Industry Volume (K Unit) Forecast, by Application 2019 & 2032
- Table 49: India IT Robotic Automation Industry Revenue (Million) Forecast, by Application 2019 & 2032
- Table 50: India IT Robotic Automation Industry Volume (K Unit) Forecast, by Application 2019 & 2032
- Table 51: South Korea IT Robotic Automation Industry Revenue (Million) Forecast, by Application 2019 & 2032
- Table 52: South Korea IT Robotic Automation Industry Volume (K Unit) Forecast, by Application 2019 & 2032
- Table 53: Southeast Asia IT Robotic Automation Industry Revenue (Million) Forecast, by Application 2019 & 2032
- Table 54: Southeast Asia IT Robotic Automation Industry Volume (K Unit) Forecast, by Application 2019 & 2032
- Table 55: Australia IT Robotic Automation Industry Revenue (Million) Forecast, by Application 2019 & 2032
- Table 56: Australia IT Robotic Automation Industry Volume (K Unit) Forecast, by Application 2019 & 2032
- Table 57: Indonesia IT Robotic Automation Industry Revenue (Million) Forecast, by Application 2019 & 2032
- Table 58: Indonesia IT Robotic Automation Industry Volume (K Unit) Forecast, by Application 2019 & 2032
- Table 59: Phillipes IT Robotic Automation Industry Revenue (Million) Forecast, by Application 2019 & 2032
- Table 60: Phillipes IT Robotic Automation Industry Volume (K Unit) Forecast, by Application 2019 & 2032
- Table 61: Singapore IT Robotic Automation Industry Revenue (Million) Forecast, by Application 2019 & 2032
- Table 62: Singapore IT Robotic Automation Industry Volume (K Unit) Forecast, by Application 2019 & 2032
- Table 63: Thailandc IT Robotic Automation Industry Revenue (Million) Forecast, by Application 2019 & 2032
- Table 64: Thailandc IT Robotic Automation Industry Volume (K Unit) Forecast, by Application 2019 & 2032
- Table 65: Rest of Asia Pacific IT Robotic Automation Industry Revenue (Million) Forecast, by Application 2019 & 2032
- Table 66: Rest of Asia Pacific IT Robotic Automation Industry Volume (K Unit) Forecast, by Application 2019 & 2032
- Table 67: Global IT Robotic Automation Industry Revenue Million Forecast, by Country 2019 & 2032
- Table 68: Global IT Robotic Automation Industry Volume K Unit Forecast, by Country 2019 & 2032
- Table 69: Brazil IT Robotic Automation Industry Revenue (Million) Forecast, by Application 2019 & 2032
- Table 70: Brazil IT Robotic Automation Industry Volume (K Unit) Forecast, by Application 2019 & 2032
- Table 71: Argentina IT Robotic Automation Industry Revenue (Million) Forecast, by Application 2019 & 2032
- Table 72: Argentina IT Robotic Automation Industry Volume (K Unit) Forecast, by Application 2019 & 2032
- Table 73: Peru IT Robotic Automation Industry Revenue (Million) Forecast, by Application 2019 & 2032
- Table 74: Peru IT Robotic Automation Industry Volume (K Unit) Forecast, by Application 2019 & 2032
- Table 75: Chile IT Robotic Automation Industry Revenue (Million) Forecast, by Application 2019 & 2032
- Table 76: Chile IT Robotic Automation Industry Volume (K Unit) Forecast, by Application 2019 & 2032
- Table 77: Colombia IT Robotic Automation Industry Revenue (Million) Forecast, by Application 2019 & 2032
- Table 78: Colombia IT Robotic Automation Industry Volume (K Unit) Forecast, by Application 2019 & 2032
- Table 79: Ecuador IT Robotic Automation Industry Revenue (Million) Forecast, by Application 2019 & 2032
- Table 80: Ecuador IT Robotic Automation Industry Volume (K Unit) Forecast, by Application 2019 & 2032
- Table 81: Venezuela IT Robotic Automation Industry Revenue (Million) Forecast, by Application 2019 & 2032
- Table 82: Venezuela IT Robotic Automation Industry Volume (K Unit) Forecast, by Application 2019 & 2032
- Table 83: Rest of South America IT Robotic Automation Industry Revenue (Million) Forecast, by Application 2019 & 2032
- Table 84: Rest of South America IT Robotic Automation Industry Volume (K Unit) Forecast, by Application 2019 & 2032
- Table 85: Global IT Robotic Automation Industry Revenue Million Forecast, by Country 2019 & 2032
- Table 86: Global IT Robotic Automation Industry Volume K Unit Forecast, by Country 2019 & 2032
- Table 87: United States IT Robotic Automation Industry Revenue (Million) Forecast, by Application 2019 & 2032
- Table 88: United States IT Robotic Automation Industry Volume (K Unit) Forecast, by Application 2019 & 2032
- Table 89: Canada IT Robotic Automation Industry Revenue (Million) Forecast, by Application 2019 & 2032
- Table 90: Canada IT Robotic Automation Industry Volume (K Unit) Forecast, by Application 2019 & 2032
- Table 91: Mexico IT Robotic Automation Industry Revenue (Million) Forecast, by Application 2019 & 2032
- Table 92: Mexico IT Robotic Automation Industry Volume (K Unit) Forecast, by Application 2019 & 2032
- Table 93: Global IT Robotic Automation Industry Revenue Million Forecast, by Country 2019 & 2032
- Table 94: Global IT Robotic Automation Industry Volume K Unit Forecast, by Country 2019 & 2032
- Table 95: United Arab Emirates IT Robotic Automation Industry Revenue (Million) Forecast, by Application 2019 & 2032
- Table 96: United Arab Emirates IT Robotic Automation Industry Volume (K Unit) Forecast, by Application 2019 & 2032
- Table 97: Saudi Arabia IT Robotic Automation Industry Revenue (Million) Forecast, by Application 2019 & 2032
- Table 98: Saudi Arabia IT Robotic Automation Industry Volume (K Unit) Forecast, by Application 2019 & 2032
- Table 99: South Africa IT Robotic Automation Industry Revenue (Million) Forecast, by Application 2019 & 2032
- Table 100: South Africa IT Robotic Automation Industry Volume (K Unit) Forecast, by Application 2019 & 2032
- Table 101: Rest of Middle East and Africa IT Robotic Automation Industry Revenue (Million) Forecast, by Application 2019 & 2032
- Table 102: Rest of Middle East and Africa IT Robotic Automation Industry Volume (K Unit) Forecast, by Application 2019 & 2032
- Table 103: Global IT Robotic Automation Industry Revenue Million Forecast, by Deployment 2019 & 2032
- Table 104: Global IT Robotic Automation Industry Volume K Unit Forecast, by Deployment 2019 & 2032
- Table 105: Global IT Robotic Automation Industry Revenue Million Forecast, by Solution 2019 & 2032
- Table 106: Global IT Robotic Automation Industry Volume K Unit Forecast, by Solution 2019 & 2032
- Table 107: Global IT Robotic Automation Industry Revenue Million Forecast, by Size of Enterprise 2019 & 2032
- Table 108: Global IT Robotic Automation Industry Volume K Unit Forecast, by Size of Enterprise 2019 & 2032
- Table 109: Global IT Robotic Automation Industry Revenue Million Forecast, by End User Industry 2019 & 2032
- Table 110: Global IT Robotic Automation Industry Volume K Unit Forecast, by End User Industry 2019 & 2032
- Table 111: Global IT Robotic Automation Industry Revenue Million Forecast, by Country 2019 & 2032
- Table 112: Global IT Robotic Automation Industry Volume K Unit Forecast, by Country 2019 & 2032
- Table 113: Global IT Robotic Automation Industry Revenue Million Forecast, by Deployment 2019 & 2032
- Table 114: Global IT Robotic Automation Industry Volume K Unit Forecast, by Deployment 2019 & 2032
- Table 115: Global IT Robotic Automation Industry Revenue Million Forecast, by Solution 2019 & 2032
- Table 116: Global IT Robotic Automation Industry Volume K Unit Forecast, by Solution 2019 & 2032
- Table 117: Global IT Robotic Automation Industry Revenue Million Forecast, by Size of Enterprise 2019 & 2032
- Table 118: Global IT Robotic Automation Industry Volume K Unit Forecast, by Size of Enterprise 2019 & 2032
- Table 119: Global IT Robotic Automation Industry Revenue Million Forecast, by End User Industry 2019 & 2032
- Table 120: Global IT Robotic Automation Industry Volume K Unit Forecast, by End User Industry 2019 & 2032
- Table 121: Global IT Robotic Automation Industry Revenue Million Forecast, by Country 2019 & 2032
- Table 122: Global IT Robotic Automation Industry Volume K Unit Forecast, by Country 2019 & 2032
- Table 123: Global IT Robotic Automation Industry Revenue Million Forecast, by Deployment 2019 & 2032
- Table 124: Global IT Robotic Automation Industry Volume K Unit Forecast, by Deployment 2019 & 2032
- Table 125: Global IT Robotic Automation Industry Revenue Million Forecast, by Solution 2019 & 2032
- Table 126: Global IT Robotic Automation Industry Volume K Unit Forecast, by Solution 2019 & 2032
- Table 127: Global IT Robotic Automation Industry Revenue Million Forecast, by Size of Enterprise 2019 & 2032
- Table 128: Global IT Robotic Automation Industry Volume K Unit Forecast, by Size of Enterprise 2019 & 2032
- Table 129: Global IT Robotic Automation Industry Revenue Million Forecast, by End User Industry 2019 & 2032
- Table 130: Global IT Robotic Automation Industry Volume K Unit Forecast, by End User Industry 2019 & 2032
- Table 131: Global IT Robotic Automation Industry Revenue Million Forecast, by Country 2019 & 2032
- Table 132: Global IT Robotic Automation Industry Volume K Unit Forecast, by Country 2019 & 2032
- Table 133: Global IT Robotic Automation Industry Revenue Million Forecast, by Deployment 2019 & 2032
- Table 134: Global IT Robotic Automation Industry Volume K Unit Forecast, by Deployment 2019 & 2032
- Table 135: Global IT Robotic Automation Industry Revenue Million Forecast, by Solution 2019 & 2032
- Table 136: Global IT Robotic Automation Industry Volume K Unit Forecast, by Solution 2019 & 2032
- Table 137: Global IT Robotic Automation Industry Revenue Million Forecast, by Size of Enterprise 2019 & 2032
- Table 138: Global IT Robotic Automation Industry Volume K Unit Forecast, by Size of Enterprise 2019 & 2032
- Table 139: Global IT Robotic Automation Industry Revenue Million Forecast, by End User Industry 2019 & 2032
- Table 140: Global IT Robotic Automation Industry Volume K Unit Forecast, by End User Industry 2019 & 2032
- Table 141: Global IT Robotic Automation Industry Revenue Million Forecast, by Country 2019 & 2032
- Table 142: Global IT Robotic Automation Industry Volume K Unit Forecast, by Country 2019 & 2032
- Table 143: Global IT Robotic Automation Industry Revenue Million Forecast, by Deployment 2019 & 2032
- Table 144: Global IT Robotic Automation Industry Volume K Unit Forecast, by Deployment 2019 & 2032
- Table 145: Global IT Robotic Automation Industry Revenue Million Forecast, by Solution 2019 & 2032
- Table 146: Global IT Robotic Automation Industry Volume K Unit Forecast, by Solution 2019 & 2032
- Table 147: Global IT Robotic Automation Industry Revenue Million Forecast, by Size of Enterprise 2019 & 2032
- Table 148: Global IT Robotic Automation Industry Volume K Unit Forecast, by Size of Enterprise 2019 & 2032
- Table 149: Global IT Robotic Automation Industry Revenue Million Forecast, by End User Industry 2019 & 2032
- Table 150: Global IT Robotic Automation Industry Volume K Unit Forecast, by End User Industry 2019 & 2032
- Table 151: Global IT Robotic Automation Industry Revenue Million Forecast, by Country 2019 & 2032
- Table 152: Global IT Robotic Automation Industry Volume K Unit Forecast, by Country 2019 & 2032
Frequently Asked Questions
1. What is the projected Compound Annual Growth Rate (CAGR) of the IT Robotic Automation Industry?
The projected CAGR is approximately 29.70%.
2. Which companies are prominent players in the IT Robotic Automation Industry?
Key companies in the market include Jacada Inc, Nice Robotic Automation Ltd, Kofax Inc (Thoma Bravo LLC), HelpSystems LLC (HGGC), Jidoka, UIPath Inc, Datamatics Global Services Limited, Automation Anywhere Inc, Be Informed BV (Hoogenberg Beheer BV), Pegasystems Inc, AutomationEdge Technologies Inc, Blue Prism Group PLC, CGI Inc.
3. What are the main segments of the IT Robotic Automation Industry?
The market segments include Deployment, Solution, Size of Enterprise, End User Industry.
4. Can you provide details about the market size?
The market size is estimated to be USD 4.02 Million as of 2022.
5. What are some drivers contributing to market growth?
Retail Sector to hold major share in RPA Market; Adoption of AI- and Cloud-based Solutions for Internal Efficiency among SMEs.
6. What are the notable trends driving market growth?
Retail Sector to hold major share in RPA Market.
7. Are there any restraints impacting market growth?
Data Security Concerns.
8. Can you provide examples of recent developments in the market?
September 2022 - UiPath, a leading enterprise automation software company, strengthened its partnership with Snowflake, the Data Cloud company, by launching a new bi-directional integration that extends the value of automation across the enterprise. UiPath and Snowflake enable joint customers to design and build workflows based on 360-degree views of trusted and accessible data on Snowflake's platform. By leveraging the Snowflake Data Cloud, UiPath robots can quickly connect data directly to business processes in the Data Cloud without using complex code, speeding up time to value.
9. What pricing options are available for accessing the report?
Pricing options include single-user, multi-user, and enterprise licenses priced at USD 4750, USD 5250, and USD 8750 respectively.
10. Is the market size provided in terms of value or volume?
The market size is provided in terms of value, measured in Million and volume, measured in K Unit.
11. Are there any specific market keywords associated with the report?
Yes, the market keyword associated with the report is "IT Robotic Automation Industry," which aids in identifying and referencing the specific market segment covered.
12. How do I determine which pricing option suits my needs best?
The pricing options vary based on user requirements and access needs. Individual users may opt for single-user licenses, while businesses requiring broader access may choose multi-user or enterprise licenses for cost-effective access to the report.
13. Are there any additional resources or data provided in the IT Robotic Automation Industry report?
While the report offers comprehensive insights, it's advisable to review the specific contents or supplementary materials provided to ascertain if additional resources or data are available.
14. How can I stay updated on further developments or reports in the IT Robotic Automation Industry?
To stay informed about further developments, trends, and reports in the IT Robotic Automation Industry, consider subscribing to industry newsletters, following relevant companies and organizations, or regularly checking reputable industry news sources and publications.
Methodology
Step 1 - Identification of Relevant Samples Size from Population Database


Step 2 - Approaches for Defining Global Market Size (Value, Volume* & Price*)

Note*: In applicable scenarios
Step 3 - Data Sources
Primary Research
- Web Analytics
- Survey Reports
- Research Institute
- Latest Research Reports
- Opinion Leaders
Secondary Research
- Annual Reports
- White Paper
- Latest Press Release
- Industry Association
- Paid Database
- Investor Presentations

Step 4 - Data Triangulation
Involves using different sources of information in order to increase the validity of a study
These sources are likely to be stakeholders in a program - participants, other researchers, program staff, other community members, and so on.
Then we put all data in single framework & apply various statistical tools to find out the dynamic on the market.
During the analysis stage, feedback from the stakeholder groups would be compared to determine areas of agreement as well as areas of divergence


