
Key Insights
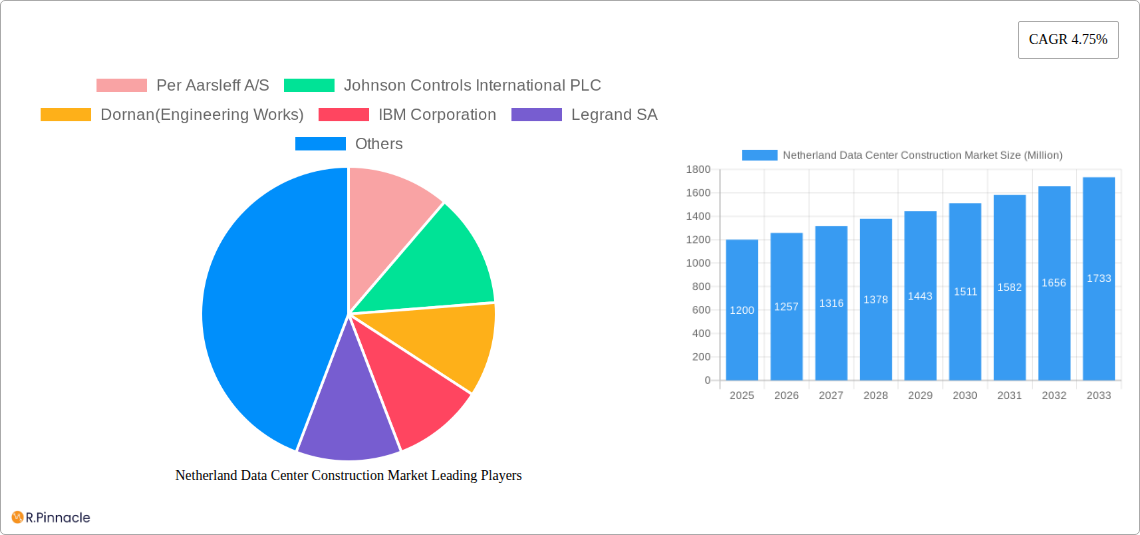
The Netherlands data center construction market, valued at €1.2 billion in 2025, is projected to experience robust growth, driven by increasing digitalization, cloud adoption, and the nation's strategic location within Europe. A compound annual growth rate (CAGR) of 4.75% from 2025 to 2033 indicates a substantial market expansion, reaching an estimated €1.8 billion by 2033. Key drivers include the burgeoning e-commerce sector, growing demand for high-performance computing, and government initiatives promoting digital infrastructure development. The market is segmented by tier type (Tier 1-4), data center size (small to massive), infrastructure components (cooling, power, security, etc.), and end-user industries (IT & telecommunications, BFSI, government, healthcare). While the precise market share for each segment isn't provided, it's reasonable to assume that Tier III and IV data centers, alongside large and mega-scale facilities, will dominate due to their ability to accommodate significant capacity and redundancy requirements. The competitive landscape features both international players like Schneider Electric and IBM, alongside local and regional contractors specializing in data center construction. Challenges may include securing skilled labor, navigating strict environmental regulations, and ensuring energy efficiency in these facilities. The robust growth trajectory is expected to continue, fueled by the Netherlands' position as a pivotal data hub in Europe. Future growth will likely be influenced by government policies supporting sustainable data center development and the increasing adoption of edge computing.
The substantial growth forecast for the Netherlands data center construction market presents significant opportunities for companies across the value chain. The rising demand for advanced infrastructure components such as high-density cooling systems and advanced power distribution units (PDUs) will drive innovation and investment. Furthermore, the focus on sustainability will necessitate the adoption of green energy solutions and energy-efficient technologies within data center designs. The increasing complexity of data center projects will also boost the demand for specialized design and consulting services, potentially increasing the market share of established engineering and architectural firms. Competition is likely to intensify as established players seek to consolidate their market position, and new entrants emerge with innovative solutions and business models. However, the sustained economic growth in the Netherlands and continued expansion of digital services across multiple sectors are poised to support market expansion throughout the forecast period.
This comprehensive report provides an in-depth analysis of the Netherland Data Center Construction Market, offering invaluable insights for industry professionals, investors, and strategic decision-makers. Covering the period from 2019 to 2033, with a base year of 2025, this report meticulously examines market dynamics, segment performance, key players, and future growth prospects. The study encompasses detailed segmentation by Tier Type (Tier 1, Tier 2, Tier 3), Data Center Size (Small, Medium, Large, Mega, Massive), Infrastructure (Cooling Infrastructure, Evaporative Cooling, Power Infrastructure, Power Distribution Unit (PDU), Racks and Cabinets, Servers Networking Equipment, Physical Security Infrastructure, Design and Consulting Services, Other Infrastructure), and End User (IT & Telecommunication, BFSI, Government, Healthcare, Other End User).
Netherland Data Center Construction Market Structure & Innovation Trends
The Netherland Data Center Construction Market exhibits a moderately consolidated structure, with several multinational corporations holding significant market share. Key players like Per Aarsleff A/S, Johnson Controls International PLC, and Schneider Electric SE contribute significantly to the overall market value. The market share of the top 5 players is estimated at xx%. Innovation is driven by the increasing demand for higher energy efficiency, enhanced security, and advanced data management capabilities. Regulatory frameworks, including environmental regulations and data privacy laws, significantly influence market development. Product substitution is limited, with most components being specialized for data center applications. The M&A activity in this sector has been moderate, with a total deal value of approximately xx Million in the past five years, primarily driven by strategic acquisitions to expand market presence and technological capabilities. The end-user demographics are heavily weighted towards the IT & Telecommunication and BFSI sectors, representing xx% and xx% of the market respectively.

Netherland Data Center Construction Market Market Dynamics & Trends
The Netherland Data Center Construction Market is experiencing robust growth, driven by the increasing adoption of cloud computing, big data analytics, and the Internet of Things (IoT). The market is projected to achieve a Compound Annual Growth Rate (CAGR) of xx% during the forecast period (2025-2033). This growth is further fueled by government initiatives promoting digital transformation and investments in digital infrastructure. Technological disruptions, such as the introduction of advanced cooling technologies (e.g., liquid cooling) and the adoption of modular data center designs, are transforming market dynamics. Consumer preference for high availability, low latency, and enhanced security is pushing the demand for advanced infrastructure solutions. Competitive dynamics are characterized by intense rivalry among established players and emerging companies focusing on niche solutions. Market penetration for advanced cooling solutions is currently estimated at xx%, projected to reach xx% by 2033.
Dominant Regions & Segments in Netherland Data Center Construction Market
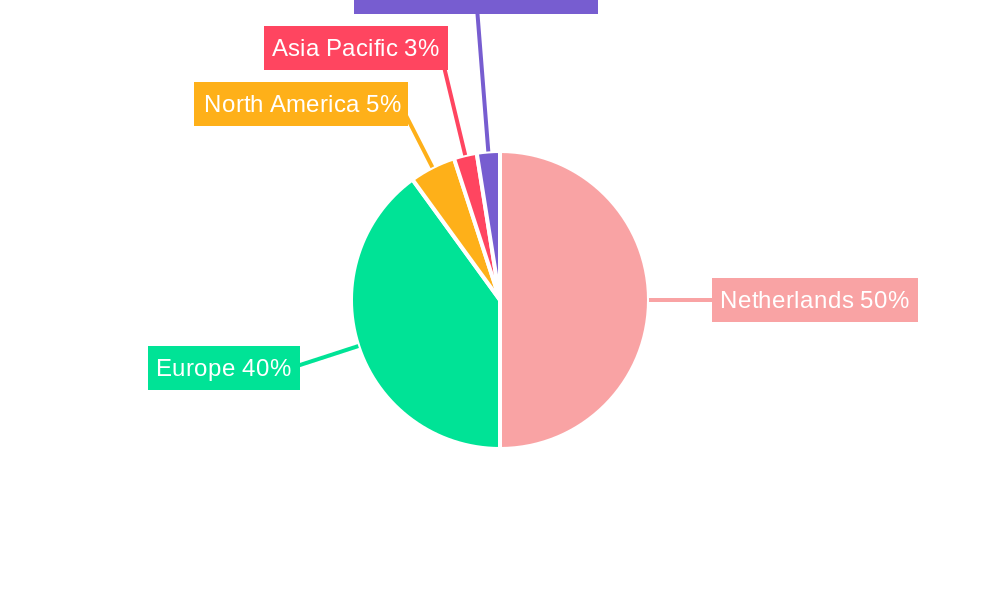
The Netherlands' major metropolitan areas such as Amsterdam, Rotterdam, and The Hague, are the dominant regions for Data Center Construction due to their well-established digital infrastructure, strong connectivity, and access to skilled labor.
- Key Drivers for Dominant Regions:
- Strong digital infrastructure and connectivity.
- Supportive government policies and investment incentives.
- Availability of skilled workforce.
- Strategic location within Europe.
The largest segment by Tier Type is Tier 3, driven by the demand for scalable and reliable solutions. Within Data Center Size, the Large and Mega segments are experiencing the fastest growth, reflecting the increasing demand for high-capacity data centers. The Power Infrastructure segment holds the largest market share within infrastructure components, followed closely by Cooling Infrastructure. The IT & Telecommunication sector is the dominant end-user segment, accounting for the largest share of market revenue. These segments show strong growth projections, exceeding the overall market CAGR.
Netherland Data Center Construction Market Product Innovations
Recent product innovations include the introduction of smart rack PDUs by Legrand (May 2023), offering enhanced power distribution capabilities, and the launch of Leaseweb's Ampere Altra Servers (September 2023), focused on energy efficiency and improved performance. These innovations are driven by the need for energy-efficient, scalable, and secure data center infrastructure. These products cater to the increasing demand for environmentally sustainable solutions while improving operational efficiency and providing competitive advantages in the market.
Report Scope & Segmentation Analysis
This report segments the Netherland Data Center Construction Market by Tier Type (Tier 1, Tier 2, Tier 3), Data Center Size (Small, Medium, Large, Mega, Massive), Infrastructure (Cooling Infrastructure, Evaporative Cooling, Power Infrastructure, PDU, Racks and Cabinets, Servers Networking Equipment, Physical Security Infrastructure, Design and Consulting Services, Other Infrastructure), and End User (IT & Telecommunication, BFSI, Government, Healthcare, Other End User). Each segment's growth projections, market size estimates, and competitive dynamics are thoroughly analyzed. For example, the Cooling Infrastructure segment is expected to witness significant growth driven by the increasing need for efficient heat dissipation. The IT & Telecommunication sector consistently drives a major portion of the market demand across all infrastructure segments.
Key Drivers of Netherland Data Center Construction Market Growth
Several factors drive the growth of the Netherland Data Center Construction Market. These include the burgeoning digital economy, the expansion of cloud computing and data centers, increasing demand for high-speed internet and advanced technologies, government investments in infrastructure, and the growing need for secure and resilient digital infrastructure. The strong presence of multinational technology companies and data center operators within the Netherlands further fuels the market growth.
Challenges in the Netherland Data Center Construction Market Sector
Challenges faced by the sector include securing necessary permits and approvals due to regulations, potential supply chain disruptions affecting the availability of critical components, and intense competition among numerous market players. The environmental impact of data centers and the increasing scarcity of skilled labor in the construction and management of data center infrastructure also pose significant challenges.
Emerging Opportunities in Netherland Data Center Construction Market
Emerging opportunities include the adoption of sustainable technologies, such as liquid cooling and renewable energy sources, within data center operations. The rising demand for edge computing creates opportunities for the development and deployment of smaller, decentralized data centers. The growing focus on data center security and the increasing integration of AI and machine learning in data center management offer additional opportunities for growth and innovation.
Leading Players in the Netherland Data Center Construction Market Market
- Per Aarsleff A/S
- Johnson Controls International PLC
- Dornan(Engineering Works)
- IBM Corporation
- Legrand SA
- ALFA LAVAL AB
- Schneider Electric SE
- Arista Networks
- DPR Construction Inc
- Stulz GmbH
- Arup Group Limited
- Kirby Group Engineering
- AECOM
- Coromatic AB Sweden
Key Developments in Netherland Data Center Construction Market Industry
December 2023: Google commenced construction of a new data center in Winschoten, Groningen, Netherlands, with a planned investment of USD 655.1 Million. This signifies substantial investment in the Dutch data center market and underscores the country's attractiveness to major technology companies.
September 2023: Leaseweb introduced Leaseweb Dedicated Ampere Altra Servers, promoting energy-efficient and high-performing cloud native servers, accelerating digital transformation for businesses in the Netherlands. This indicates a shift towards more sustainable and efficient data center infrastructure.
May 2023: Legrand launched smart rack PDUs, addressing evolving power distribution demands in data centers. This showcases continuous innovation in data center infrastructure technologies.
Future Outlook for Netherland Data Center Construction Market Market
The Netherland Data Center Construction Market is poised for sustained growth, driven by ongoing digitalization, investments in advanced technologies, and the increasing demand for robust digital infrastructure. The focus on sustainability and energy efficiency will shape future market trends, with increased adoption of green technologies and practices. Strategic partnerships and collaborations among industry players will play a key role in driving market expansion and technological advancements. The market's robust growth trajectory is expected to continue throughout the forecast period, offering significant opportunities for both established and emerging players.
Netherland Data Center Construction Market Segmentation
-
1. Tier Type
- 1.1. Tier 1 and 2
- 1.2. Tier 3
- 1.3. Tier 4
-
2. Data Center Size
- 2.1. Small
- 2.2. Medium
- 2.3. Large
- 2.4. Mega
- 2.5. Massive
-
3. Infrastructure
-
3.1. Cooling Infrastructure
- 3.1.1. Air-based Cooling
- 3.1.2. Liquid-based Cooling
- 3.1.3. Evaporative Cooling
-
3.2. Power Infrastructure
- 3.2.1. UPS Systems
- 3.2.2. Generators
- 3.2.3. Power Distribution Unit (PDU)
- 3.3. Racks and Cabinets
- 3.4. Servers
- 3.5. Networking Equipment
- 3.6. Physical Security Infrastructure
- 3.7. Design and Consulting Services
- 3.8. Other Infrastructure
-
3.1. Cooling Infrastructure
-
4. End User
- 4.1. IT & Telecommunication
- 4.2. BFSI
- 4.3. Government
- 4.4. Healthcare
- 4.5. Other End User
Netherland Data Center Construction Market Segmentation By Geography
-
1. North America
- 1.1. United States
- 1.2. Canada
- 1.3. Mexico
-
2. South America
- 2.1. Brazil
- 2.2. Argentina
- 2.3. Rest of South America
-
3. Europe
- 3.1. United Kingdom
- 3.2. Germany
- 3.3. France
- 3.4. Italy
- 3.5. Spain
- 3.6. Russia
- 3.7. Benelux
- 3.8. Nordics
- 3.9. Rest of Europe
-
4. Middle East & Africa
- 4.1. Turkey
- 4.2. Israel
- 4.3. GCC
- 4.4. North Africa
- 4.5. South Africa
- 4.6. Rest of Middle East & Africa
-
5. Asia Pacific
- 5.1. China
- 5.2. India
- 5.3. Japan
- 5.4. South Korea
- 5.5. ASEAN
- 5.6. Oceania
- 5.7. Rest of Asia Pacific
Netherland Data Center Construction Market REPORT HIGHLIGHTS
| Aspects | Details |
|---|---|
| Study Period | 2019-2033 |
| Base Year | 2024 |
| Estimated Year | 2025 |
| Forecast Period | 2025-2033 |
| Historical Period | 2019-2024 |
| Growth Rate | CAGR of 4.75% from 2019-2033 |
| Segmentation |
|
Table of Contents
- 1. Introduction
- 1.1. Research Scope
- 1.2. Market Segmentation
- 1.3. Research Methodology
- 1.4. Definitions and Assumptions
- 2. Executive Summary
- 2.1. Introduction
- 3. Market Dynamics
- 3.1. Introduction
- 3.2. Market Drivers
- 3.2.1. 5G Developments Fuelling Data Center Investments; Growing Cloud Servce adoption; Green Data Centers Rising Awareness of Carbon-neutrality Leading to Infrastructure Upgrades
- 3.3. Market Restrains
- 3.3.1. Security Challenges Impacting Growth of Data Centers
- 3.4. Market Trends
- 3.4.1. IT and Telecom to Have Significant Market Share
- 4. Market Factor Analysis
- 4.1. Porters Five Forces
- 4.2. Supply/Value Chain
- 4.3. PESTEL analysis
- 4.4. Market Entropy
- 4.5. Patent/Trademark Analysis
- 5. Global Netherland Data Center Construction Market Analysis, Insights and Forecast, 2019-2031
- 5.1. Market Analysis, Insights and Forecast - by Tier Type
- 5.1.1. Tier 1 and 2
- 5.1.2. Tier 3
- 5.1.3. Tier 4
- 5.2. Market Analysis, Insights and Forecast - by Data Center Size
- 5.2.1. Small
- 5.2.2. Medium
- 5.2.3. Large
- 5.2.4. Mega
- 5.2.5. Massive
- 5.3. Market Analysis, Insights and Forecast - by Infrastructure
- 5.3.1. Cooling Infrastructure
- 5.3.1.1. Air-based Cooling
- 5.3.1.2. Liquid-based Cooling
- 5.3.1.3. Evaporative Cooling
- 5.3.2. Power Infrastructure
- 5.3.2.1. UPS Systems
- 5.3.2.2. Generators
- 5.3.2.3. Power Distribution Unit (PDU)
- 5.3.3. Racks and Cabinets
- 5.3.4. Servers
- 5.3.5. Networking Equipment
- 5.3.6. Physical Security Infrastructure
- 5.3.7. Design and Consulting Services
- 5.3.8. Other Infrastructure
- 5.3.1. Cooling Infrastructure
- 5.4. Market Analysis, Insights and Forecast - by End User
- 5.4.1. IT & Telecommunication
- 5.4.2. BFSI
- 5.4.3. Government
- 5.4.4. Healthcare
- 5.4.5. Other End User
- 5.5. Market Analysis, Insights and Forecast - by Region
- 5.5.1. North America
- 5.5.2. South America
- 5.5.3. Europe
- 5.5.4. Middle East & Africa
- 5.5.5. Asia Pacific
- 5.1. Market Analysis, Insights and Forecast - by Tier Type
- 6. North America Netherland Data Center Construction Market Analysis, Insights and Forecast, 2019-2031
- 6.1. Market Analysis, Insights and Forecast - by Tier Type
- 6.1.1. Tier 1 and 2
- 6.1.2. Tier 3
- 6.1.3. Tier 4
- 6.2. Market Analysis, Insights and Forecast - by Data Center Size
- 6.2.1. Small
- 6.2.2. Medium
- 6.2.3. Large
- 6.2.4. Mega
- 6.2.5. Massive
- 6.3. Market Analysis, Insights and Forecast - by Infrastructure
- 6.3.1. Cooling Infrastructure
- 6.3.1.1. Air-based Cooling
- 6.3.1.2. Liquid-based Cooling
- 6.3.1.3. Evaporative Cooling
- 6.3.2. Power Infrastructure
- 6.3.2.1. UPS Systems
- 6.3.2.2. Generators
- 6.3.2.3. Power Distribution Unit (PDU)
- 6.3.3. Racks and Cabinets
- 6.3.4. Servers
- 6.3.5. Networking Equipment
- 6.3.6. Physical Security Infrastructure
- 6.3.7. Design and Consulting Services
- 6.3.8. Other Infrastructure
- 6.3.1. Cooling Infrastructure
- 6.4. Market Analysis, Insights and Forecast - by End User
- 6.4.1. IT & Telecommunication
- 6.4.2. BFSI
- 6.4.3. Government
- 6.4.4. Healthcare
- 6.4.5. Other End User
- 6.1. Market Analysis, Insights and Forecast - by Tier Type
- 7. South America Netherland Data Center Construction Market Analysis, Insights and Forecast, 2019-2031
- 7.1. Market Analysis, Insights and Forecast - by Tier Type
- 7.1.1. Tier 1 and 2
- 7.1.2. Tier 3
- 7.1.3. Tier 4
- 7.2. Market Analysis, Insights and Forecast - by Data Center Size
- 7.2.1. Small
- 7.2.2. Medium
- 7.2.3. Large
- 7.2.4. Mega
- 7.2.5. Massive
- 7.3. Market Analysis, Insights and Forecast - by Infrastructure
- 7.3.1. Cooling Infrastructure
- 7.3.1.1. Air-based Cooling
- 7.3.1.2. Liquid-based Cooling
- 7.3.1.3. Evaporative Cooling
- 7.3.2. Power Infrastructure
- 7.3.2.1. UPS Systems
- 7.3.2.2. Generators
- 7.3.2.3. Power Distribution Unit (PDU)
- 7.3.3. Racks and Cabinets
- 7.3.4. Servers
- 7.3.5. Networking Equipment
- 7.3.6. Physical Security Infrastructure
- 7.3.7. Design and Consulting Services
- 7.3.8. Other Infrastructure
- 7.3.1. Cooling Infrastructure
- 7.4. Market Analysis, Insights and Forecast - by End User
- 7.4.1. IT & Telecommunication
- 7.4.2. BFSI
- 7.4.3. Government
- 7.4.4. Healthcare
- 7.4.5. Other End User
- 7.1. Market Analysis, Insights and Forecast - by Tier Type
- 8. Europe Netherland Data Center Construction Market Analysis, Insights and Forecast, 2019-2031
- 8.1. Market Analysis, Insights and Forecast - by Tier Type
- 8.1.1. Tier 1 and 2
- 8.1.2. Tier 3
- 8.1.3. Tier 4
- 8.2. Market Analysis, Insights and Forecast - by Data Center Size
- 8.2.1. Small
- 8.2.2. Medium
- 8.2.3. Large
- 8.2.4. Mega
- 8.2.5. Massive
- 8.3. Market Analysis, Insights and Forecast - by Infrastructure
- 8.3.1. Cooling Infrastructure
- 8.3.1.1. Air-based Cooling
- 8.3.1.2. Liquid-based Cooling
- 8.3.1.3. Evaporative Cooling
- 8.3.2. Power Infrastructure
- 8.3.2.1. UPS Systems
- 8.3.2.2. Generators
- 8.3.2.3. Power Distribution Unit (PDU)
- 8.3.3. Racks and Cabinets
- 8.3.4. Servers
- 8.3.5. Networking Equipment
- 8.3.6. Physical Security Infrastructure
- 8.3.7. Design and Consulting Services
- 8.3.8. Other Infrastructure
- 8.3.1. Cooling Infrastructure
- 8.4. Market Analysis, Insights and Forecast - by End User
- 8.4.1. IT & Telecommunication
- 8.4.2. BFSI
- 8.4.3. Government
- 8.4.4. Healthcare
- 8.4.5. Other End User
- 8.1. Market Analysis, Insights and Forecast - by Tier Type
- 9. Middle East & Africa Netherland Data Center Construction Market Analysis, Insights and Forecast, 2019-2031
- 9.1. Market Analysis, Insights and Forecast - by Tier Type
- 9.1.1. Tier 1 and 2
- 9.1.2. Tier 3
- 9.1.3. Tier 4
- 9.2. Market Analysis, Insights and Forecast - by Data Center Size
- 9.2.1. Small
- 9.2.2. Medium
- 9.2.3. Large
- 9.2.4. Mega
- 9.2.5. Massive
- 9.3. Market Analysis, Insights and Forecast - by Infrastructure
- 9.3.1. Cooling Infrastructure
- 9.3.1.1. Air-based Cooling
- 9.3.1.2. Liquid-based Cooling
- 9.3.1.3. Evaporative Cooling
- 9.3.2. Power Infrastructure
- 9.3.2.1. UPS Systems
- 9.3.2.2. Generators
- 9.3.2.3. Power Distribution Unit (PDU)
- 9.3.3. Racks and Cabinets
- 9.3.4. Servers
- 9.3.5. Networking Equipment
- 9.3.6. Physical Security Infrastructure
- 9.3.7. Design and Consulting Services
- 9.3.8. Other Infrastructure
- 9.3.1. Cooling Infrastructure
- 9.4. Market Analysis, Insights and Forecast - by End User
- 9.4.1. IT & Telecommunication
- 9.4.2. BFSI
- 9.4.3. Government
- 9.4.4. Healthcare
- 9.4.5. Other End User
- 9.1. Market Analysis, Insights and Forecast - by Tier Type
- 10. Asia Pacific Netherland Data Center Construction Market Analysis, Insights and Forecast, 2019-2031
- 10.1. Market Analysis, Insights and Forecast - by Tier Type
- 10.1.1. Tier 1 and 2
- 10.1.2. Tier 3
- 10.1.3. Tier 4
- 10.2. Market Analysis, Insights and Forecast - by Data Center Size
- 10.2.1. Small
- 10.2.2. Medium
- 10.2.3. Large
- 10.2.4. Mega
- 10.2.5. Massive
- 10.3. Market Analysis, Insights and Forecast - by Infrastructure
- 10.3.1. Cooling Infrastructure
- 10.3.1.1. Air-based Cooling
- 10.3.1.2. Liquid-based Cooling
- 10.3.1.3. Evaporative Cooling
- 10.3.2. Power Infrastructure
- 10.3.2.1. UPS Systems
- 10.3.2.2. Generators
- 10.3.2.3. Power Distribution Unit (PDU)
- 10.3.3. Racks and Cabinets
- 10.3.4. Servers
- 10.3.5. Networking Equipment
- 10.3.6. Physical Security Infrastructure
- 10.3.7. Design and Consulting Services
- 10.3.8. Other Infrastructure
- 10.3.1. Cooling Infrastructure
- 10.4. Market Analysis, Insights and Forecast - by End User
- 10.4.1. IT & Telecommunication
- 10.4.2. BFSI
- 10.4.3. Government
- 10.4.4. Healthcare
- 10.4.5. Other End User
- 10.1. Market Analysis, Insights and Forecast - by Tier Type
- 11. North America Netherland Data Center Construction Market Analysis, Insights and Forecast, 2019-2031
- 11.1. Market Analysis, Insights and Forecast - By Country/Sub-region
- 11.1.1. undefined
- 12. Europe Netherland Data Center Construction Market Analysis, Insights and Forecast, 2019-2031
- 12.1. Market Analysis, Insights and Forecast - By Country/Sub-region
- 12.1.1. undefined
- 13. Asia Pacific Netherland Data Center Construction Market Analysis, Insights and Forecast, 2019-2031
- 13.1. Market Analysis, Insights and Forecast - By Country/Sub-region
- 13.1.1. undefined
- 14. Rest of the World Netherland Data Center Construction Market Analysis, Insights and Forecast, 2019-2031
- 14.1. Market Analysis, Insights and Forecast - By Country/Sub-region
- 14.1.1. undefined
- 15. Competitive Analysis
- 15.1. Global Market Share Analysis 2024
- 15.2. Company Profiles
- 15.2.1 Per Aarsleff A/S
- 15.2.1.1. Overview
- 15.2.1.2. Products
- 15.2.1.3. SWOT Analysis
- 15.2.1.4. Recent Developments
- 15.2.1.5. Financials (Based on Availability)
- 15.2.2 Johnson Controls International PLC
- 15.2.2.1. Overview
- 15.2.2.2. Products
- 15.2.2.3. SWOT Analysis
- 15.2.2.4. Recent Developments
- 15.2.2.5. Financials (Based on Availability)
- 15.2.3 Dornan(Engineering Works)
- 15.2.3.1. Overview
- 15.2.3.2. Products
- 15.2.3.3. SWOT Analysis
- 15.2.3.4. Recent Developments
- 15.2.3.5. Financials (Based on Availability)
- 15.2.4 IBM Corporation
- 15.2.4.1. Overview
- 15.2.4.2. Products
- 15.2.4.3. SWOT Analysis
- 15.2.4.4. Recent Developments
- 15.2.4.5. Financials (Based on Availability)
- 15.2.5 Legrand SA
- 15.2.5.1. Overview
- 15.2.5.2. Products
- 15.2.5.3. SWOT Analysis
- 15.2.5.4. Recent Developments
- 15.2.5.5. Financials (Based on Availability)
- 15.2.6 ALFA LAVAL AB
- 15.2.6.1. Overview
- 15.2.6.2. Products
- 15.2.6.3. SWOT Analysis
- 15.2.6.4. Recent Developments
- 15.2.6.5. Financials (Based on Availability)
- 15.2.7 Schneider Electric SE
- 15.2.7.1. Overview
- 15.2.7.2. Products
- 15.2.7.3. SWOT Analysis
- 15.2.7.4. Recent Developments
- 15.2.7.5. Financials (Based on Availability)
- 15.2.8 Arista Networks
- 15.2.8.1. Overview
- 15.2.8.2. Products
- 15.2.8.3. SWOT Analysis
- 15.2.8.4. Recent Developments
- 15.2.8.5. Financials (Based on Availability)
- 15.2.9 DPR Construction Inc
- 15.2.9.1. Overview
- 15.2.9.2. Products
- 15.2.9.3. SWOT Analysis
- 15.2.9.4. Recent Developments
- 15.2.9.5. Financials (Based on Availability)
- 15.2.10 Stulz GmbH
- 15.2.10.1. Overview
- 15.2.10.2. Products
- 15.2.10.3. SWOT Analysis
- 15.2.10.4. Recent Developments
- 15.2.10.5. Financials (Based on Availability)
- 15.2.11 Arup Group Limited
- 15.2.11.1. Overview
- 15.2.11.2. Products
- 15.2.11.3. SWOT Analysis
- 15.2.11.4. Recent Developments
- 15.2.11.5. Financials (Based on Availability)
- 15.2.12 Kirby Group Engineering
- 15.2.12.1. Overview
- 15.2.12.2. Products
- 15.2.12.3. SWOT Analysis
- 15.2.12.4. Recent Developments
- 15.2.12.5. Financials (Based on Availability)
- 15.2.13 AECOM
- 15.2.13.1. Overview
- 15.2.13.2. Products
- 15.2.13.3. SWOT Analysis
- 15.2.13.4. Recent Developments
- 15.2.13.5. Financials (Based on Availability)
- 15.2.14 Coromatic AB Sweden
- 15.2.14.1. Overview
- 15.2.14.2. Products
- 15.2.14.3. SWOT Analysis
- 15.2.14.4. Recent Developments
- 15.2.14.5. Financials (Based on Availability)
- 15.2.1 Per Aarsleff A/S
List of Figures
- Figure 1: Global Netherland Data Center Construction Market Revenue Breakdown (Million, %) by Region 2024 & 2032
- Figure 2: Global Netherland Data Center Construction Market Volume Breakdown (K Unit, %) by Region 2024 & 2032
- Figure 3: North America Netherland Data Center Construction Market Revenue (Million), by Country 2024 & 2032
- Figure 4: North America Netherland Data Center Construction Market Volume (K Unit), by Country 2024 & 2032
- Figure 5: North America Netherland Data Center Construction Market Revenue Share (%), by Country 2024 & 2032
- Figure 6: North America Netherland Data Center Construction Market Volume Share (%), by Country 2024 & 2032
- Figure 7: Europe Netherland Data Center Construction Market Revenue (Million), by Country 2024 & 2032
- Figure 8: Europe Netherland Data Center Construction Market Volume (K Unit), by Country 2024 & 2032
- Figure 9: Europe Netherland Data Center Construction Market Revenue Share (%), by Country 2024 & 2032
- Figure 10: Europe Netherland Data Center Construction Market Volume Share (%), by Country 2024 & 2032
- Figure 11: Asia Pacific Netherland Data Center Construction Market Revenue (Million), by Country 2024 & 2032
- Figure 12: Asia Pacific Netherland Data Center Construction Market Volume (K Unit), by Country 2024 & 2032
- Figure 13: Asia Pacific Netherland Data Center Construction Market Revenue Share (%), by Country 2024 & 2032
- Figure 14: Asia Pacific Netherland Data Center Construction Market Volume Share (%), by Country 2024 & 2032
- Figure 15: Rest of the World Netherland Data Center Construction Market Revenue (Million), by Country 2024 & 2032
- Figure 16: Rest of the World Netherland Data Center Construction Market Volume (K Unit), by Country 2024 & 2032
- Figure 17: Rest of the World Netherland Data Center Construction Market Revenue Share (%), by Country 2024 & 2032
- Figure 18: Rest of the World Netherland Data Center Construction Market Volume Share (%), by Country 2024 & 2032
- Figure 19: North America Netherland Data Center Construction Market Revenue (Million), by Tier Type 2024 & 2032
- Figure 20: North America Netherland Data Center Construction Market Volume (K Unit), by Tier Type 2024 & 2032
- Figure 21: North America Netherland Data Center Construction Market Revenue Share (%), by Tier Type 2024 & 2032
- Figure 22: North America Netherland Data Center Construction Market Volume Share (%), by Tier Type 2024 & 2032
- Figure 23: North America Netherland Data Center Construction Market Revenue (Million), by Data Center Size 2024 & 2032
- Figure 24: North America Netherland Data Center Construction Market Volume (K Unit), by Data Center Size 2024 & 2032
- Figure 25: North America Netherland Data Center Construction Market Revenue Share (%), by Data Center Size 2024 & 2032
- Figure 26: North America Netherland Data Center Construction Market Volume Share (%), by Data Center Size 2024 & 2032
- Figure 27: North America Netherland Data Center Construction Market Revenue (Million), by Infrastructure 2024 & 2032
- Figure 28: North America Netherland Data Center Construction Market Volume (K Unit), by Infrastructure 2024 & 2032
- Figure 29: North America Netherland Data Center Construction Market Revenue Share (%), by Infrastructure 2024 & 2032
- Figure 30: North America Netherland Data Center Construction Market Volume Share (%), by Infrastructure 2024 & 2032
- Figure 31: North America Netherland Data Center Construction Market Revenue (Million), by End User 2024 & 2032
- Figure 32: North America Netherland Data Center Construction Market Volume (K Unit), by End User 2024 & 2032
- Figure 33: North America Netherland Data Center Construction Market Revenue Share (%), by End User 2024 & 2032
- Figure 34: North America Netherland Data Center Construction Market Volume Share (%), by End User 2024 & 2032
- Figure 35: North America Netherland Data Center Construction Market Revenue (Million), by Country 2024 & 2032
- Figure 36: North America Netherland Data Center Construction Market Volume (K Unit), by Country 2024 & 2032
- Figure 37: North America Netherland Data Center Construction Market Revenue Share (%), by Country 2024 & 2032
- Figure 38: North America Netherland Data Center Construction Market Volume Share (%), by Country 2024 & 2032
- Figure 39: South America Netherland Data Center Construction Market Revenue (Million), by Tier Type 2024 & 2032
- Figure 40: South America Netherland Data Center Construction Market Volume (K Unit), by Tier Type 2024 & 2032
- Figure 41: South America Netherland Data Center Construction Market Revenue Share (%), by Tier Type 2024 & 2032
- Figure 42: South America Netherland Data Center Construction Market Volume Share (%), by Tier Type 2024 & 2032
- Figure 43: South America Netherland Data Center Construction Market Revenue (Million), by Data Center Size 2024 & 2032
- Figure 44: South America Netherland Data Center Construction Market Volume (K Unit), by Data Center Size 2024 & 2032
- Figure 45: South America Netherland Data Center Construction Market Revenue Share (%), by Data Center Size 2024 & 2032
- Figure 46: South America Netherland Data Center Construction Market Volume Share (%), by Data Center Size 2024 & 2032
- Figure 47: South America Netherland Data Center Construction Market Revenue (Million), by Infrastructure 2024 & 2032
- Figure 48: South America Netherland Data Center Construction Market Volume (K Unit), by Infrastructure 2024 & 2032
- Figure 49: South America Netherland Data Center Construction Market Revenue Share (%), by Infrastructure 2024 & 2032
- Figure 50: South America Netherland Data Center Construction Market Volume Share (%), by Infrastructure 2024 & 2032
- Figure 51: South America Netherland Data Center Construction Market Revenue (Million), by End User 2024 & 2032
- Figure 52: South America Netherland Data Center Construction Market Volume (K Unit), by End User 2024 & 2032
- Figure 53: South America Netherland Data Center Construction Market Revenue Share (%), by End User 2024 & 2032
- Figure 54: South America Netherland Data Center Construction Market Volume Share (%), by End User 2024 & 2032
- Figure 55: South America Netherland Data Center Construction Market Revenue (Million), by Country 2024 & 2032
- Figure 56: South America Netherland Data Center Construction Market Volume (K Unit), by Country 2024 & 2032
- Figure 57: South America Netherland Data Center Construction Market Revenue Share (%), by Country 2024 & 2032
- Figure 58: South America Netherland Data Center Construction Market Volume Share (%), by Country 2024 & 2032
- Figure 59: Europe Netherland Data Center Construction Market Revenue (Million), by Tier Type 2024 & 2032
- Figure 60: Europe Netherland Data Center Construction Market Volume (K Unit), by Tier Type 2024 & 2032
- Figure 61: Europe Netherland Data Center Construction Market Revenue Share (%), by Tier Type 2024 & 2032
- Figure 62: Europe Netherland Data Center Construction Market Volume Share (%), by Tier Type 2024 & 2032
- Figure 63: Europe Netherland Data Center Construction Market Revenue (Million), by Data Center Size 2024 & 2032
- Figure 64: Europe Netherland Data Center Construction Market Volume (K Unit), by Data Center Size 2024 & 2032
- Figure 65: Europe Netherland Data Center Construction Market Revenue Share (%), by Data Center Size 2024 & 2032
- Figure 66: Europe Netherland Data Center Construction Market Volume Share (%), by Data Center Size 2024 & 2032
- Figure 67: Europe Netherland Data Center Construction Market Revenue (Million), by Infrastructure 2024 & 2032
- Figure 68: Europe Netherland Data Center Construction Market Volume (K Unit), by Infrastructure 2024 & 2032
- Figure 69: Europe Netherland Data Center Construction Market Revenue Share (%), by Infrastructure 2024 & 2032
- Figure 70: Europe Netherland Data Center Construction Market Volume Share (%), by Infrastructure 2024 & 2032
- Figure 71: Europe Netherland Data Center Construction Market Revenue (Million), by End User 2024 & 2032
- Figure 72: Europe Netherland Data Center Construction Market Volume (K Unit), by End User 2024 & 2032
- Figure 73: Europe Netherland Data Center Construction Market Revenue Share (%), by End User 2024 & 2032
- Figure 74: Europe Netherland Data Center Construction Market Volume Share (%), by End User 2024 & 2032
- Figure 75: Europe Netherland Data Center Construction Market Revenue (Million), by Country 2024 & 2032
- Figure 76: Europe Netherland Data Center Construction Market Volume (K Unit), by Country 2024 & 2032
- Figure 77: Europe Netherland Data Center Construction Market Revenue Share (%), by Country 2024 & 2032
- Figure 78: Europe Netherland Data Center Construction Market Volume Share (%), by Country 2024 & 2032
- Figure 79: Middle East & Africa Netherland Data Center Construction Market Revenue (Million), by Tier Type 2024 & 2032
- Figure 80: Middle East & Africa Netherland Data Center Construction Market Volume (K Unit), by Tier Type 2024 & 2032
- Figure 81: Middle East & Africa Netherland Data Center Construction Market Revenue Share (%), by Tier Type 2024 & 2032
- Figure 82: Middle East & Africa Netherland Data Center Construction Market Volume Share (%), by Tier Type 2024 & 2032
- Figure 83: Middle East & Africa Netherland Data Center Construction Market Revenue (Million), by Data Center Size 2024 & 2032
- Figure 84: Middle East & Africa Netherland Data Center Construction Market Volume (K Unit), by Data Center Size 2024 & 2032
- Figure 85: Middle East & Africa Netherland Data Center Construction Market Revenue Share (%), by Data Center Size 2024 & 2032
- Figure 86: Middle East & Africa Netherland Data Center Construction Market Volume Share (%), by Data Center Size 2024 & 2032
- Figure 87: Middle East & Africa Netherland Data Center Construction Market Revenue (Million), by Infrastructure 2024 & 2032
- Figure 88: Middle East & Africa Netherland Data Center Construction Market Volume (K Unit), by Infrastructure 2024 & 2032
- Figure 89: Middle East & Africa Netherland Data Center Construction Market Revenue Share (%), by Infrastructure 2024 & 2032
- Figure 90: Middle East & Africa Netherland Data Center Construction Market Volume Share (%), by Infrastructure 2024 & 2032
- Figure 91: Middle East & Africa Netherland Data Center Construction Market Revenue (Million), by End User 2024 & 2032
- Figure 92: Middle East & Africa Netherland Data Center Construction Market Volume (K Unit), by End User 2024 & 2032
- Figure 93: Middle East & Africa Netherland Data Center Construction Market Revenue Share (%), by End User 2024 & 2032
- Figure 94: Middle East & Africa Netherland Data Center Construction Market Volume Share (%), by End User 2024 & 2032
- Figure 95: Middle East & Africa Netherland Data Center Construction Market Revenue (Million), by Country 2024 & 2032
- Figure 96: Middle East & Africa Netherland Data Center Construction Market Volume (K Unit), by Country 2024 & 2032
- Figure 97: Middle East & Africa Netherland Data Center Construction Market Revenue Share (%), by Country 2024 & 2032
- Figure 98: Middle East & Africa Netherland Data Center Construction Market Volume Share (%), by Country 2024 & 2032
- Figure 99: Asia Pacific Netherland Data Center Construction Market Revenue (Million), by Tier Type 2024 & 2032
- Figure 100: Asia Pacific Netherland Data Center Construction Market Volume (K Unit), by Tier Type 2024 & 2032
- Figure 101: Asia Pacific Netherland Data Center Construction Market Revenue Share (%), by Tier Type 2024 & 2032
- Figure 102: Asia Pacific Netherland Data Center Construction Market Volume Share (%), by Tier Type 2024 & 2032
- Figure 103: Asia Pacific Netherland Data Center Construction Market Revenue (Million), by Data Center Size 2024 & 2032
- Figure 104: Asia Pacific Netherland Data Center Construction Market Volume (K Unit), by Data Center Size 2024 & 2032
- Figure 105: Asia Pacific Netherland Data Center Construction Market Revenue Share (%), by Data Center Size 2024 & 2032
- Figure 106: Asia Pacific Netherland Data Center Construction Market Volume Share (%), by Data Center Size 2024 & 2032
- Figure 107: Asia Pacific Netherland Data Center Construction Market Revenue (Million), by Infrastructure 2024 & 2032
- Figure 108: Asia Pacific Netherland Data Center Construction Market Volume (K Unit), by Infrastructure 2024 & 2032
- Figure 109: Asia Pacific Netherland Data Center Construction Market Revenue Share (%), by Infrastructure 2024 & 2032
- Figure 110: Asia Pacific Netherland Data Center Construction Market Volume Share (%), by Infrastructure 2024 & 2032
- Figure 111: Asia Pacific Netherland Data Center Construction Market Revenue (Million), by End User 2024 & 2032
- Figure 112: Asia Pacific Netherland Data Center Construction Market Volume (K Unit), by End User 2024 & 2032
- Figure 113: Asia Pacific Netherland Data Center Construction Market Revenue Share (%), by End User 2024 & 2032
- Figure 114: Asia Pacific Netherland Data Center Construction Market Volume Share (%), by End User 2024 & 2032
- Figure 115: Asia Pacific Netherland Data Center Construction Market Revenue (Million), by Country 2024 & 2032
- Figure 116: Asia Pacific Netherland Data Center Construction Market Volume (K Unit), by Country 2024 & 2032
- Figure 117: Asia Pacific Netherland Data Center Construction Market Revenue Share (%), by Country 2024 & 2032
- Figure 118: Asia Pacific Netherland Data Center Construction Market Volume Share (%), by Country 2024 & 2032
List of Tables
- Table 1: Global Netherland Data Center Construction Market Revenue Million Forecast, by Region 2019 & 2032
- Table 2: Global Netherland Data Center Construction Market Volume K Unit Forecast, by Region 2019 & 2032
- Table 3: Global Netherland Data Center Construction Market Revenue Million Forecast, by Tier Type 2019 & 2032
- Table 4: Global Netherland Data Center Construction Market Volume K Unit Forecast, by Tier Type 2019 & 2032
- Table 5: Global Netherland Data Center Construction Market Revenue Million Forecast, by Data Center Size 2019 & 2032
- Table 6: Global Netherland Data Center Construction Market Volume K Unit Forecast, by Data Center Size 2019 & 2032
- Table 7: Global Netherland Data Center Construction Market Revenue Million Forecast, by Infrastructure 2019 & 2032
- Table 8: Global Netherland Data Center Construction Market Volume K Unit Forecast, by Infrastructure 2019 & 2032
- Table 9: Global Netherland Data Center Construction Market Revenue Million Forecast, by End User 2019 & 2032
- Table 10: Global Netherland Data Center Construction Market Volume K Unit Forecast, by End User 2019 & 2032
- Table 11: Global Netherland Data Center Construction Market Revenue Million Forecast, by Region 2019 & 2032
- Table 12: Global Netherland Data Center Construction Market Volume K Unit Forecast, by Region 2019 & 2032
- Table 13: Global Netherland Data Center Construction Market Revenue Million Forecast, by Country 2019 & 2032
- Table 14: Global Netherland Data Center Construction Market Volume K Unit Forecast, by Country 2019 & 2032
- Table 15: Global Netherland Data Center Construction Market Revenue Million Forecast, by Country 2019 & 2032
- Table 16: Global Netherland Data Center Construction Market Volume K Unit Forecast, by Country 2019 & 2032
- Table 17: Global Netherland Data Center Construction Market Revenue Million Forecast, by Country 2019 & 2032
- Table 18: Global Netherland Data Center Construction Market Volume K Unit Forecast, by Country 2019 & 2032
- Table 19: Global Netherland Data Center Construction Market Revenue Million Forecast, by Country 2019 & 2032
- Table 20: Global Netherland Data Center Construction Market Volume K Unit Forecast, by Country 2019 & 2032
- Table 21: Global Netherland Data Center Construction Market Revenue Million Forecast, by Tier Type 2019 & 2032
- Table 22: Global Netherland Data Center Construction Market Volume K Unit Forecast, by Tier Type 2019 & 2032
- Table 23: Global Netherland Data Center Construction Market Revenue Million Forecast, by Data Center Size 2019 & 2032
- Table 24: Global Netherland Data Center Construction Market Volume K Unit Forecast, by Data Center Size 2019 & 2032
- Table 25: Global Netherland Data Center Construction Market Revenue Million Forecast, by Infrastructure 2019 & 2032
- Table 26: Global Netherland Data Center Construction Market Volume K Unit Forecast, by Infrastructure 2019 & 2032
- Table 27: Global Netherland Data Center Construction Market Revenue Million Forecast, by End User 2019 & 2032
- Table 28: Global Netherland Data Center Construction Market Volume K Unit Forecast, by End User 2019 & 2032
- Table 29: Global Netherland Data Center Construction Market Revenue Million Forecast, by Country 2019 & 2032
- Table 30: Global Netherland Data Center Construction Market Volume K Unit Forecast, by Country 2019 & 2032
- Table 31: United States Netherland Data Center Construction Market Revenue (Million) Forecast, by Application 2019 & 2032
- Table 32: United States Netherland Data Center Construction Market Volume (K Unit) Forecast, by Application 2019 & 2032
- Table 33: Canada Netherland Data Center Construction Market Revenue (Million) Forecast, by Application 2019 & 2032
- Table 34: Canada Netherland Data Center Construction Market Volume (K Unit) Forecast, by Application 2019 & 2032
- Table 35: Mexico Netherland Data Center Construction Market Revenue (Million) Forecast, by Application 2019 & 2032
- Table 36: Mexico Netherland Data Center Construction Market Volume (K Unit) Forecast, by Application 2019 & 2032
- Table 37: Global Netherland Data Center Construction Market Revenue Million Forecast, by Tier Type 2019 & 2032
- Table 38: Global Netherland Data Center Construction Market Volume K Unit Forecast, by Tier Type 2019 & 2032
- Table 39: Global Netherland Data Center Construction Market Revenue Million Forecast, by Data Center Size 2019 & 2032
- Table 40: Global Netherland Data Center Construction Market Volume K Unit Forecast, by Data Center Size 2019 & 2032
- Table 41: Global Netherland Data Center Construction Market Revenue Million Forecast, by Infrastructure 2019 & 2032
- Table 42: Global Netherland Data Center Construction Market Volume K Unit Forecast, by Infrastructure 2019 & 2032
- Table 43: Global Netherland Data Center Construction Market Revenue Million Forecast, by End User 2019 & 2032
- Table 44: Global Netherland Data Center Construction Market Volume K Unit Forecast, by End User 2019 & 2032
- Table 45: Global Netherland Data Center Construction Market Revenue Million Forecast, by Country 2019 & 2032
- Table 46: Global Netherland Data Center Construction Market Volume K Unit Forecast, by Country 2019 & 2032
- Table 47: Brazil Netherland Data Center Construction Market Revenue (Million) Forecast, by Application 2019 & 2032
- Table 48: Brazil Netherland Data Center Construction Market Volume (K Unit) Forecast, by Application 2019 & 2032
- Table 49: Argentina Netherland Data Center Construction Market Revenue (Million) Forecast, by Application 2019 & 2032
- Table 50: Argentina Netherland Data Center Construction Market Volume (K Unit) Forecast, by Application 2019 & 2032
- Table 51: Rest of South America Netherland Data Center Construction Market Revenue (Million) Forecast, by Application 2019 & 2032
- Table 52: Rest of South America Netherland Data Center Construction Market Volume (K Unit) Forecast, by Application 2019 & 2032
- Table 53: Global Netherland Data Center Construction Market Revenue Million Forecast, by Tier Type 2019 & 2032
- Table 54: Global Netherland Data Center Construction Market Volume K Unit Forecast, by Tier Type 2019 & 2032
- Table 55: Global Netherland Data Center Construction Market Revenue Million Forecast, by Data Center Size 2019 & 2032
- Table 56: Global Netherland Data Center Construction Market Volume K Unit Forecast, by Data Center Size 2019 & 2032
- Table 57: Global Netherland Data Center Construction Market Revenue Million Forecast, by Infrastructure 2019 & 2032
- Table 58: Global Netherland Data Center Construction Market Volume K Unit Forecast, by Infrastructure 2019 & 2032
- Table 59: Global Netherland Data Center Construction Market Revenue Million Forecast, by End User 2019 & 2032
- Table 60: Global Netherland Data Center Construction Market Volume K Unit Forecast, by End User 2019 & 2032
- Table 61: Global Netherland Data Center Construction Market Revenue Million Forecast, by Country 2019 & 2032
- Table 62: Global Netherland Data Center Construction Market Volume K Unit Forecast, by Country 2019 & 2032
- Table 63: United Kingdom Netherland Data Center Construction Market Revenue (Million) Forecast, by Application 2019 & 2032
- Table 64: United Kingdom Netherland Data Center Construction Market Volume (K Unit) Forecast, by Application 2019 & 2032
- Table 65: Germany Netherland Data Center Construction Market Revenue (Million) Forecast, by Application 2019 & 2032
- Table 66: Germany Netherland Data Center Construction Market Volume (K Unit) Forecast, by Application 2019 & 2032
- Table 67: France Netherland Data Center Construction Market Revenue (Million) Forecast, by Application 2019 & 2032
- Table 68: France Netherland Data Center Construction Market Volume (K Unit) Forecast, by Application 2019 & 2032
- Table 69: Italy Netherland Data Center Construction Market Revenue (Million) Forecast, by Application 2019 & 2032
- Table 70: Italy Netherland Data Center Construction Market Volume (K Unit) Forecast, by Application 2019 & 2032
- Table 71: Spain Netherland Data Center Construction Market Revenue (Million) Forecast, by Application 2019 & 2032
- Table 72: Spain Netherland Data Center Construction Market Volume (K Unit) Forecast, by Application 2019 & 2032
- Table 73: Russia Netherland Data Center Construction Market Revenue (Million) Forecast, by Application 2019 & 2032
- Table 74: Russia Netherland Data Center Construction Market Volume (K Unit) Forecast, by Application 2019 & 2032
- Table 75: Benelux Netherland Data Center Construction Market Revenue (Million) Forecast, by Application 2019 & 2032
- Table 76: Benelux Netherland Data Center Construction Market Volume (K Unit) Forecast, by Application 2019 & 2032
- Table 77: Nordics Netherland Data Center Construction Market Revenue (Million) Forecast, by Application 2019 & 2032
- Table 78: Nordics Netherland Data Center Construction Market Volume (K Unit) Forecast, by Application 2019 & 2032
- Table 79: Rest of Europe Netherland Data Center Construction Market Revenue (Million) Forecast, by Application 2019 & 2032
- Table 80: Rest of Europe Netherland Data Center Construction Market Volume (K Unit) Forecast, by Application 2019 & 2032
- Table 81: Global Netherland Data Center Construction Market Revenue Million Forecast, by Tier Type 2019 & 2032
- Table 82: Global Netherland Data Center Construction Market Volume K Unit Forecast, by Tier Type 2019 & 2032
- Table 83: Global Netherland Data Center Construction Market Revenue Million Forecast, by Data Center Size 2019 & 2032
- Table 84: Global Netherland Data Center Construction Market Volume K Unit Forecast, by Data Center Size 2019 & 2032
- Table 85: Global Netherland Data Center Construction Market Revenue Million Forecast, by Infrastructure 2019 & 2032
- Table 86: Global Netherland Data Center Construction Market Volume K Unit Forecast, by Infrastructure 2019 & 2032
- Table 87: Global Netherland Data Center Construction Market Revenue Million Forecast, by End User 2019 & 2032
- Table 88: Global Netherland Data Center Construction Market Volume K Unit Forecast, by End User 2019 & 2032
- Table 89: Global Netherland Data Center Construction Market Revenue Million Forecast, by Country 2019 & 2032
- Table 90: Global Netherland Data Center Construction Market Volume K Unit Forecast, by Country 2019 & 2032
- Table 91: Turkey Netherland Data Center Construction Market Revenue (Million) Forecast, by Application 2019 & 2032
- Table 92: Turkey Netherland Data Center Construction Market Volume (K Unit) Forecast, by Application 2019 & 2032
- Table 93: Israel Netherland Data Center Construction Market Revenue (Million) Forecast, by Application 2019 & 2032
- Table 94: Israel Netherland Data Center Construction Market Volume (K Unit) Forecast, by Application 2019 & 2032
- Table 95: GCC Netherland Data Center Construction Market Revenue (Million) Forecast, by Application 2019 & 2032
- Table 96: GCC Netherland Data Center Construction Market Volume (K Unit) Forecast, by Application 2019 & 2032
- Table 97: North Africa Netherland Data Center Construction Market Revenue (Million) Forecast, by Application 2019 & 2032
- Table 98: North Africa Netherland Data Center Construction Market Volume (K Unit) Forecast, by Application 2019 & 2032
- Table 99: South Africa Netherland Data Center Construction Market Revenue (Million) Forecast, by Application 2019 & 2032
- Table 100: South Africa Netherland Data Center Construction Market Volume (K Unit) Forecast, by Application 2019 & 2032
- Table 101: Rest of Middle East & Africa Netherland Data Center Construction Market Revenue (Million) Forecast, by Application 2019 & 2032
- Table 102: Rest of Middle East & Africa Netherland Data Center Construction Market Volume (K Unit) Forecast, by Application 2019 & 2032
- Table 103: Global Netherland Data Center Construction Market Revenue Million Forecast, by Tier Type 2019 & 2032
- Table 104: Global Netherland Data Center Construction Market Volume K Unit Forecast, by Tier Type 2019 & 2032
- Table 105: Global Netherland Data Center Construction Market Revenue Million Forecast, by Data Center Size 2019 & 2032
- Table 106: Global Netherland Data Center Construction Market Volume K Unit Forecast, by Data Center Size 2019 & 2032
- Table 107: Global Netherland Data Center Construction Market Revenue Million Forecast, by Infrastructure 2019 & 2032
- Table 108: Global Netherland Data Center Construction Market Volume K Unit Forecast, by Infrastructure 2019 & 2032
- Table 109: Global Netherland Data Center Construction Market Revenue Million Forecast, by End User 2019 & 2032
- Table 110: Global Netherland Data Center Construction Market Volume K Unit Forecast, by End User 2019 & 2032
- Table 111: Global Netherland Data Center Construction Market Revenue Million Forecast, by Country 2019 & 2032
- Table 112: Global Netherland Data Center Construction Market Volume K Unit Forecast, by Country 2019 & 2032
- Table 113: China Netherland Data Center Construction Market Revenue (Million) Forecast, by Application 2019 & 2032
- Table 114: China Netherland Data Center Construction Market Volume (K Unit) Forecast, by Application 2019 & 2032
- Table 115: India Netherland Data Center Construction Market Revenue (Million) Forecast, by Application 2019 & 2032
- Table 116: India Netherland Data Center Construction Market Volume (K Unit) Forecast, by Application 2019 & 2032
- Table 117: Japan Netherland Data Center Construction Market Revenue (Million) Forecast, by Application 2019 & 2032
- Table 118: Japan Netherland Data Center Construction Market Volume (K Unit) Forecast, by Application 2019 & 2032
- Table 119: South Korea Netherland Data Center Construction Market Revenue (Million) Forecast, by Application 2019 & 2032
- Table 120: South Korea Netherland Data Center Construction Market Volume (K Unit) Forecast, by Application 2019 & 2032
- Table 121: ASEAN Netherland Data Center Construction Market Revenue (Million) Forecast, by Application 2019 & 2032
- Table 122: ASEAN Netherland Data Center Construction Market Volume (K Unit) Forecast, by Application 2019 & 2032
- Table 123: Oceania Netherland Data Center Construction Market Revenue (Million) Forecast, by Application 2019 & 2032
- Table 124: Oceania Netherland Data Center Construction Market Volume (K Unit) Forecast, by Application 2019 & 2032
- Table 125: Rest of Asia Pacific Netherland Data Center Construction Market Revenue (Million) Forecast, by Application 2019 & 2032
- Table 126: Rest of Asia Pacific Netherland Data Center Construction Market Volume (K Unit) Forecast, by Application 2019 & 2032
Frequently Asked Questions
1. What is the projected Compound Annual Growth Rate (CAGR) of the Netherland Data Center Construction Market?
The projected CAGR is approximately 4.75%.
2. Which companies are prominent players in the Netherland Data Center Construction Market?
Key companies in the market include Per Aarsleff A/S, Johnson Controls International PLC, Dornan(Engineering Works), IBM Corporation, Legrand SA, ALFA LAVAL AB, Schneider Electric SE, Arista Networks, DPR Construction Inc, Stulz GmbH, Arup Group Limited, Kirby Group Engineering, AECOM, Coromatic AB Sweden.
3. What are the main segments of the Netherland Data Center Construction Market?
The market segments include Tier Type, Data Center Size, Infrastructure, End User.
4. Can you provide details about the market size?
The market size is estimated to be USD 1.20 Million as of 2022.
5. What are some drivers contributing to market growth?
5G Developments Fuelling Data Center Investments; Growing Cloud Servce adoption; Green Data Centers Rising Awareness of Carbon-neutrality Leading to Infrastructure Upgrades.
6. What are the notable trends driving market growth?
IT and Telecom to Have Significant Market Share.
7. Are there any restraints impacting market growth?
Security Challenges Impacting Growth of Data Centers.
8. Can you provide examples of recent developments in the market?
December 2023: Google started construction of a new data center in Winschoten, Groningen (Netherlands). The company plans to invest EUR 600 million (USD 655.1 million) into the new data center construction project situated at Hoogebrug 3.
9. What pricing options are available for accessing the report?
Pricing options include single-user, multi-user, and enterprise licenses priced at USD 3800, USD 4500, and USD 5800 respectively.
10. Is the market size provided in terms of value or volume?
The market size is provided in terms of value, measured in Million and volume, measured in K Unit.
11. Are there any specific market keywords associated with the report?
Yes, the market keyword associated with the report is "Netherland Data Center Construction Market," which aids in identifying and referencing the specific market segment covered.
12. How do I determine which pricing option suits my needs best?
The pricing options vary based on user requirements and access needs. Individual users may opt for single-user licenses, while businesses requiring broader access may choose multi-user or enterprise licenses for cost-effective access to the report.
13. Are there any additional resources or data provided in the Netherland Data Center Construction Market report?
While the report offers comprehensive insights, it's advisable to review the specific contents or supplementary materials provided to ascertain if additional resources or data are available.
14. How can I stay updated on further developments or reports in the Netherland Data Center Construction Market?
To stay informed about further developments, trends, and reports in the Netherland Data Center Construction Market, consider subscribing to industry newsletters, following relevant companies and organizations, or regularly checking reputable industry news sources and publications.
Methodology
Step 1 - Identification of Relevant Samples Size from Population Database


Step 2 - Approaches for Defining Global Market Size (Value, Volume* & Price*)

Note*: In applicable scenarios
Step 3 - Data Sources
Primary Research
- Web Analytics
- Survey Reports
- Research Institute
- Latest Research Reports
- Opinion Leaders
Secondary Research
- Annual Reports
- White Paper
- Latest Press Release
- Industry Association
- Paid Database
- Investor Presentations

Step 4 - Data Triangulation
Involves using different sources of information in order to increase the validity of a study
These sources are likely to be stakeholders in a program - participants, other researchers, program staff, other community members, and so on.
Then we put all data in single framework & apply various statistical tools to find out the dynamic on the market.
During the analysis stage, feedback from the stakeholder groups would be compared to determine areas of agreement as well as areas of divergence


