
Key Insights
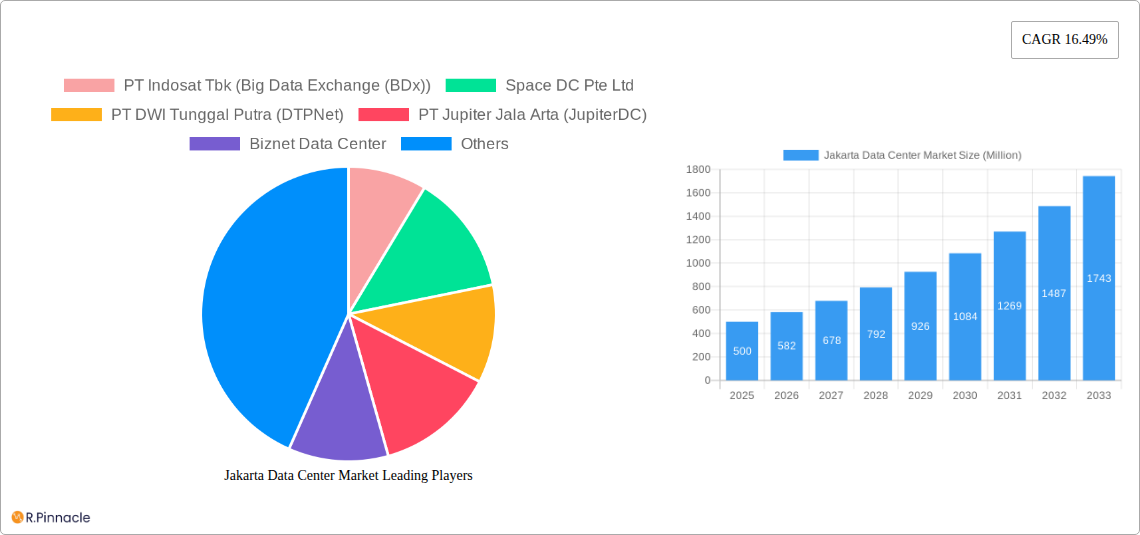
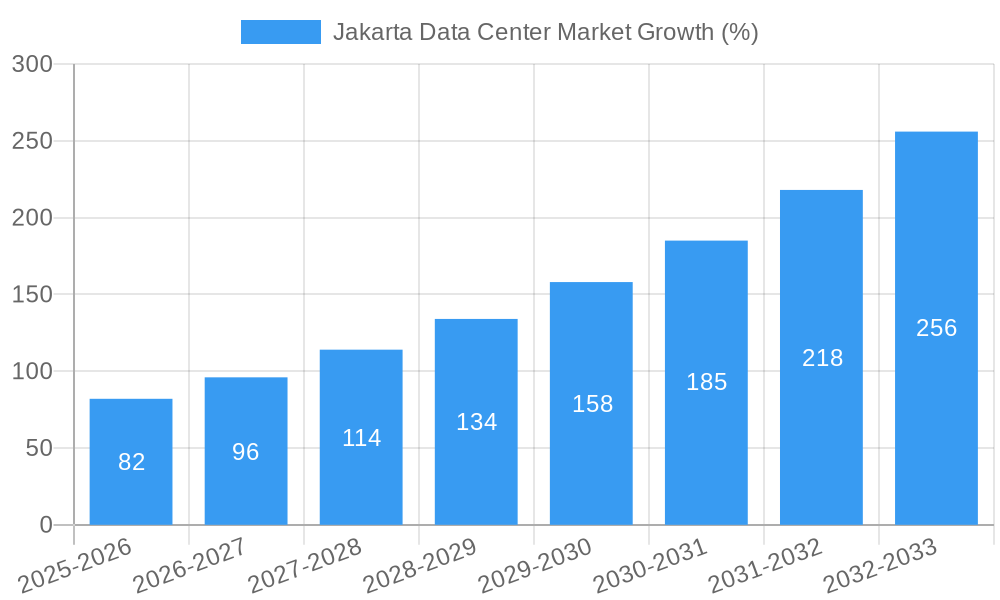
The Jakarta data center market is experiencing robust growth, driven by increasing digitalization across various sectors, including cloud computing, e-commerce, and fintech. A 16.49% CAGR indicates significant expansion, with the market size expected to reach substantial figures in the coming years. Key drivers include the burgeoning Indonesian economy, government initiatives promoting digital infrastructure, and the rising demand for low-latency services. The market is segmented by data center size (small to mega), tier type, absorption rate (utilized vs. non-utilized), colocation type (retail, wholesale, hyperscale), and end-user industry. The large number of players, including both international giants like NTT and local providers such as PT DCI Indonesia Tbk and Biznet Data Center, indicates a competitive landscape. While specific regional breakdowns (North America, Europe, etc.) for Jakarta are not directly applicable, the strong domestic growth is fueled by local demand. The substantial investment in infrastructure development suggests continued expansion throughout the forecast period (2025-2033). The hyperscale segment is likely to experience the most significant growth, driven by major cloud providers' increasing presence in the region.
Challenges could include infrastructure limitations, power constraints, and competition for skilled labor. However, given the significant government support and the high demand for data center services, these challenges are likely to be mitigated. The market's future hinges on continued investments in renewable energy sources to address sustainability concerns and the government’s ongoing efforts to improve digital infrastructure accessibility. Focusing on areas like improved connectivity and reduced latency will further fuel the growth of the Jakarta data center market. This market presents compelling opportunities for both established players and new entrants. The diverse end-user segments further broaden the market’s potential, creating opportunities for specialized solutions and services.
Jakarta Data Center Market: A Comprehensive Report (2019-2033)
This in-depth report provides a comprehensive analysis of the Jakarta data center market, offering invaluable insights for industry professionals, investors, and strategic decision-makers. The study period covers 2019-2033, with a base year of 2025 and a forecast period spanning 2025-2033. We analyze historical data from 2019-2024 to provide a robust foundation for future projections. This report leverages detailed market segmentation, incorporating key metrics and recent industry developments to deliver actionable intelligence on this rapidly expanding market. The report projects a market value of xx Million by 2033, showcasing significant growth opportunities.
Jakarta Data Center Market Structure & Innovation Trends
The Jakarta data center market exhibits a moderately concentrated structure, with several key players vying for market share. PT DCI Indonesia Tbk, PT Indosat Tbk (BDx), and several international players hold significant positions. However, the emergence of smaller, niche players, particularly those specializing in greenfield projects or specific colocation services, indicates a dynamic competitive landscape. Market share data for 2024 indicates PT DCI Indonesia Tbk holds approximately xx% market share, followed by PT Indosat Tbk (BDx) with xx%, and others with xx% collectively.
Innovation in the Jakarta market is driven by several factors:
- Demand for Hyperscale Facilities: The increasing adoption of cloud services and the growth of digital businesses fuels the demand for large-scale data centers.
- Green Initiatives: Sustainability is a major focus, with many providers investing in energy-efficient technologies to meet the growing demand for green data centers.
- Technological Advancements: Advancements in areas such as AI, IoT, and 5G are pushing the need for high-performance computing infrastructure.
- Government Support: The Indonesian government's initiatives to enhance digital infrastructure and attract foreign investment contribute to the growth of the data center sector.
Regulatory frameworks, while generally supportive, still present some challenges related to licensing and data sovereignty. The market is witnessing increased M&A activity, with deal values exceeding xx Million in the last five years. Examples include strategic partnerships and acquisitions to enhance operational capabilities and expand market reach. End-user demographics are shifting toward higher adoption of cloud-based services across various sectors, particularly in BFSI, E-commerce, and Telecom.
Jakarta Data Center Market Dynamics & Trends
The Jakarta data center market is experiencing robust growth, driven primarily by the expanding digital economy and rising demand for cloud services. The increasing penetration of internet and mobile services, coupled with government support for digital transformation, are significant factors contributing to this growth. The Compound Annual Growth Rate (CAGR) during the forecast period is estimated at xx%, indicating significant market expansion. Market penetration, especially in the hyperscale and wholesale colocation segments, is expected to increase considerably. Technological disruptions, such as the rising adoption of edge computing and AI-powered data analytics, are reshaping the market landscape, creating demand for innovative data center solutions. Consumer preferences are evolving towards sustainable and energy-efficient data centers, influencing the strategic decisions of market players. Competitive dynamics are characterized by a mix of established players and new entrants, with a growing emphasis on differentiation through technological advancements, superior service offerings, and enhanced customer experiences.
Dominant Regions & Segments in Jakarta Data Center Market
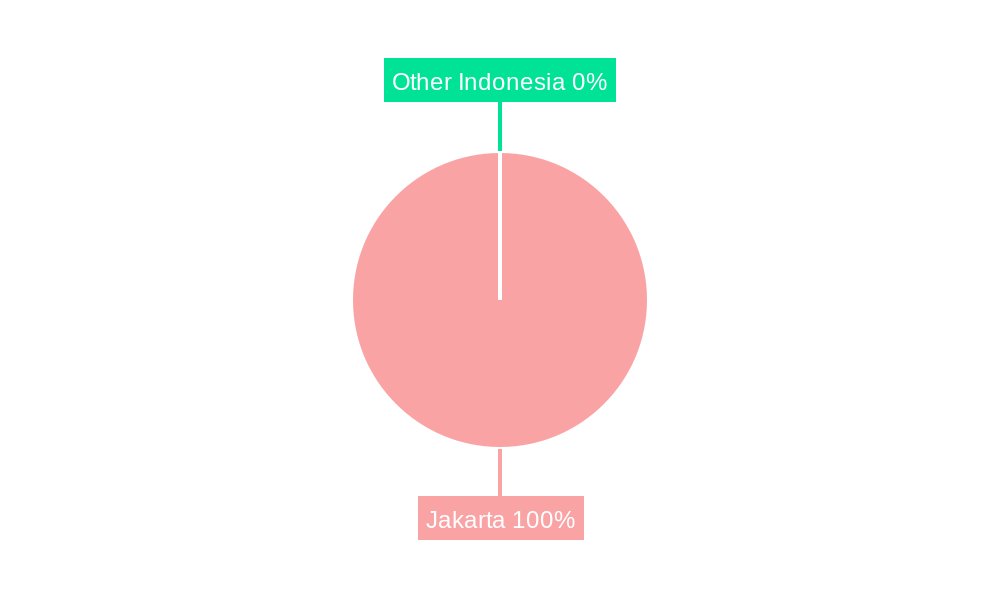
The Jakarta metropolitan area is the dominant region, attracting significant investments due to its robust connectivity, established infrastructure, and proximity to major business hubs.
Key Drivers for Dominance:
- Strong Digital Economy: Jakarta is a center for digital businesses, generating substantial demand for data center capacity.
- Established Infrastructure: Access to reliable power, connectivity, and skilled labor makes Jakarta an attractive location for data centers.
- Government Support: Government policies promoting digitalization incentivize investment in data center infrastructure within the region.
Dominant Segments:
- DC Size: The Large and Mega segments are currently dominant, driven by hyperscaler requirements. However, growth is anticipated across all sizes.
- Tier Type: Tier III facilities are leading the market due to their higher reliability and redundancy, though Tier IV deployments are starting to grow.
- Absorption: The Utilized segment is dominant, reflecting high demand, while the Non-Utilized segment represents future expansion potential.
- Colocation Type: Wholesale colocation is a major segment, reflecting the needs of large enterprises and hyperscalers. Retail and hyperscale segments exhibit strong growth potential.
- End User: Cloud & IT, Telecom, and BFSI are the largest end-user segments, with significant growth expected in E-commerce and Government sectors.
Jakarta Data Center Market Product Innovations
Recent innovations include the adoption of modular data center designs, increased use of AI-powered management systems, and a strong focus on sustainability with higher efficiency cooling systems and renewable energy integration. These advancements improve operational efficiency, reduce operational expenditure, and enhance the overall resilience of data center infrastructure. This trend aligns perfectly with the growing market demand for reliable, cost-effective, and eco-friendly data center solutions in Jakarta.
Report Scope & Segmentation Analysis
This report provides a comprehensive segmentation analysis covering:
- DC Size: Small, Medium, Large, Massive, Mega (Growth projections and market sizes are provided for each segment).
- Tier Type: Tier I, Tier II, Tier III, Tier IV (Competitive dynamics and market shares are analyzed).
- Absorption: Utilized, Non-Utilized (Assessment of supply-demand balance).
- Colocation Type: Retail, Wholesale, Hyperscale (Growth forecasts for each colocation type).
- End User: Cloud & IT, Telecom, Media & Entertainment, Government, BFSI, Manufacturing, E-commerce, Other (Market size and growth projections for each end-user segment). Competitive dynamics are highlighted within each segment.
Key Drivers of Jakarta Data Center Market Growth
The growth of the Jakarta data center market is primarily fueled by several key factors: The explosive growth of the Indonesian digital economy, coupled with increasing demand for cloud computing and big data analytics. Government initiatives promoting digitalization and infrastructure development create a supportive environment for growth. Furthermore, the increasing adoption of 5G technology and the emergence of new technologies such as the Internet of Things (IoT) and Artificial Intelligence (AI) further drive the need for advanced data center infrastructure.
Challenges in the Jakarta Data Center Market Sector
The Jakarta data center market faces certain challenges, including limitations in power infrastructure in certain areas, the need for skilled workforce, competition for land and resources, and potential regulatory hurdles. These issues can impact the cost and time required for data center deployment. Addressing these challenges effectively is crucial for sustaining the long-term growth of the market.
Emerging Opportunities in Jakarta Data Center Market
Emerging opportunities in the Jakarta data center market include the growing demand for edge computing infrastructure and the potential for increased investment in renewable energy sources to power data centers. Furthermore, the rising adoption of hyperscale data centers and the increasing focus on digital transformation initiatives by the Indonesian government present significant opportunities for growth. Expanding into underserved regions within Jakarta also presents opportunities.
Leading Players in the Jakarta Data Center Market Market
- PT Indosat Tbk (Big Data Exchange (BDx))
- Space DC Pte Ltd
- PT DWI Tunggal Putra (DTPNet)
- PT Jupiter Jala Arta (JupiterDC)
- Biznet Data Center
- PT Sigma Cipta Caraka (Telkomsigma)
- Digital Edge DC
- EdgeConneX Inc (GTN Data Centers)
- PT DCI Indonesia Tbk
- NEX Data Center Indonesia
- PT XL Axiata Tbk (Princeton Digital Group)
- NTT Ltd
- Nusantara Data Center
Key Developments in Jakarta Data Center Market Industry
- April 2023: BDxIndonesia, a BDx affiliate, commences construction of CGK3A, a 15 MW Tier 3 data center in TB Simatupang, South Jakarta. This significantly expands capacity for Indonesian businesses and hyperscalers, highlighting a focus on greenfield development and Tier III facilities.
- December 2022: ST Telemedia Global Data Centres (Indonesia) announces the structural completion of STT Jakarta 1, a 19.5 MW facility, part of a larger 72 MW campus. This signifies significant investment and a commitment to expanding capacity in the Jakarta market.
Future Outlook for Jakarta Data Center Market Market
The Jakarta data center market is poised for substantial growth, driven by continued expansion of the digital economy, increasing demand for cloud services, and government support for infrastructure development. Strategic opportunities abound for data center providers that focus on sustainability, innovation, and meeting the evolving needs of hyperscalers and enterprises. The market's robust growth trajectory is expected to continue throughout the forecast period, presenting compelling investment opportunities.
Jakarta Data Center Market Segmentation
-
1. DC Size
- 1.1. Small
- 1.2. Medium
- 1.3. Large
- 1.4. Massive
- 1.5. Mega
-
2. Tier Type
- 2.1. Tier 1 & 2
- 2.2. Tier 3
- 2.3. Tier 4
-
3. Absorption
-
3.1. Utilized
-
3.1.1. Colocation Type
- 3.1.1.1. Retail
- 3.1.1.2. Wholesale
- 3.1.1.3. Hyperscale
-
3.1.2. End User
- 3.1.2.1. Cloud & IT
- 3.1.2.2. Telecom
- 3.1.2.3. Media & Entertainment
- 3.1.2.4. Government
- 3.1.2.5. BFSI
- 3.1.2.6. Manufacturing
- 3.1.2.7. E-Commerce
- 3.1.2.8. Other End User
-
3.1.1. Colocation Type
- 3.2. Non-Utilized
-
3.1. Utilized
Jakarta Data Center Market Segmentation By Geography
-
1. North America
- 1.1. United States
- 1.2. Canada
- 1.3. Mexico
-
2. South America
- 2.1. Brazil
- 2.2. Argentina
- 2.3. Rest of South America
-
3. Europe
- 3.1. United Kingdom
- 3.2. Germany
- 3.3. France
- 3.4. Italy
- 3.5. Spain
- 3.6. Russia
- 3.7. Benelux
- 3.8. Nordics
- 3.9. Rest of Europe
-
4. Middle East & Africa
- 4.1. Turkey
- 4.2. Israel
- 4.3. GCC
- 4.4. North Africa
- 4.5. South Africa
- 4.6. Rest of Middle East & Africa
-
5. Asia Pacific
- 5.1. China
- 5.2. India
- 5.3. Japan
- 5.4. South Korea
- 5.5. ASEAN
- 5.6. Oceania
- 5.7. Rest of Asia Pacific
Jakarta Data Center Market REPORT HIGHLIGHTS
| Aspects | Details |
|---|---|
| Study Period | 2019-2033 |
| Base Year | 2024 |
| Estimated Year | 2025 |
| Forecast Period | 2025-2033 |
| Historical Period | 2019-2024 |
| Growth Rate | CAGR of 16.49% from 2019-2033 |
| Segmentation |
|
Table of Contents
- 1. Introduction
- 1.1. Research Scope
- 1.2. Market Segmentation
- 1.3. Research Methodology
- 1.4. Definitions and Assumptions
- 2. Executive Summary
- 2.1. Introduction
- 3. Market Dynamics
- 3.1. Introduction
- 3.2. Market Drivers
- 3.2.1. Regulations Promoting Proper Lighting for Worker Safety in Hazardous Locations; Rising Demand for Cost-effective and Energy-efficient LED Lighting Solutions
- 3.3. Market Restrains
- 3.3.1. High Costs of Equipment
- 3.4. Market Trends
- 3.4.1. Tier 4 is Expected to Hold Significant Share of the Market
- 4. Market Factor Analysis
- 4.1. Porters Five Forces
- 4.2. Supply/Value Chain
- 4.3. PESTEL analysis
- 4.4. Market Entropy
- 4.5. Patent/Trademark Analysis
- 5. Global Jakarta Data Center Market Analysis, Insights and Forecast, 2019-2031
- 5.1. Market Analysis, Insights and Forecast - by DC Size
- 5.1.1. Small
- 5.1.2. Medium
- 5.1.3. Large
- 5.1.4. Massive
- 5.1.5. Mega
- 5.2. Market Analysis, Insights and Forecast - by Tier Type
- 5.2.1. Tier 1 & 2
- 5.2.2. Tier 3
- 5.2.3. Tier 4
- 5.3. Market Analysis, Insights and Forecast - by Absorption
- 5.3.1. Utilized
- 5.3.1.1. Colocation Type
- 5.3.1.1.1. Retail
- 5.3.1.1.2. Wholesale
- 5.3.1.1.3. Hyperscale
- 5.3.1.2. End User
- 5.3.1.2.1. Cloud & IT
- 5.3.1.2.2. Telecom
- 5.3.1.2.3. Media & Entertainment
- 5.3.1.2.4. Government
- 5.3.1.2.5. BFSI
- 5.3.1.2.6. Manufacturing
- 5.3.1.2.7. E-Commerce
- 5.3.1.2.8. Other End User
- 5.3.1.1. Colocation Type
- 5.3.2. Non-Utilized
- 5.3.1. Utilized
- 5.4. Market Analysis, Insights and Forecast - by Region
- 5.4.1. North America
- 5.4.2. South America
- 5.4.3. Europe
- 5.4.4. Middle East & Africa
- 5.4.5. Asia Pacific
- 5.1. Market Analysis, Insights and Forecast - by DC Size
- 6. North America Jakarta Data Center Market Analysis, Insights and Forecast, 2019-2031
- 6.1. Market Analysis, Insights and Forecast - by DC Size
- 6.1.1. Small
- 6.1.2. Medium
- 6.1.3. Large
- 6.1.4. Massive
- 6.1.5. Mega
- 6.2. Market Analysis, Insights and Forecast - by Tier Type
- 6.2.1. Tier 1 & 2
- 6.2.2. Tier 3
- 6.2.3. Tier 4
- 6.3. Market Analysis, Insights and Forecast - by Absorption
- 6.3.1. Utilized
- 6.3.1.1. Colocation Type
- 6.3.1.1.1. Retail
- 6.3.1.1.2. Wholesale
- 6.3.1.1.3. Hyperscale
- 6.3.1.2. End User
- 6.3.1.2.1. Cloud & IT
- 6.3.1.2.2. Telecom
- 6.3.1.2.3. Media & Entertainment
- 6.3.1.2.4. Government
- 6.3.1.2.5. BFSI
- 6.3.1.2.6. Manufacturing
- 6.3.1.2.7. E-Commerce
- 6.3.1.2.8. Other End User
- 6.3.1.1. Colocation Type
- 6.3.2. Non-Utilized
- 6.3.1. Utilized
- 6.1. Market Analysis, Insights and Forecast - by DC Size
- 7. South America Jakarta Data Center Market Analysis, Insights and Forecast, 2019-2031
- 7.1. Market Analysis, Insights and Forecast - by DC Size
- 7.1.1. Small
- 7.1.2. Medium
- 7.1.3. Large
- 7.1.4. Massive
- 7.1.5. Mega
- 7.2. Market Analysis, Insights and Forecast - by Tier Type
- 7.2.1. Tier 1 & 2
- 7.2.2. Tier 3
- 7.2.3. Tier 4
- 7.3. Market Analysis, Insights and Forecast - by Absorption
- 7.3.1. Utilized
- 7.3.1.1. Colocation Type
- 7.3.1.1.1. Retail
- 7.3.1.1.2. Wholesale
- 7.3.1.1.3. Hyperscale
- 7.3.1.2. End User
- 7.3.1.2.1. Cloud & IT
- 7.3.1.2.2. Telecom
- 7.3.1.2.3. Media & Entertainment
- 7.3.1.2.4. Government
- 7.3.1.2.5. BFSI
- 7.3.1.2.6. Manufacturing
- 7.3.1.2.7. E-Commerce
- 7.3.1.2.8. Other End User
- 7.3.1.1. Colocation Type
- 7.3.2. Non-Utilized
- 7.3.1. Utilized
- 7.1. Market Analysis, Insights and Forecast - by DC Size
- 8. Europe Jakarta Data Center Market Analysis, Insights and Forecast, 2019-2031
- 8.1. Market Analysis, Insights and Forecast - by DC Size
- 8.1.1. Small
- 8.1.2. Medium
- 8.1.3. Large
- 8.1.4. Massive
- 8.1.5. Mega
- 8.2. Market Analysis, Insights and Forecast - by Tier Type
- 8.2.1. Tier 1 & 2
- 8.2.2. Tier 3
- 8.2.3. Tier 4
- 8.3. Market Analysis, Insights and Forecast - by Absorption
- 8.3.1. Utilized
- 8.3.1.1. Colocation Type
- 8.3.1.1.1. Retail
- 8.3.1.1.2. Wholesale
- 8.3.1.1.3. Hyperscale
- 8.3.1.2. End User
- 8.3.1.2.1. Cloud & IT
- 8.3.1.2.2. Telecom
- 8.3.1.2.3. Media & Entertainment
- 8.3.1.2.4. Government
- 8.3.1.2.5. BFSI
- 8.3.1.2.6. Manufacturing
- 8.3.1.2.7. E-Commerce
- 8.3.1.2.8. Other End User
- 8.3.1.1. Colocation Type
- 8.3.2. Non-Utilized
- 8.3.1. Utilized
- 8.1. Market Analysis, Insights and Forecast - by DC Size
- 9. Middle East & Africa Jakarta Data Center Market Analysis, Insights and Forecast, 2019-2031
- 9.1. Market Analysis, Insights and Forecast - by DC Size
- 9.1.1. Small
- 9.1.2. Medium
- 9.1.3. Large
- 9.1.4. Massive
- 9.1.5. Mega
- 9.2. Market Analysis, Insights and Forecast - by Tier Type
- 9.2.1. Tier 1 & 2
- 9.2.2. Tier 3
- 9.2.3. Tier 4
- 9.3. Market Analysis, Insights and Forecast - by Absorption
- 9.3.1. Utilized
- 9.3.1.1. Colocation Type
- 9.3.1.1.1. Retail
- 9.3.1.1.2. Wholesale
- 9.3.1.1.3. Hyperscale
- 9.3.1.2. End User
- 9.3.1.2.1. Cloud & IT
- 9.3.1.2.2. Telecom
- 9.3.1.2.3. Media & Entertainment
- 9.3.1.2.4. Government
- 9.3.1.2.5. BFSI
- 9.3.1.2.6. Manufacturing
- 9.3.1.2.7. E-Commerce
- 9.3.1.2.8. Other End User
- 9.3.1.1. Colocation Type
- 9.3.2. Non-Utilized
- 9.3.1. Utilized
- 9.1. Market Analysis, Insights and Forecast - by DC Size
- 10. Asia Pacific Jakarta Data Center Market Analysis, Insights and Forecast, 2019-2031
- 10.1. Market Analysis, Insights and Forecast - by DC Size
- 10.1.1. Small
- 10.1.2. Medium
- 10.1.3. Large
- 10.1.4. Massive
- 10.1.5. Mega
- 10.2. Market Analysis, Insights and Forecast - by Tier Type
- 10.2.1. Tier 1 & 2
- 10.2.2. Tier 3
- 10.2.3. Tier 4
- 10.3. Market Analysis, Insights and Forecast - by Absorption
- 10.3.1. Utilized
- 10.3.1.1. Colocation Type
- 10.3.1.1.1. Retail
- 10.3.1.1.2. Wholesale
- 10.3.1.1.3. Hyperscale
- 10.3.1.2. End User
- 10.3.1.2.1. Cloud & IT
- 10.3.1.2.2. Telecom
- 10.3.1.2.3. Media & Entertainment
- 10.3.1.2.4. Government
- 10.3.1.2.5. BFSI
- 10.3.1.2.6. Manufacturing
- 10.3.1.2.7. E-Commerce
- 10.3.1.2.8. Other End User
- 10.3.1.1. Colocation Type
- 10.3.2. Non-Utilized
- 10.3.1. Utilized
- 10.1. Market Analysis, Insights and Forecast - by DC Size
- 11. North America Jakarta Data Center Market Analysis, Insights and Forecast, 2019-2031
- 11.1. Market Analysis, Insights and Forecast - By Country/Sub-region
- 11.1.1.
- 12. Europe Jakarta Data Center Market Analysis, Insights and Forecast, 2019-2031
- 12.1. Market Analysis, Insights and Forecast - By Country/Sub-region
- 12.1.1.
- 13. Asia Pacific Jakarta Data Center Market Analysis, Insights and Forecast, 2019-2031
- 13.1. Market Analysis, Insights and Forecast - By Country/Sub-region
- 13.1.1.
- 14. Latin America Jakarta Data Center Market Analysis, Insights and Forecast, 2019-2031
- 14.1. Market Analysis, Insights and Forecast - By Country/Sub-region
- 14.1.1.
- 15. Middle East and Africa Jakarta Data Center Market Analysis, Insights and Forecast, 2019-2031
- 15.1. Market Analysis, Insights and Forecast - By Country/Sub-region
- 15.1.1.
- 16. Competitive Analysis
- 16.1. Global Market Share Analysis 2024
- 16.2. Company Profiles
- 16.2.1 PT Indosat Tbk (Big Data Exchange (BDx))
- 16.2.1.1. Overview
- 16.2.1.2. Products
- 16.2.1.3. SWOT Analysis
- 16.2.1.4. Recent Developments
- 16.2.1.5. Financials (Based on Availability)
- 16.2.2 Space DC Pte Ltd
- 16.2.2.1. Overview
- 16.2.2.2. Products
- 16.2.2.3. SWOT Analysis
- 16.2.2.4. Recent Developments
- 16.2.2.5. Financials (Based on Availability)
- 16.2.3 PT DWI Tunggal Putra (DTPNet)
- 16.2.3.1. Overview
- 16.2.3.2. Products
- 16.2.3.3. SWOT Analysis
- 16.2.3.4. Recent Developments
- 16.2.3.5. Financials (Based on Availability)
- 16.2.4 PT Jupiter Jala Arta (JupiterDC)
- 16.2.4.1. Overview
- 16.2.4.2. Products
- 16.2.4.3. SWOT Analysis
- 16.2.4.4. Recent Developments
- 16.2.4.5. Financials (Based on Availability)
- 16.2.5 Biznet Data Center
- 16.2.5.1. Overview
- 16.2.5.2. Products
- 16.2.5.3. SWOT Analysis
- 16.2.5.4. Recent Developments
- 16.2.5.5. Financials (Based on Availability)
- 16.2.6 PT Sigma Cipta Caraka (Telkomsigma)
- 16.2.6.1. Overview
- 16.2.6.2. Products
- 16.2.6.3. SWOT Analysis
- 16.2.6.4. Recent Developments
- 16.2.6.5. Financials (Based on Availability)
- 16.2.7 Digital Edge DC
- 16.2.7.1. Overview
- 16.2.7.2. Products
- 16.2.7.3. SWOT Analysis
- 16.2.7.4. Recent Developments
- 16.2.7.5. Financials (Based on Availability)
- 16.2.8 EdgeConneX Inc (GTN Data Centers)
- 16.2.8.1. Overview
- 16.2.8.2. Products
- 16.2.8.3. SWOT Analysis
- 16.2.8.4. Recent Developments
- 16.2.8.5. Financials (Based on Availability)
- 16.2.9 PT DCI Indonesia Tbk
- 16.2.9.1. Overview
- 16.2.9.2. Products
- 16.2.9.3. SWOT Analysis
- 16.2.9.4. Recent Developments
- 16.2.9.5. Financials (Based on Availability)
- 16.2.10 NEX Data Center Indonesia
- 16.2.10.1. Overview
- 16.2.10.2. Products
- 16.2.10.3. SWOT Analysis
- 16.2.10.4. Recent Developments
- 16.2.10.5. Financials (Based on Availability)
- 16.2.11 PT XL Axiata Tbk (Princeton Digital Group)
- 16.2.11.1. Overview
- 16.2.11.2. Products
- 16.2.11.3. SWOT Analysis
- 16.2.11.4. Recent Developments
- 16.2.11.5. Financials (Based on Availability)
- 16.2.12 NTT Ltd
- 16.2.12.1. Overview
- 16.2.12.2. Products
- 16.2.12.3. SWOT Analysis
- 16.2.12.4. Recent Developments
- 16.2.12.5. Financials (Based on Availability)
- 16.2.13 Nusantara Data Center
- 16.2.13.1. Overview
- 16.2.13.2. Products
- 16.2.13.3. SWOT Analysis
- 16.2.13.4. Recent Developments
- 16.2.13.5. Financials (Based on Availability)
- 16.2.1 PT Indosat Tbk (Big Data Exchange (BDx))
List of Figures
- Figure 1: Global Jakarta Data Center Market Revenue Breakdown (Million, %) by Region 2024 & 2032
- Figure 2: North America Jakarta Data Center Market Revenue (Million), by Country 2024 & 2032
- Figure 3: North America Jakarta Data Center Market Revenue Share (%), by Country 2024 & 2032
- Figure 4: Europe Jakarta Data Center Market Revenue (Million), by Country 2024 & 2032
- Figure 5: Europe Jakarta Data Center Market Revenue Share (%), by Country 2024 & 2032
- Figure 6: Asia Pacific Jakarta Data Center Market Revenue (Million), by Country 2024 & 2032
- Figure 7: Asia Pacific Jakarta Data Center Market Revenue Share (%), by Country 2024 & 2032
- Figure 8: Latin America Jakarta Data Center Market Revenue (Million), by Country 2024 & 2032
- Figure 9: Latin America Jakarta Data Center Market Revenue Share (%), by Country 2024 & 2032
- Figure 10: Middle East and Africa Jakarta Data Center Market Revenue (Million), by Country 2024 & 2032
- Figure 11: Middle East and Africa Jakarta Data Center Market Revenue Share (%), by Country 2024 & 2032
- Figure 12: North America Jakarta Data Center Market Revenue (Million), by DC Size 2024 & 2032
- Figure 13: North America Jakarta Data Center Market Revenue Share (%), by DC Size 2024 & 2032
- Figure 14: North America Jakarta Data Center Market Revenue (Million), by Tier Type 2024 & 2032
- Figure 15: North America Jakarta Data Center Market Revenue Share (%), by Tier Type 2024 & 2032
- Figure 16: North America Jakarta Data Center Market Revenue (Million), by Absorption 2024 & 2032
- Figure 17: North America Jakarta Data Center Market Revenue Share (%), by Absorption 2024 & 2032
- Figure 18: North America Jakarta Data Center Market Revenue (Million), by Country 2024 & 2032
- Figure 19: North America Jakarta Data Center Market Revenue Share (%), by Country 2024 & 2032
- Figure 20: South America Jakarta Data Center Market Revenue (Million), by DC Size 2024 & 2032
- Figure 21: South America Jakarta Data Center Market Revenue Share (%), by DC Size 2024 & 2032
- Figure 22: South America Jakarta Data Center Market Revenue (Million), by Tier Type 2024 & 2032
- Figure 23: South America Jakarta Data Center Market Revenue Share (%), by Tier Type 2024 & 2032
- Figure 24: South America Jakarta Data Center Market Revenue (Million), by Absorption 2024 & 2032
- Figure 25: South America Jakarta Data Center Market Revenue Share (%), by Absorption 2024 & 2032
- Figure 26: South America Jakarta Data Center Market Revenue (Million), by Country 2024 & 2032
- Figure 27: South America Jakarta Data Center Market Revenue Share (%), by Country 2024 & 2032
- Figure 28: Europe Jakarta Data Center Market Revenue (Million), by DC Size 2024 & 2032
- Figure 29: Europe Jakarta Data Center Market Revenue Share (%), by DC Size 2024 & 2032
- Figure 30: Europe Jakarta Data Center Market Revenue (Million), by Tier Type 2024 & 2032
- Figure 31: Europe Jakarta Data Center Market Revenue Share (%), by Tier Type 2024 & 2032
- Figure 32: Europe Jakarta Data Center Market Revenue (Million), by Absorption 2024 & 2032
- Figure 33: Europe Jakarta Data Center Market Revenue Share (%), by Absorption 2024 & 2032
- Figure 34: Europe Jakarta Data Center Market Revenue (Million), by Country 2024 & 2032
- Figure 35: Europe Jakarta Data Center Market Revenue Share (%), by Country 2024 & 2032
- Figure 36: Middle East & Africa Jakarta Data Center Market Revenue (Million), by DC Size 2024 & 2032
- Figure 37: Middle East & Africa Jakarta Data Center Market Revenue Share (%), by DC Size 2024 & 2032
- Figure 38: Middle East & Africa Jakarta Data Center Market Revenue (Million), by Tier Type 2024 & 2032
- Figure 39: Middle East & Africa Jakarta Data Center Market Revenue Share (%), by Tier Type 2024 & 2032
- Figure 40: Middle East & Africa Jakarta Data Center Market Revenue (Million), by Absorption 2024 & 2032
- Figure 41: Middle East & Africa Jakarta Data Center Market Revenue Share (%), by Absorption 2024 & 2032
- Figure 42: Middle East & Africa Jakarta Data Center Market Revenue (Million), by Country 2024 & 2032
- Figure 43: Middle East & Africa Jakarta Data Center Market Revenue Share (%), by Country 2024 & 2032
- Figure 44: Asia Pacific Jakarta Data Center Market Revenue (Million), by DC Size 2024 & 2032
- Figure 45: Asia Pacific Jakarta Data Center Market Revenue Share (%), by DC Size 2024 & 2032
- Figure 46: Asia Pacific Jakarta Data Center Market Revenue (Million), by Tier Type 2024 & 2032
- Figure 47: Asia Pacific Jakarta Data Center Market Revenue Share (%), by Tier Type 2024 & 2032
- Figure 48: Asia Pacific Jakarta Data Center Market Revenue (Million), by Absorption 2024 & 2032
- Figure 49: Asia Pacific Jakarta Data Center Market Revenue Share (%), by Absorption 2024 & 2032
- Figure 50: Asia Pacific Jakarta Data Center Market Revenue (Million), by Country 2024 & 2032
- Figure 51: Asia Pacific Jakarta Data Center Market Revenue Share (%), by Country 2024 & 2032
List of Tables
- Table 1: Global Jakarta Data Center Market Revenue Million Forecast, by Region 2019 & 2032
- Table 2: Global Jakarta Data Center Market Revenue Million Forecast, by DC Size 2019 & 2032
- Table 3: Global Jakarta Data Center Market Revenue Million Forecast, by Tier Type 2019 & 2032
- Table 4: Global Jakarta Data Center Market Revenue Million Forecast, by Absorption 2019 & 2032
- Table 5: Global Jakarta Data Center Market Revenue Million Forecast, by Region 2019 & 2032
- Table 6: Global Jakarta Data Center Market Revenue Million Forecast, by Country 2019 & 2032
- Table 7: Jakarta Data Center Market Revenue (Million) Forecast, by Application 2019 & 2032
- Table 8: Global Jakarta Data Center Market Revenue Million Forecast, by Country 2019 & 2032
- Table 9: Jakarta Data Center Market Revenue (Million) Forecast, by Application 2019 & 2032
- Table 10: Global Jakarta Data Center Market Revenue Million Forecast, by Country 2019 & 2032
- Table 11: Jakarta Data Center Market Revenue (Million) Forecast, by Application 2019 & 2032
- Table 12: Global Jakarta Data Center Market Revenue Million Forecast, by Country 2019 & 2032
- Table 13: Jakarta Data Center Market Revenue (Million) Forecast, by Application 2019 & 2032
- Table 14: Global Jakarta Data Center Market Revenue Million Forecast, by Country 2019 & 2032
- Table 15: Jakarta Data Center Market Revenue (Million) Forecast, by Application 2019 & 2032
- Table 16: Global Jakarta Data Center Market Revenue Million Forecast, by DC Size 2019 & 2032
- Table 17: Global Jakarta Data Center Market Revenue Million Forecast, by Tier Type 2019 & 2032
- Table 18: Global Jakarta Data Center Market Revenue Million Forecast, by Absorption 2019 & 2032
- Table 19: Global Jakarta Data Center Market Revenue Million Forecast, by Country 2019 & 2032
- Table 20: United States Jakarta Data Center Market Revenue (Million) Forecast, by Application 2019 & 2032
- Table 21: Canada Jakarta Data Center Market Revenue (Million) Forecast, by Application 2019 & 2032
- Table 22: Mexico Jakarta Data Center Market Revenue (Million) Forecast, by Application 2019 & 2032
- Table 23: Global Jakarta Data Center Market Revenue Million Forecast, by DC Size 2019 & 2032
- Table 24: Global Jakarta Data Center Market Revenue Million Forecast, by Tier Type 2019 & 2032
- Table 25: Global Jakarta Data Center Market Revenue Million Forecast, by Absorption 2019 & 2032
- Table 26: Global Jakarta Data Center Market Revenue Million Forecast, by Country 2019 & 2032
- Table 27: Brazil Jakarta Data Center Market Revenue (Million) Forecast, by Application 2019 & 2032
- Table 28: Argentina Jakarta Data Center Market Revenue (Million) Forecast, by Application 2019 & 2032
- Table 29: Rest of South America Jakarta Data Center Market Revenue (Million) Forecast, by Application 2019 & 2032
- Table 30: Global Jakarta Data Center Market Revenue Million Forecast, by DC Size 2019 & 2032
- Table 31: Global Jakarta Data Center Market Revenue Million Forecast, by Tier Type 2019 & 2032
- Table 32: Global Jakarta Data Center Market Revenue Million Forecast, by Absorption 2019 & 2032
- Table 33: Global Jakarta Data Center Market Revenue Million Forecast, by Country 2019 & 2032
- Table 34: United Kingdom Jakarta Data Center Market Revenue (Million) Forecast, by Application 2019 & 2032
- Table 35: Germany Jakarta Data Center Market Revenue (Million) Forecast, by Application 2019 & 2032
- Table 36: France Jakarta Data Center Market Revenue (Million) Forecast, by Application 2019 & 2032
- Table 37: Italy Jakarta Data Center Market Revenue (Million) Forecast, by Application 2019 & 2032
- Table 38: Spain Jakarta Data Center Market Revenue (Million) Forecast, by Application 2019 & 2032
- Table 39: Russia Jakarta Data Center Market Revenue (Million) Forecast, by Application 2019 & 2032
- Table 40: Benelux Jakarta Data Center Market Revenue (Million) Forecast, by Application 2019 & 2032
- Table 41: Nordics Jakarta Data Center Market Revenue (Million) Forecast, by Application 2019 & 2032
- Table 42: Rest of Europe Jakarta Data Center Market Revenue (Million) Forecast, by Application 2019 & 2032
- Table 43: Global Jakarta Data Center Market Revenue Million Forecast, by DC Size 2019 & 2032
- Table 44: Global Jakarta Data Center Market Revenue Million Forecast, by Tier Type 2019 & 2032
- Table 45: Global Jakarta Data Center Market Revenue Million Forecast, by Absorption 2019 & 2032
- Table 46: Global Jakarta Data Center Market Revenue Million Forecast, by Country 2019 & 2032
- Table 47: Turkey Jakarta Data Center Market Revenue (Million) Forecast, by Application 2019 & 2032
- Table 48: Israel Jakarta Data Center Market Revenue (Million) Forecast, by Application 2019 & 2032
- Table 49: GCC Jakarta Data Center Market Revenue (Million) Forecast, by Application 2019 & 2032
- Table 50: North Africa Jakarta Data Center Market Revenue (Million) Forecast, by Application 2019 & 2032
- Table 51: South Africa Jakarta Data Center Market Revenue (Million) Forecast, by Application 2019 & 2032
- Table 52: Rest of Middle East & Africa Jakarta Data Center Market Revenue (Million) Forecast, by Application 2019 & 2032
- Table 53: Global Jakarta Data Center Market Revenue Million Forecast, by DC Size 2019 & 2032
- Table 54: Global Jakarta Data Center Market Revenue Million Forecast, by Tier Type 2019 & 2032
- Table 55: Global Jakarta Data Center Market Revenue Million Forecast, by Absorption 2019 & 2032
- Table 56: Global Jakarta Data Center Market Revenue Million Forecast, by Country 2019 & 2032
- Table 57: China Jakarta Data Center Market Revenue (Million) Forecast, by Application 2019 & 2032
- Table 58: India Jakarta Data Center Market Revenue (Million) Forecast, by Application 2019 & 2032
- Table 59: Japan Jakarta Data Center Market Revenue (Million) Forecast, by Application 2019 & 2032
- Table 60: South Korea Jakarta Data Center Market Revenue (Million) Forecast, by Application 2019 & 2032
- Table 61: ASEAN Jakarta Data Center Market Revenue (Million) Forecast, by Application 2019 & 2032
- Table 62: Oceania Jakarta Data Center Market Revenue (Million) Forecast, by Application 2019 & 2032
- Table 63: Rest of Asia Pacific Jakarta Data Center Market Revenue (Million) Forecast, by Application 2019 & 2032
Frequently Asked Questions
1. What is the projected Compound Annual Growth Rate (CAGR) of the Jakarta Data Center Market?
The projected CAGR is approximately 16.49%.
2. Which companies are prominent players in the Jakarta Data Center Market?
Key companies in the market include PT Indosat Tbk (Big Data Exchange (BDx)), Space DC Pte Ltd, PT DWI Tunggal Putra (DTPNet), PT Jupiter Jala Arta (JupiterDC), Biznet Data Center, PT Sigma Cipta Caraka (Telkomsigma), Digital Edge DC, EdgeConneX Inc (GTN Data Centers), PT DCI Indonesia Tbk, NEX Data Center Indonesia, PT XL Axiata Tbk (Princeton Digital Group), NTT Ltd, Nusantara Data Center.
3. What are the main segments of the Jakarta Data Center Market?
The market segments include DC Size, Tier Type, Absorption.
4. Can you provide details about the market size?
The market size is estimated to be USD XX Million as of 2022.
5. What are some drivers contributing to market growth?
Regulations Promoting Proper Lighting for Worker Safety in Hazardous Locations; Rising Demand for Cost-effective and Energy-efficient LED Lighting Solutions.
6. What are the notable trends driving market growth?
Tier 4 is Expected to Hold Significant Share of the Market.
7. Are there any restraints impacting market growth?
High Costs of Equipment.
8. Can you provide examples of recent developments in the market?
Apr 2023: BDxIndonesia, a BDxaffiliate, began constructing a new greenfield data center, CGK3A, in TB Simatupang, South Jakarta. The data center, which has a capacity of 15 MW, seeks to deliver top data center services to Indonesian businesses and hyperscalers. The new 14,127-square-meter data center is outfitted with Tier 3 data center facilities, advanced security systems, automation technology, and high network uptime, as well as a below-average power usage effectiveness (PUE) of 1.4, which provides operational excellence and a sustainable solution without sacrificing productivity and scalability.
9. What pricing options are available for accessing the report?
Pricing options include single-user, multi-user, and enterprise licenses priced at USD 3800, USD 4500, and USD 5800 respectively.
10. Is the market size provided in terms of value or volume?
The market size is provided in terms of value, measured in Million.
11. Are there any specific market keywords associated with the report?
Yes, the market keyword associated with the report is "Jakarta Data Center Market," which aids in identifying and referencing the specific market segment covered.
12. How do I determine which pricing option suits my needs best?
The pricing options vary based on user requirements and access needs. Individual users may opt for single-user licenses, while businesses requiring broader access may choose multi-user or enterprise licenses for cost-effective access to the report.
13. Are there any additional resources or data provided in the Jakarta Data Center Market report?
While the report offers comprehensive insights, it's advisable to review the specific contents or supplementary materials provided to ascertain if additional resources or data are available.
14. How can I stay updated on further developments or reports in the Jakarta Data Center Market?
To stay informed about further developments, trends, and reports in the Jakarta Data Center Market, consider subscribing to industry newsletters, following relevant companies and organizations, or regularly checking reputable industry news sources and publications.
Methodology
Step 1 - Identification of Relevant Samples Size from Population Database


Step 2 - Approaches for Defining Global Market Size (Value, Volume* & Price*)

Note*: In applicable scenarios
Step 3 - Data Sources
Primary Research
- Web Analytics
- Survey Reports
- Research Institute
- Latest Research Reports
- Opinion Leaders
Secondary Research
- Annual Reports
- White Paper
- Latest Press Release
- Industry Association
- Paid Database
- Investor Presentations

Step 4 - Data Triangulation
Involves using different sources of information in order to increase the validity of a study
These sources are likely to be stakeholders in a program - participants, other researchers, program staff, other community members, and so on.
Then we put all data in single framework & apply various statistical tools to find out the dynamic on the market.
During the analysis stage, feedback from the stakeholder groups would be compared to determine areas of agreement as well as areas of divergence


