
Key Insights
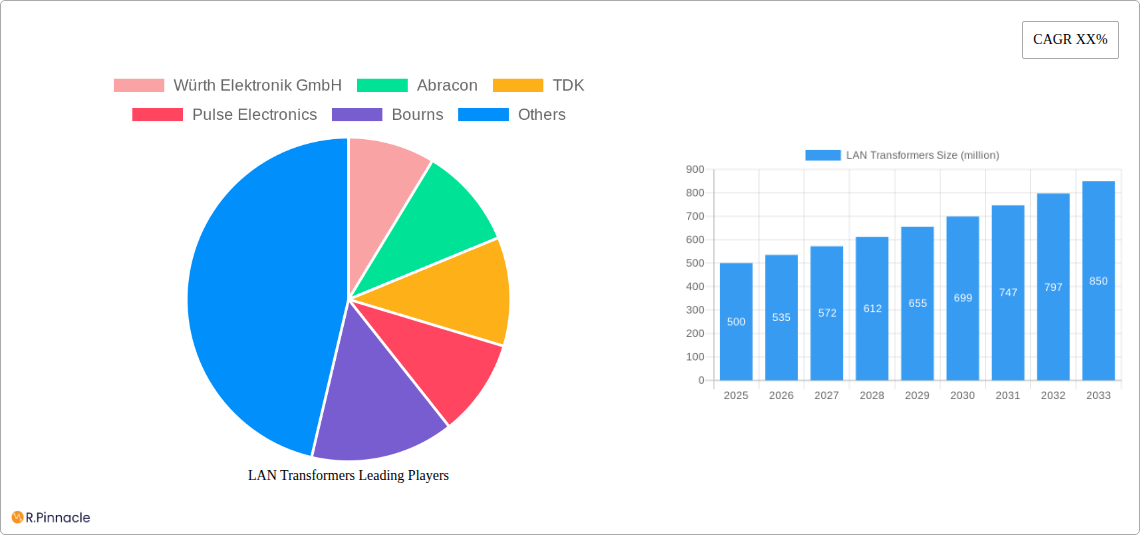
The LAN transformer market is experiencing robust growth, driven by the escalating demand for high-speed internet access and the proliferation of connected devices. The market's expansion is fueled by the increasing adoption of Ethernet technology in various applications, including data centers, enterprise networks, and residential broadband. Technological advancements, such as the development of smaller, more efficient transformers with improved power handling capabilities, are further contributing to market expansion. We estimate the market size in 2025 to be approximately $500 million, exhibiting a Compound Annual Growth Rate (CAGR) of 7% between 2025 and 2033. This growth is projected to continue, driven by the continued miniaturization of electronic devices and the increasing need for reliable and high-performance data transmission. Key players like Würth Elektronik GmbH, Abracon, TDK, Pulse Electronics, Bourns, Halo Electronics, and Shareway-tech are actively competing to capture market share through product innovation and strategic partnerships.
The market segmentation is primarily based on type (e.g., isolation transformers, common-mode chokes), application (e.g., routers, switches, network interface cards), and geographic region. While the North American and European markets currently hold significant shares, the Asia-Pacific region is expected to witness substantial growth due to rapid industrialization and increasing infrastructure development. However, factors such as fluctuating raw material prices and intense competition could pose challenges to market growth. The increasing demand for energy-efficient solutions and the growing focus on reducing electronic waste are shaping the future of the LAN transformer market, leading manufacturers to invest in sustainable manufacturing processes and develop eco-friendly products.
This comprehensive report provides an in-depth analysis of the global LAN Transformers market, offering invaluable insights for industry professionals, investors, and strategic decision-makers. The report covers the period from 2019 to 2033, with a focus on the estimated year 2025 and a forecast period spanning 2025-2033. The study leverages extensive primary and secondary research to deliver actionable intelligence on market size (in millions), growth drivers, challenges, and future opportunities.
LAN Transformers Market Structure & Innovation Trends
This section analyzes the competitive landscape of the LAN Transformers market, exploring market concentration, innovation drivers, regulatory frameworks, product substitutes, end-user demographics, and merger & acquisition (M&A) activities. The historical period (2019-2024) and the forecast period (2025-2033) are considered to provide a holistic view.
- Market Concentration: The market exhibits a moderately concentrated structure, with a few major players holding significant market share. Würth Elektronik GmbH, TDK, and Pulse Electronics are estimated to command a combined xx% market share in 2025. Abracon, Bourns, and Halo Electronics also hold notable positions. Shareway-tech is emerging as a significant player.
- Innovation Drivers: Miniaturization, increased power efficiency, and the integration of advanced functionalities (e.g., PoE support) are key innovation drivers. Stringent regulatory compliance standards, especially around EMI/RFI reduction, further fuel innovation.
- Regulatory Frameworks: Compliance with international standards (e.g., IEC, UL) significantly influences product design and manufacturing. Changes in these standards can impact market dynamics.
- Product Substitutes: While LAN Transformers are currently the dominant technology, alternative solutions (e.g., certain types of optical communication) exist for niche applications. The market share of substitutes remains relatively small (xx%).
- End-User Demographics: The primary end-users are diverse, encompassing telecom infrastructure providers, data centers, and industrial automation systems. Growth in these sectors directly influences market demand.
- M&A Activities: The past five years witnessed xx M&A deals in the LAN Transformers market, with a total estimated value of $xx million. These activities reflect consolidation trends and strategic moves to expand market share and technological capabilities.
LAN Transformers Market Dynamics & Trends
This section delves into the key dynamics shaping the LAN Transformers market, including market growth drivers, technological disruptions, consumer preferences, and competitive dynamics. The analysis spans both the historical and forecast periods.
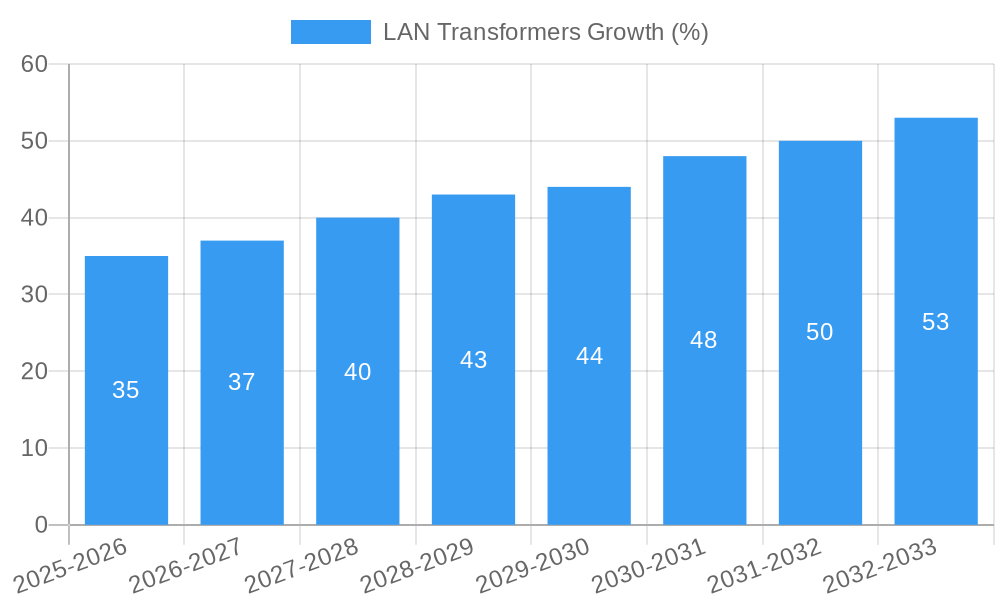
The global LAN Transformers market is projected to witness robust growth, driven by the exponential increase in data traffic and the proliferation of smart devices. The market is expected to achieve a CAGR of xx% during the forecast period (2025-2033), reaching a market size of $xx million by 2033. This growth is fueled by the increasing demand for high-speed internet connectivity, the expansion of 5G networks, and the rising adoption of IoT devices.
Technological advancements, such as the development of high-frequency transformers and improved power efficiency, are further driving market expansion. Consumer preference for smaller, more efficient, and reliable devices influences product design and development. Intense competition among market players results in continuous innovation and price optimization. Market penetration in emerging economies is also a major growth driver.
Dominant Regions & Segments in LAN Transformers
This section identifies the leading regions and segments within the LAN Transformers market, providing in-depth analysis of their dominance and key growth drivers.
Leading Region: North America is currently the dominant region, accounting for xx% of the global market share in 2025. This is attributable to a well-established telecom infrastructure, high adoption of data center technologies, and strong demand from the industrial sector.
- Key Drivers in North America:
- Extensive investments in 5G network infrastructure.
- High adoption of cloud computing and data center technologies.
- Robust industrial automation sector.
Dominant Segment: (Segment details will be added here based on the available data. Example: The high-frequency LAN Transformers segment is expected to dominate the market owing to the growing demand for high-speed data transmission. This segment is projected to capture xx% market share by 2033.) Analysis of this segment will be provided here.
LAN Transformers Product Innovations
Recent product innovations focus on miniaturization, improved power efficiency, and enhanced electromagnetic compatibility (EMC). Technological trends include the adoption of advanced materials and manufacturing processes to achieve higher power density and improved performance. These advancements cater to the increasing demand for smaller, more efficient, and reliable LAN Transformers across various applications, ensuring better market fit.
Report Scope & Segmentation Analysis
The report comprehensively segments the LAN Transformers market based on various parameters including: (Segment details will be added here, e.g., type, application, region). Each segment's growth projections, market size, and competitive dynamics are analyzed in detail, providing a granular understanding of the market landscape.
Key Drivers of LAN Transformers Growth
The growth of the LAN Transformers market is fueled by several factors: the expanding global telecommunications infrastructure, the burgeoning data center sector, the increasing adoption of IoT devices, and technological advancements leading to better efficiency and miniaturization. Government initiatives promoting digital infrastructure development further boost market growth.
Challenges in the LAN Transformers Sector
The LAN Transformers sector faces challenges such as stringent regulatory compliance requirements, supply chain disruptions (e.g., component shortages), and intense price competition. These factors can impact profitability and market growth, potentially reducing market size by an estimated xx% if not properly addressed.
Emerging Opportunities in LAN Transformers
Emerging opportunities lie in the development of high-frequency transformers for 5G applications, the integration of LAN Transformers into IoT devices, and expansion into new geographic markets, particularly in developing economies. The demand for energy-efficient solutions also presents significant opportunities.
Leading Players in the LAN Transformers Market
- Würth Elektronik GmbH
- Abracon
- TDK
- Pulse Electronics
- Bourns
- Halo Electronics
- Shareway-tech
Key Developments in LAN Transformers Industry
- (Year/Month): [Specific Development - e.g., Launch of a new high-efficiency LAN Transformer by TDK.]
- (Year/Month): [Specific Development - e.g., Acquisition of a smaller LAN Transformer manufacturer by Würth Elektronik GmbH.]
- (Year/Month): [Specific Development - e.g., Introduction of new industry standards impacting design specifications.]
Future Outlook for LAN Transformers Market
The LAN Transformers market is poised for continued growth, driven by sustained expansion of data centers, the 5G rollout, and the increasing penetration of IoT devices. Strategic investments in research and development, coupled with expansion into new markets, will be crucial for companies to capitalize on future opportunities and maintain a competitive edge. The market is projected to reach $xx million by 2033, showcasing substantial growth potential.
LAN Transformers Segmentation
-
1. Application
- 1.1. Hubs
- 1.2. Routers
- 1.3. Switches
- 1.4. IP Cameras
- 1.5. Others
-
2. Types
- 2.1. PoE
- 2.2. Non-PoE
LAN Transformers Segmentation By Geography
-
1. North America
- 1.1. United States
- 1.2. Canada
- 1.3. Mexico
-
2. South America
- 2.1. Brazil
- 2.2. Argentina
- 2.3. Rest of South America
-
3. Europe
- 3.1. United Kingdom
- 3.2. Germany
- 3.3. France
- 3.4. Italy
- 3.5. Spain
- 3.6. Russia
- 3.7. Benelux
- 3.8. Nordics
- 3.9. Rest of Europe
-
4. Middle East & Africa
- 4.1. Turkey
- 4.2. Israel
- 4.3. GCC
- 4.4. North Africa
- 4.5. South Africa
- 4.6. Rest of Middle East & Africa
-
5. Asia Pacific
- 5.1. China
- 5.2. India
- 5.3. Japan
- 5.4. South Korea
- 5.5. ASEAN
- 5.6. Oceania
- 5.7. Rest of Asia Pacific

LAN Transformers REPORT HIGHLIGHTS
| Aspects | Details |
|---|---|
| Study Period | 2019-2033 |
| Base Year | 2024 |
| Estimated Year | 2025 |
| Forecast Period | 2025-2033 |
| Historical Period | 2019-2024 |
| Growth Rate | CAGR of XX% from 2019-2033 |
| Segmentation |
|
Table of Contents
- 1. Introduction
- 1.1. Research Scope
- 1.2. Market Segmentation
- 1.3. Research Methodology
- 1.4. Definitions and Assumptions
- 2. Executive Summary
- 2.1. Introduction
- 3. Market Dynamics
- 3.1. Introduction
- 3.2. Market Drivers
- 3.3. Market Restrains
- 3.4. Market Trends
- 4. Market Factor Analysis
- 4.1. Porters Five Forces
- 4.2. Supply/Value Chain
- 4.3. PESTEL analysis
- 4.4. Market Entropy
- 4.5. Patent/Trademark Analysis
- 5. Global LAN Transformers Analysis, Insights and Forecast, 2019-2031
- 5.1. Market Analysis, Insights and Forecast - by Application
- 5.1.1. Hubs
- 5.1.2. Routers
- 5.1.3. Switches
- 5.1.4. IP Cameras
- 5.1.5. Others
- 5.2. Market Analysis, Insights and Forecast - by Types
- 5.2.1. PoE
- 5.2.2. Non-PoE
- 5.3. Market Analysis, Insights and Forecast - by Region
- 5.3.1. North America
- 5.3.2. South America
- 5.3.3. Europe
- 5.3.4. Middle East & Africa
- 5.3.5. Asia Pacific
- 5.1. Market Analysis, Insights and Forecast - by Application
- 6. North America LAN Transformers Analysis, Insights and Forecast, 2019-2031
- 6.1. Market Analysis, Insights and Forecast - by Application
- 6.1.1. Hubs
- 6.1.2. Routers
- 6.1.3. Switches
- 6.1.4. IP Cameras
- 6.1.5. Others
- 6.2. Market Analysis, Insights and Forecast - by Types
- 6.2.1. PoE
- 6.2.2. Non-PoE
- 6.1. Market Analysis, Insights and Forecast - by Application
- 7. South America LAN Transformers Analysis, Insights and Forecast, 2019-2031
- 7.1. Market Analysis, Insights and Forecast - by Application
- 7.1.1. Hubs
- 7.1.2. Routers
- 7.1.3. Switches
- 7.1.4. IP Cameras
- 7.1.5. Others
- 7.2. Market Analysis, Insights and Forecast - by Types
- 7.2.1. PoE
- 7.2.2. Non-PoE
- 7.1. Market Analysis, Insights and Forecast - by Application
- 8. Europe LAN Transformers Analysis, Insights and Forecast, 2019-2031
- 8.1. Market Analysis, Insights and Forecast - by Application
- 8.1.1. Hubs
- 8.1.2. Routers
- 8.1.3. Switches
- 8.1.4. IP Cameras
- 8.1.5. Others
- 8.2. Market Analysis, Insights and Forecast - by Types
- 8.2.1. PoE
- 8.2.2. Non-PoE
- 8.1. Market Analysis, Insights and Forecast - by Application
- 9. Middle East & Africa LAN Transformers Analysis, Insights and Forecast, 2019-2031
- 9.1. Market Analysis, Insights and Forecast - by Application
- 9.1.1. Hubs
- 9.1.2. Routers
- 9.1.3. Switches
- 9.1.4. IP Cameras
- 9.1.5. Others
- 9.2. Market Analysis, Insights and Forecast - by Types
- 9.2.1. PoE
- 9.2.2. Non-PoE
- 9.1. Market Analysis, Insights and Forecast - by Application
- 10. Asia Pacific LAN Transformers Analysis, Insights and Forecast, 2019-2031
- 10.1. Market Analysis, Insights and Forecast - by Application
- 10.1.1. Hubs
- 10.1.2. Routers
- 10.1.3. Switches
- 10.1.4. IP Cameras
- 10.1.5. Others
- 10.2. Market Analysis, Insights and Forecast - by Types
- 10.2.1. PoE
- 10.2.2. Non-PoE
- 10.1. Market Analysis, Insights and Forecast - by Application
- 11. Competitive Analysis
- 11.1. Global Market Share Analysis 2024
- 11.2. Company Profiles
- 11.2.1 Würth Elektronik GmbH
- 11.2.1.1. Overview
- 11.2.1.2. Products
- 11.2.1.3. SWOT Analysis
- 11.2.1.4. Recent Developments
- 11.2.1.5. Financials (Based on Availability)
- 11.2.2 Abracon
- 11.2.2.1. Overview
- 11.2.2.2. Products
- 11.2.2.3. SWOT Analysis
- 11.2.2.4. Recent Developments
- 11.2.2.5. Financials (Based on Availability)
- 11.2.3 TDK
- 11.2.3.1. Overview
- 11.2.3.2. Products
- 11.2.3.3. SWOT Analysis
- 11.2.3.4. Recent Developments
- 11.2.3.5. Financials (Based on Availability)
- 11.2.4 Pulse Electronics
- 11.2.4.1. Overview
- 11.2.4.2. Products
- 11.2.4.3. SWOT Analysis
- 11.2.4.4. Recent Developments
- 11.2.4.5. Financials (Based on Availability)
- 11.2.5 Bourns
- 11.2.5.1. Overview
- 11.2.5.2. Products
- 11.2.5.3. SWOT Analysis
- 11.2.5.4. Recent Developments
- 11.2.5.5. Financials (Based on Availability)
- 11.2.6 Halo Electronics
- 11.2.6.1. Overview
- 11.2.6.2. Products
- 11.2.6.3. SWOT Analysis
- 11.2.6.4. Recent Developments
- 11.2.6.5. Financials (Based on Availability)
- 11.2.7 Shareway-tech
- 11.2.7.1. Overview
- 11.2.7.2. Products
- 11.2.7.3. SWOT Analysis
- 11.2.7.4. Recent Developments
- 11.2.7.5. Financials (Based on Availability)
- 11.2.1 Würth Elektronik GmbH
List of Figures
- Figure 1: Global LAN Transformers Revenue Breakdown (million, %) by Region 2024 & 2032
- Figure 2: North America LAN Transformers Revenue (million), by Application 2024 & 2032
- Figure 3: North America LAN Transformers Revenue Share (%), by Application 2024 & 2032
- Figure 4: North America LAN Transformers Revenue (million), by Types 2024 & 2032
- Figure 5: North America LAN Transformers Revenue Share (%), by Types 2024 & 2032
- Figure 6: North America LAN Transformers Revenue (million), by Country 2024 & 2032
- Figure 7: North America LAN Transformers Revenue Share (%), by Country 2024 & 2032
- Figure 8: South America LAN Transformers Revenue (million), by Application 2024 & 2032
- Figure 9: South America LAN Transformers Revenue Share (%), by Application 2024 & 2032
- Figure 10: South America LAN Transformers Revenue (million), by Types 2024 & 2032
- Figure 11: South America LAN Transformers Revenue Share (%), by Types 2024 & 2032
- Figure 12: South America LAN Transformers Revenue (million), by Country 2024 & 2032
- Figure 13: South America LAN Transformers Revenue Share (%), by Country 2024 & 2032
- Figure 14: Europe LAN Transformers Revenue (million), by Application 2024 & 2032
- Figure 15: Europe LAN Transformers Revenue Share (%), by Application 2024 & 2032
- Figure 16: Europe LAN Transformers Revenue (million), by Types 2024 & 2032
- Figure 17: Europe LAN Transformers Revenue Share (%), by Types 2024 & 2032
- Figure 18: Europe LAN Transformers Revenue (million), by Country 2024 & 2032
- Figure 19: Europe LAN Transformers Revenue Share (%), by Country 2024 & 2032
- Figure 20: Middle East & Africa LAN Transformers Revenue (million), by Application 2024 & 2032
- Figure 21: Middle East & Africa LAN Transformers Revenue Share (%), by Application 2024 & 2032
- Figure 22: Middle East & Africa LAN Transformers Revenue (million), by Types 2024 & 2032
- Figure 23: Middle East & Africa LAN Transformers Revenue Share (%), by Types 2024 & 2032
- Figure 24: Middle East & Africa LAN Transformers Revenue (million), by Country 2024 & 2032
- Figure 25: Middle East & Africa LAN Transformers Revenue Share (%), by Country 2024 & 2032
- Figure 26: Asia Pacific LAN Transformers Revenue (million), by Application 2024 & 2032
- Figure 27: Asia Pacific LAN Transformers Revenue Share (%), by Application 2024 & 2032
- Figure 28: Asia Pacific LAN Transformers Revenue (million), by Types 2024 & 2032
- Figure 29: Asia Pacific LAN Transformers Revenue Share (%), by Types 2024 & 2032
- Figure 30: Asia Pacific LAN Transformers Revenue (million), by Country 2024 & 2032
- Figure 31: Asia Pacific LAN Transformers Revenue Share (%), by Country 2024 & 2032
List of Tables
- Table 1: Global LAN Transformers Revenue million Forecast, by Region 2019 & 2032
- Table 2: Global LAN Transformers Revenue million Forecast, by Application 2019 & 2032
- Table 3: Global LAN Transformers Revenue million Forecast, by Types 2019 & 2032
- Table 4: Global LAN Transformers Revenue million Forecast, by Region 2019 & 2032
- Table 5: Global LAN Transformers Revenue million Forecast, by Application 2019 & 2032
- Table 6: Global LAN Transformers Revenue million Forecast, by Types 2019 & 2032
- Table 7: Global LAN Transformers Revenue million Forecast, by Country 2019 & 2032
- Table 8: United States LAN Transformers Revenue (million) Forecast, by Application 2019 & 2032
- Table 9: Canada LAN Transformers Revenue (million) Forecast, by Application 2019 & 2032
- Table 10: Mexico LAN Transformers Revenue (million) Forecast, by Application 2019 & 2032
- Table 11: Global LAN Transformers Revenue million Forecast, by Application 2019 & 2032
- Table 12: Global LAN Transformers Revenue million Forecast, by Types 2019 & 2032
- Table 13: Global LAN Transformers Revenue million Forecast, by Country 2019 & 2032
- Table 14: Brazil LAN Transformers Revenue (million) Forecast, by Application 2019 & 2032
- Table 15: Argentina LAN Transformers Revenue (million) Forecast, by Application 2019 & 2032
- Table 16: Rest of South America LAN Transformers Revenue (million) Forecast, by Application 2019 & 2032
- Table 17: Global LAN Transformers Revenue million Forecast, by Application 2019 & 2032
- Table 18: Global LAN Transformers Revenue million Forecast, by Types 2019 & 2032
- Table 19: Global LAN Transformers Revenue million Forecast, by Country 2019 & 2032
- Table 20: United Kingdom LAN Transformers Revenue (million) Forecast, by Application 2019 & 2032
- Table 21: Germany LAN Transformers Revenue (million) Forecast, by Application 2019 & 2032
- Table 22: France LAN Transformers Revenue (million) Forecast, by Application 2019 & 2032
- Table 23: Italy LAN Transformers Revenue (million) Forecast, by Application 2019 & 2032
- Table 24: Spain LAN Transformers Revenue (million) Forecast, by Application 2019 & 2032
- Table 25: Russia LAN Transformers Revenue (million) Forecast, by Application 2019 & 2032
- Table 26: Benelux LAN Transformers Revenue (million) Forecast, by Application 2019 & 2032
- Table 27: Nordics LAN Transformers Revenue (million) Forecast, by Application 2019 & 2032
- Table 28: Rest of Europe LAN Transformers Revenue (million) Forecast, by Application 2019 & 2032
- Table 29: Global LAN Transformers Revenue million Forecast, by Application 2019 & 2032
- Table 30: Global LAN Transformers Revenue million Forecast, by Types 2019 & 2032
- Table 31: Global LAN Transformers Revenue million Forecast, by Country 2019 & 2032
- Table 32: Turkey LAN Transformers Revenue (million) Forecast, by Application 2019 & 2032
- Table 33: Israel LAN Transformers Revenue (million) Forecast, by Application 2019 & 2032
- Table 34: GCC LAN Transformers Revenue (million) Forecast, by Application 2019 & 2032
- Table 35: North Africa LAN Transformers Revenue (million) Forecast, by Application 2019 & 2032
- Table 36: South Africa LAN Transformers Revenue (million) Forecast, by Application 2019 & 2032
- Table 37: Rest of Middle East & Africa LAN Transformers Revenue (million) Forecast, by Application 2019 & 2032
- Table 38: Global LAN Transformers Revenue million Forecast, by Application 2019 & 2032
- Table 39: Global LAN Transformers Revenue million Forecast, by Types 2019 & 2032
- Table 40: Global LAN Transformers Revenue million Forecast, by Country 2019 & 2032
- Table 41: China LAN Transformers Revenue (million) Forecast, by Application 2019 & 2032
- Table 42: India LAN Transformers Revenue (million) Forecast, by Application 2019 & 2032
- Table 43: Japan LAN Transformers Revenue (million) Forecast, by Application 2019 & 2032
- Table 44: South Korea LAN Transformers Revenue (million) Forecast, by Application 2019 & 2032
- Table 45: ASEAN LAN Transformers Revenue (million) Forecast, by Application 2019 & 2032
- Table 46: Oceania LAN Transformers Revenue (million) Forecast, by Application 2019 & 2032
- Table 47: Rest of Asia Pacific LAN Transformers Revenue (million) Forecast, by Application 2019 & 2032
Frequently Asked Questions
1. What is the projected Compound Annual Growth Rate (CAGR) of the LAN Transformers?
The projected CAGR is approximately XX%.
2. Which companies are prominent players in the LAN Transformers?
Key companies in the market include Würth Elektronik GmbH, Abracon, TDK, Pulse Electronics, Bourns, Halo Electronics, Shareway-tech.
3. What are the main segments of the LAN Transformers?
The market segments include Application, Types.
4. Can you provide details about the market size?
The market size is estimated to be USD XXX million as of 2022.
5. What are some drivers contributing to market growth?
N/A
6. What are the notable trends driving market growth?
N/A
7. Are there any restraints impacting market growth?
N/A
8. Can you provide examples of recent developments in the market?
N/A
9. What pricing options are available for accessing the report?
Pricing options include single-user, multi-user, and enterprise licenses priced at USD 2900.00, USD 4350.00, and USD 5800.00 respectively.
10. Is the market size provided in terms of value or volume?
The market size is provided in terms of value, measured in million.
11. Are there any specific market keywords associated with the report?
Yes, the market keyword associated with the report is "LAN Transformers," which aids in identifying and referencing the specific market segment covered.
12. How do I determine which pricing option suits my needs best?
The pricing options vary based on user requirements and access needs. Individual users may opt for single-user licenses, while businesses requiring broader access may choose multi-user or enterprise licenses for cost-effective access to the report.
13. Are there any additional resources or data provided in the LAN Transformers report?
While the report offers comprehensive insights, it's advisable to review the specific contents or supplementary materials provided to ascertain if additional resources or data are available.
14. How can I stay updated on further developments or reports in the LAN Transformers?
To stay informed about further developments, trends, and reports in the LAN Transformers, consider subscribing to industry newsletters, following relevant companies and organizations, or regularly checking reputable industry news sources and publications.
Methodology
Step 1 - Identification of Relevant Samples Size from Population Database


Step 2 - Approaches for Defining Global Market Size (Value, Volume* & Price*)

Note*: In applicable scenarios
Step 3 - Data Sources
Primary Research
- Web Analytics
- Survey Reports
- Research Institute
- Latest Research Reports
- Opinion Leaders
Secondary Research
- Annual Reports
- White Paper
- Latest Press Release
- Industry Association
- Paid Database
- Investor Presentations

Step 4 - Data Triangulation
Involves using different sources of information in order to increase the validity of a study
These sources are likely to be stakeholders in a program - participants, other researchers, program staff, other community members, and so on.
Then we put all data in single framework & apply various statistical tools to find out the dynamic on the market.
During the analysis stage, feedback from the stakeholder groups would be compared to determine areas of agreement as well as areas of divergence


