
Key Insights
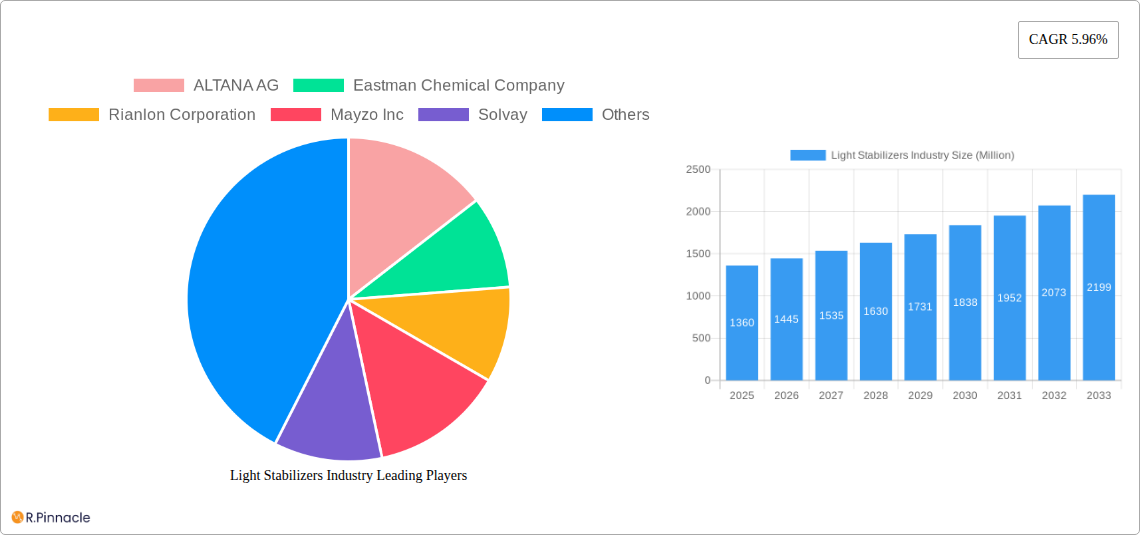
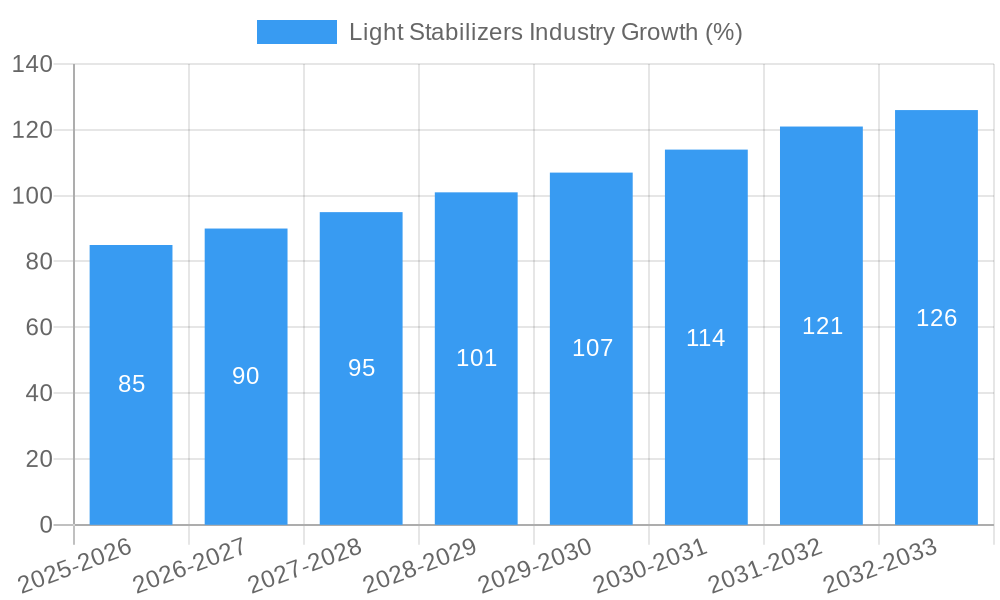
The global light stabilizers market, valued at $1.36 billion in 2025, is projected to experience robust growth, driven by a Compound Annual Growth Rate (CAGR) of 5.96% from 2025 to 2033. This expansion is fueled by several key factors. The increasing demand for durable and long-lasting polymers across diverse end-use industries like packaging (particularly food packaging requiring UV protection), automotive (to extend the lifespan of exterior components), and building and construction (for enhanced weather resistance in materials) is a significant driver. Furthermore, stringent regulations concerning the degradation of plastics and the environmental impact of UV degradation are pushing manufacturers towards incorporating light stabilizers as a crucial additive in their products. Technological advancements leading to the development of more efficient and environmentally friendly light stabilizers are also contributing to market growth. The market is segmented by type (UV absorbers, Hindered Amine Light Stabilizers (HALS), quenchers, and antioxidants) and by end-user industry, reflecting the diverse applications of these stabilizers. Competition within the market is intense, with major players like BASF, Clariant, and Eastman Chemical Company constantly innovating to capture market share and meet growing demand. Geographic growth will likely be driven by increasing industrialization and construction activity in regions like Asia Pacific, particularly in rapidly developing economies like India and China.
While the market exhibits strong growth potential, challenges remain. Fluctuations in raw material prices and the ongoing research and development of alternative stabilization technologies could influence market dynamics. The need to balance cost-effectiveness with environmental sustainability presents a key challenge for manufacturers. Further, regulatory changes impacting the use of certain stabilizer types in specific applications may pose short-term disruptions. However, the overall outlook for the light stabilizers market remains positive, driven by the inherent need for improved durability and longevity of polymer-based products across a wide array of applications. The market’s steady growth will likely continue through 2033, driven by sustained demand from key sectors.
Light Stabilizers Industry Report: 2019-2033 Forecast
This comprehensive report provides a detailed analysis of the Light Stabilizers industry, offering invaluable insights for industry professionals, investors, and strategic planners. With a study period spanning 2019-2033, a base year of 2025, and a forecast period of 2025-2033, this report delivers a robust understanding of current market dynamics and future growth trajectories. The market is valued at xx Million in the estimated year 2025 and is projected to reach xx Million by 2033, exhibiting a CAGR of xx%.
Light Stabilizers Industry Market Structure & Innovation Trends
The Light Stabilizers market is moderately concentrated, with key players such as ALTANA AG, Eastman Chemical Company, BASF SE, and Solvay holding significant market share. However, the presence of numerous smaller players and regional manufacturers indicates a competitive landscape. Innovation is driven by the need for enhanced UV protection, improved thermal stability, and the development of sustainable and eco-friendly solutions. Stringent regulatory frameworks regarding the use of certain chemicals, particularly in packaging and consumer goods, are shaping product development. The market sees substantial M&A activity, with deal values exceeding xx Million in recent years, indicating consolidation and expansion strategies amongst key players.
- Market Concentration: Moderately concentrated, with top players holding xx% market share (estimated).
- Innovation Drivers: Enhanced UV protection, improved thermal stability, sustainability, regulatory compliance.
- M&A Activity: Significant activity with deal values exceeding xx Million annually (estimated).
- Product Substitutes: Limited, with some natural alternatives emerging but lacking widespread adoption.
- End-User Demographics: Diverse, encompassing various industries with varying demand for specific light stabilizer types.
Light Stabilizers Industry Market Dynamics & Trends
The Light Stabilizers market exhibits robust growth, driven by the increasing demand for durable and long-lasting products across diverse end-use industries. Technological advancements in stabilizer formulations, particularly in UV absorbers and HALS, are expanding applications and enhancing product performance. Consumer preference for environmentally friendly products is influencing the development of bio-based and biodegradable light stabilizers. The competitive landscape is characterized by ongoing innovation, capacity expansions, and strategic partnerships. Market penetration is particularly high in the packaging and automotive sectors, with significant growth potential observed in the building and construction, and agricultural segments.
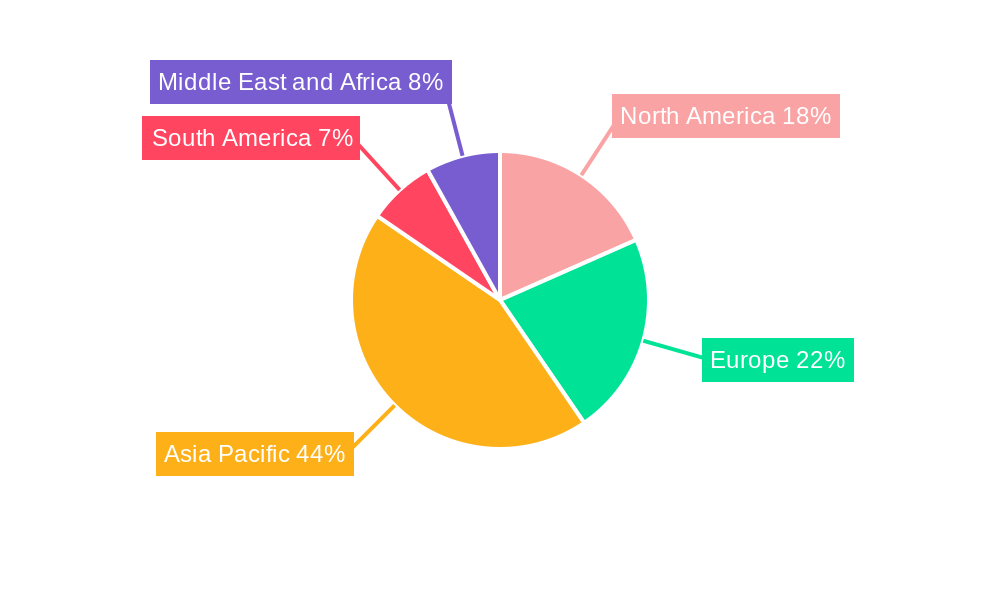
Dominant Regions & Segments in Light Stabilizers Industry
The Asia-Pacific region currently dominates the Light Stabilizers market, driven by robust economic growth, substantial manufacturing activity, and increasing demand from various end-use sectors. Within the types of stabilizers, Hindered Amine Light Stabilizers (HALS) represent the largest segment, owing to their superior performance and widespread applicability. In terms of end-user industries, the packaging sector leads the market due to the high demand for light stabilizers in plastic films, containers, and other packaging materials.
- Key Drivers in Asia-Pacific: Rapid economic growth, expanding manufacturing base, rising disposable incomes.
- HALS Dominance: Superior performance and broad applicability.
- Packaging Sector Leadership: High demand for light stabilizers in plastic packaging applications.
- Automotive Industry Growth: Increasing demand for UV and heat protection in automotive components.
Light Stabilizers Industry Product Innovations
Recent innovations focus on enhanced UV protection across broader spectral ranges, including UV-C radiation, as exemplified by Solvay's new UV-C stabilizer range. Formulations are increasingly designed to offer superior thermal stability, reduce environmental impact, and meet stringent regulatory requirements. These developments expand the applications of light stabilizers into niche markets and enhance the performance of existing applications, fostering increased market penetration.
Report Scope & Segmentation Analysis
This report segments the Light Stabilizers market by type (UV Absorbers, HALS, Quenchers, Antioxidants) and end-user industry (Packaging, Automotive, Agriculture, Building & Construction, Adhesives & Sealants, Other). Each segment's growth projections, market size, and competitive dynamics are thoroughly analyzed. For instance, the HALS segment is expected to experience strong growth due to its superior performance characteristics, while the packaging sector continues to be a major driver of market demand.
Key Drivers of Light Stabilizers Industry Growth
Key growth drivers include the expanding use of plastics in various industries, stringent regulatory requirements for UV protection and durability, the need for enhanced product longevity, and increasing consumer awareness of the benefits of UV protection. Technological advancements leading to better-performing and sustainable solutions also fuel market expansion.
Challenges in the Light Stabilizers Industry Sector
The industry faces challenges such as fluctuating raw material prices, stringent environmental regulations, and increasing competition from both established and emerging players. Supply chain disruptions, particularly in the wake of global events, can impact production and market availability. These challenges necessitate strategic planning and adaptation by industry participants.
Emerging Opportunities in Light Stabilizers Industry
Opportunities lie in developing bio-based and biodegradable light stabilizers to cater to the growing demand for sustainable solutions. Expanding into new applications, such as flexible electronics and medical devices, also presents significant growth potential. Further innovation in UV-C stabilization technology opens doors to new high-value applications.
Leading Players in the Light Stabilizers Industry Market
- ALTANA AG
- Eastman Chemical Company
- Rianlon Corporation
- Mayzo Inc
- Solvay
- SABO S p A
- CLARIANT
- Everlight Chemical Industrial Co
- SI Group Inc (SK Capital Partners)
- Chitec Technology Co Ltd
- ADEKA CORPORATION
- Lycus Ltd LLC
- SONGWON
- UniteChem Group
- BASF SE
Key Developments in Light Stabilizers Industry
- March 2022: BASF SE announced increased production capacity for its HALS products (Tinuvin, Chimassorb, Uvinul) at Italian and German sites.
- July 2022: Solvay launched an innovative UV-C stabilizer range for polyolefin surfaces in hygiene applications.
Future Outlook for Light Stabilizers Industry Market
The Light Stabilizers market is poised for continued growth, driven by advancements in stabilizer technology, the increasing demand for high-performance materials, and the growing focus on sustainability. Strategic partnerships, acquisitions, and capacity expansions will further shape the market landscape, creating opportunities for both established players and new entrants.
Light Stabilizers Industry Segmentation
-
1. Type
- 1.1. UV Absorbers
- 1.2. Hindered Amine Light Stabilizers (HALS)
- 1.3. Quenchers
- 1.4. Antioxidants
-
2. End-User Industry
- 2.1. Packaging
- 2.2. Automotive
- 2.3. Agriculture
- 2.4. Building and Construction
- 2.5. Adhesives and Sealants
- 2.6. Other End-User Industries
Light Stabilizers Industry Segmentation By Geography
-
1. Asia Pacific
- 1.1. China
- 1.2. India
- 1.3. Japan
- 1.4. South Korea
- 1.5. Rest of Asia Pacific
-
2. North America
- 2.1. United States
- 2.2. Canada
- 2.3. Mexico
-
3. Europe
- 3.1. Germany
- 3.2. United Kingdom
- 3.3. France
- 3.4. Italy
- 3.5. Rest of Europe
-
4. South America
- 4.1. Brazil
- 4.2. Argentina
- 4.3. Rest of South America
-
5. Middle East and Africa
- 5.1. Saudi Arabia
- 5.2. South Africa
- 5.3. Rest of Middle East and Africa
Light Stabilizers Industry REPORT HIGHLIGHTS
| Aspects | Details |
|---|---|
| Study Period | 2019-2033 |
| Base Year | 2024 |
| Estimated Year | 2025 |
| Forecast Period | 2025-2033 |
| Historical Period | 2019-2024 |
| Growth Rate | CAGR of 5.96% from 2019-2033 |
| Segmentation |
|
Table of Contents
- 1. Introduction
- 1.1. Research Scope
- 1.2. Market Segmentation
- 1.3. Research Methodology
- 1.4. Definitions and Assumptions
- 2. Executive Summary
- 2.1. Introduction
- 3. Market Dynamics
- 3.1. Introduction
- 3.2. Market Drivers
- 3.2.1. Rising Consumption in Polymer Industry; Increasing Demand for Wood Coatings
- 3.3. Market Restrains
- 3.3.1. Fluctuations in Raw Material Prices
- 3.4. Market Trends
- 3.4.1. Automotive Sector to Dominate the Market
- 4. Market Factor Analysis
- 4.1. Porters Five Forces
- 4.2. Supply/Value Chain
- 4.3. PESTEL analysis
- 4.4. Market Entropy
- 4.5. Patent/Trademark Analysis
- 5. Global Light Stabilizers Industry Analysis, Insights and Forecast, 2019-2031
- 5.1. Market Analysis, Insights and Forecast - by Type
- 5.1.1. UV Absorbers
- 5.1.2. Hindered Amine Light Stabilizers (HALS)
- 5.1.3. Quenchers
- 5.1.4. Antioxidants
- 5.2. Market Analysis, Insights and Forecast - by End-User Industry
- 5.2.1. Packaging
- 5.2.2. Automotive
- 5.2.3. Agriculture
- 5.2.4. Building and Construction
- 5.2.5. Adhesives and Sealants
- 5.2.6. Other End-User Industries
- 5.3. Market Analysis, Insights and Forecast - by Region
- 5.3.1. Asia Pacific
- 5.3.2. North America
- 5.3.3. Europe
- 5.3.4. South America
- 5.3.5. Middle East and Africa
- 5.1. Market Analysis, Insights and Forecast - by Type
- 6. Asia Pacific Light Stabilizers Industry Analysis, Insights and Forecast, 2019-2031
- 6.1. Market Analysis, Insights and Forecast - by Type
- 6.1.1. UV Absorbers
- 6.1.2. Hindered Amine Light Stabilizers (HALS)
- 6.1.3. Quenchers
- 6.1.4. Antioxidants
- 6.2. Market Analysis, Insights and Forecast - by End-User Industry
- 6.2.1. Packaging
- 6.2.2. Automotive
- 6.2.3. Agriculture
- 6.2.4. Building and Construction
- 6.2.5. Adhesives and Sealants
- 6.2.6. Other End-User Industries
- 6.1. Market Analysis, Insights and Forecast - by Type
- 7. North America Light Stabilizers Industry Analysis, Insights and Forecast, 2019-2031
- 7.1. Market Analysis, Insights and Forecast - by Type
- 7.1.1. UV Absorbers
- 7.1.2. Hindered Amine Light Stabilizers (HALS)
- 7.1.3. Quenchers
- 7.1.4. Antioxidants
- 7.2. Market Analysis, Insights and Forecast - by End-User Industry
- 7.2.1. Packaging
- 7.2.2. Automotive
- 7.2.3. Agriculture
- 7.2.4. Building and Construction
- 7.2.5. Adhesives and Sealants
- 7.2.6. Other End-User Industries
- 7.1. Market Analysis, Insights and Forecast - by Type
- 8. Europe Light Stabilizers Industry Analysis, Insights and Forecast, 2019-2031
- 8.1. Market Analysis, Insights and Forecast - by Type
- 8.1.1. UV Absorbers
- 8.1.2. Hindered Amine Light Stabilizers (HALS)
- 8.1.3. Quenchers
- 8.1.4. Antioxidants
- 8.2. Market Analysis, Insights and Forecast - by End-User Industry
- 8.2.1. Packaging
- 8.2.2. Automotive
- 8.2.3. Agriculture
- 8.2.4. Building and Construction
- 8.2.5. Adhesives and Sealants
- 8.2.6. Other End-User Industries
- 8.1. Market Analysis, Insights and Forecast - by Type
- 9. South America Light Stabilizers Industry Analysis, Insights and Forecast, 2019-2031
- 9.1. Market Analysis, Insights and Forecast - by Type
- 9.1.1. UV Absorbers
- 9.1.2. Hindered Amine Light Stabilizers (HALS)
- 9.1.3. Quenchers
- 9.1.4. Antioxidants
- 9.2. Market Analysis, Insights and Forecast - by End-User Industry
- 9.2.1. Packaging
- 9.2.2. Automotive
- 9.2.3. Agriculture
- 9.2.4. Building and Construction
- 9.2.5. Adhesives and Sealants
- 9.2.6. Other End-User Industries
- 9.1. Market Analysis, Insights and Forecast - by Type
- 10. Middle East and Africa Light Stabilizers Industry Analysis, Insights and Forecast, 2019-2031
- 10.1. Market Analysis, Insights and Forecast - by Type
- 10.1.1. UV Absorbers
- 10.1.2. Hindered Amine Light Stabilizers (HALS)
- 10.1.3. Quenchers
- 10.1.4. Antioxidants
- 10.2. Market Analysis, Insights and Forecast - by End-User Industry
- 10.2.1. Packaging
- 10.2.2. Automotive
- 10.2.3. Agriculture
- 10.2.4. Building and Construction
- 10.2.5. Adhesives and Sealants
- 10.2.6. Other End-User Industries
- 10.1. Market Analysis, Insights and Forecast - by Type
- 11. Asia Pacific Light Stabilizers Industry Analysis, Insights and Forecast, 2019-2031
- 11.1. Market Analysis, Insights and Forecast - By Country/Sub-region
- 11.1.1 China
- 11.1.2 India
- 11.1.3 Japan
- 11.1.4 South Korea
- 11.1.5 Rest of Asia Pacific
- 12. North America Light Stabilizers Industry Analysis, Insights and Forecast, 2019-2031
- 12.1. Market Analysis, Insights and Forecast - By Country/Sub-region
- 12.1.1 United States
- 12.1.2 Canada
- 12.1.3 Mexico
- 13. Europe Light Stabilizers Industry Analysis, Insights and Forecast, 2019-2031
- 13.1. Market Analysis, Insights and Forecast - By Country/Sub-region
- 13.1.1 Germany
- 13.1.2 United Kingdom
- 13.1.3 France
- 13.1.4 Italy
- 13.1.5 Rest of Europe
- 14. South America Light Stabilizers Industry Analysis, Insights and Forecast, 2019-2031
- 14.1. Market Analysis, Insights and Forecast - By Country/Sub-region
- 14.1.1 Brazil
- 14.1.2 Argentina
- 14.1.3 Rest of South America
- 15. Middle East and Africa Light Stabilizers Industry Analysis, Insights and Forecast, 2019-2031
- 15.1. Market Analysis, Insights and Forecast - By Country/Sub-region
- 15.1.1 Saudi Arabia
- 15.1.2 South Africa
- 15.1.3 Rest of Middle East and Africa
- 16. Competitive Analysis
- 16.1. Global Market Share Analysis 2024
- 16.2. Company Profiles
- 16.2.1 ALTANA AG
- 16.2.1.1. Overview
- 16.2.1.2. Products
- 16.2.1.3. SWOT Analysis
- 16.2.1.4. Recent Developments
- 16.2.1.5. Financials (Based on Availability)
- 16.2.2 Eastman Chemical Company
- 16.2.2.1. Overview
- 16.2.2.2. Products
- 16.2.2.3. SWOT Analysis
- 16.2.2.4. Recent Developments
- 16.2.2.5. Financials (Based on Availability)
- 16.2.3 Rianlon Corporation
- 16.2.3.1. Overview
- 16.2.3.2. Products
- 16.2.3.3. SWOT Analysis
- 16.2.3.4. Recent Developments
- 16.2.3.5. Financials (Based on Availability)
- 16.2.4 Mayzo Inc
- 16.2.4.1. Overview
- 16.2.4.2. Products
- 16.2.4.3. SWOT Analysis
- 16.2.4.4. Recent Developments
- 16.2.4.5. Financials (Based on Availability)
- 16.2.5 Solvay
- 16.2.5.1. Overview
- 16.2.5.2. Products
- 16.2.5.3. SWOT Analysis
- 16.2.5.4. Recent Developments
- 16.2.5.5. Financials (Based on Availability)
- 16.2.6 SABO S p A
- 16.2.6.1. Overview
- 16.2.6.2. Products
- 16.2.6.3. SWOT Analysis
- 16.2.6.4. Recent Developments
- 16.2.6.5. Financials (Based on Availability)
- 16.2.7 CLARIANT
- 16.2.7.1. Overview
- 16.2.7.2. Products
- 16.2.7.3. SWOT Analysis
- 16.2.7.4. Recent Developments
- 16.2.7.5. Financials (Based on Availability)
- 16.2.8 Everlight Chemical Industrial Co
- 16.2.8.1. Overview
- 16.2.8.2. Products
- 16.2.8.3. SWOT Analysis
- 16.2.8.4. Recent Developments
- 16.2.8.5. Financials (Based on Availability)
- 16.2.9 SI Group Inc (SK Capital Partners)
- 16.2.9.1. Overview
- 16.2.9.2. Products
- 16.2.9.3. SWOT Analysis
- 16.2.9.4. Recent Developments
- 16.2.9.5. Financials (Based on Availability)
- 16.2.10 Chitec Technology Co Ltd
- 16.2.10.1. Overview
- 16.2.10.2. Products
- 16.2.10.3. SWOT Analysis
- 16.2.10.4. Recent Developments
- 16.2.10.5. Financials (Based on Availability)
- 16.2.11 ADEKA CORPORATION
- 16.2.11.1. Overview
- 16.2.11.2. Products
- 16.2.11.3. SWOT Analysis
- 16.2.11.4. Recent Developments
- 16.2.11.5. Financials (Based on Availability)
- 16.2.12 Lycus Ltd LLC
- 16.2.12.1. Overview
- 16.2.12.2. Products
- 16.2.12.3. SWOT Analysis
- 16.2.12.4. Recent Developments
- 16.2.12.5. Financials (Based on Availability)
- 16.2.13 SONGWON
- 16.2.13.1. Overview
- 16.2.13.2. Products
- 16.2.13.3. SWOT Analysis
- 16.2.13.4. Recent Developments
- 16.2.13.5. Financials (Based on Availability)
- 16.2.14 UniteChem Group*List Not Exhaustive
- 16.2.14.1. Overview
- 16.2.14.2. Products
- 16.2.14.3. SWOT Analysis
- 16.2.14.4. Recent Developments
- 16.2.14.5. Financials (Based on Availability)
- 16.2.15 BASF SE
- 16.2.15.1. Overview
- 16.2.15.2. Products
- 16.2.15.3. SWOT Analysis
- 16.2.15.4. Recent Developments
- 16.2.15.5. Financials (Based on Availability)
- 16.2.1 ALTANA AG
List of Figures
- Figure 1: Global Light Stabilizers Industry Revenue Breakdown (Million, %) by Region 2024 & 2032
- Figure 2: Global Light Stabilizers Industry Volume Breakdown (Kiloton, %) by Region 2024 & 2032
- Figure 3: Asia Pacific Light Stabilizers Industry Revenue (Million), by Country 2024 & 2032
- Figure 4: Asia Pacific Light Stabilizers Industry Volume (Kiloton), by Country 2024 & 2032
- Figure 5: Asia Pacific Light Stabilizers Industry Revenue Share (%), by Country 2024 & 2032
- Figure 6: Asia Pacific Light Stabilizers Industry Volume Share (%), by Country 2024 & 2032
- Figure 7: North America Light Stabilizers Industry Revenue (Million), by Country 2024 & 2032
- Figure 8: North America Light Stabilizers Industry Volume (Kiloton), by Country 2024 & 2032
- Figure 9: North America Light Stabilizers Industry Revenue Share (%), by Country 2024 & 2032
- Figure 10: North America Light Stabilizers Industry Volume Share (%), by Country 2024 & 2032
- Figure 11: Europe Light Stabilizers Industry Revenue (Million), by Country 2024 & 2032
- Figure 12: Europe Light Stabilizers Industry Volume (Kiloton), by Country 2024 & 2032
- Figure 13: Europe Light Stabilizers Industry Revenue Share (%), by Country 2024 & 2032
- Figure 14: Europe Light Stabilizers Industry Volume Share (%), by Country 2024 & 2032
- Figure 15: South America Light Stabilizers Industry Revenue (Million), by Country 2024 & 2032
- Figure 16: South America Light Stabilizers Industry Volume (Kiloton), by Country 2024 & 2032
- Figure 17: South America Light Stabilizers Industry Revenue Share (%), by Country 2024 & 2032
- Figure 18: South America Light Stabilizers Industry Volume Share (%), by Country 2024 & 2032
- Figure 19: Middle East and Africa Light Stabilizers Industry Revenue (Million), by Country 2024 & 2032
- Figure 20: Middle East and Africa Light Stabilizers Industry Volume (Kiloton), by Country 2024 & 2032
- Figure 21: Middle East and Africa Light Stabilizers Industry Revenue Share (%), by Country 2024 & 2032
- Figure 22: Middle East and Africa Light Stabilizers Industry Volume Share (%), by Country 2024 & 2032
- Figure 23: Asia Pacific Light Stabilizers Industry Revenue (Million), by Type 2024 & 2032
- Figure 24: Asia Pacific Light Stabilizers Industry Volume (Kiloton), by Type 2024 & 2032
- Figure 25: Asia Pacific Light Stabilizers Industry Revenue Share (%), by Type 2024 & 2032
- Figure 26: Asia Pacific Light Stabilizers Industry Volume Share (%), by Type 2024 & 2032
- Figure 27: Asia Pacific Light Stabilizers Industry Revenue (Million), by End-User Industry 2024 & 2032
- Figure 28: Asia Pacific Light Stabilizers Industry Volume (Kiloton), by End-User Industry 2024 & 2032
- Figure 29: Asia Pacific Light Stabilizers Industry Revenue Share (%), by End-User Industry 2024 & 2032
- Figure 30: Asia Pacific Light Stabilizers Industry Volume Share (%), by End-User Industry 2024 & 2032
- Figure 31: Asia Pacific Light Stabilizers Industry Revenue (Million), by Country 2024 & 2032
- Figure 32: Asia Pacific Light Stabilizers Industry Volume (Kiloton), by Country 2024 & 2032
- Figure 33: Asia Pacific Light Stabilizers Industry Revenue Share (%), by Country 2024 & 2032
- Figure 34: Asia Pacific Light Stabilizers Industry Volume Share (%), by Country 2024 & 2032
- Figure 35: North America Light Stabilizers Industry Revenue (Million), by Type 2024 & 2032
- Figure 36: North America Light Stabilizers Industry Volume (Kiloton), by Type 2024 & 2032
- Figure 37: North America Light Stabilizers Industry Revenue Share (%), by Type 2024 & 2032
- Figure 38: North America Light Stabilizers Industry Volume Share (%), by Type 2024 & 2032
- Figure 39: North America Light Stabilizers Industry Revenue (Million), by End-User Industry 2024 & 2032
- Figure 40: North America Light Stabilizers Industry Volume (Kiloton), by End-User Industry 2024 & 2032
- Figure 41: North America Light Stabilizers Industry Revenue Share (%), by End-User Industry 2024 & 2032
- Figure 42: North America Light Stabilizers Industry Volume Share (%), by End-User Industry 2024 & 2032
- Figure 43: North America Light Stabilizers Industry Revenue (Million), by Country 2024 & 2032
- Figure 44: North America Light Stabilizers Industry Volume (Kiloton), by Country 2024 & 2032
- Figure 45: North America Light Stabilizers Industry Revenue Share (%), by Country 2024 & 2032
- Figure 46: North America Light Stabilizers Industry Volume Share (%), by Country 2024 & 2032
- Figure 47: Europe Light Stabilizers Industry Revenue (Million), by Type 2024 & 2032
- Figure 48: Europe Light Stabilizers Industry Volume (Kiloton), by Type 2024 & 2032
- Figure 49: Europe Light Stabilizers Industry Revenue Share (%), by Type 2024 & 2032
- Figure 50: Europe Light Stabilizers Industry Volume Share (%), by Type 2024 & 2032
- Figure 51: Europe Light Stabilizers Industry Revenue (Million), by End-User Industry 2024 & 2032
- Figure 52: Europe Light Stabilizers Industry Volume (Kiloton), by End-User Industry 2024 & 2032
- Figure 53: Europe Light Stabilizers Industry Revenue Share (%), by End-User Industry 2024 & 2032
- Figure 54: Europe Light Stabilizers Industry Volume Share (%), by End-User Industry 2024 & 2032
- Figure 55: Europe Light Stabilizers Industry Revenue (Million), by Country 2024 & 2032
- Figure 56: Europe Light Stabilizers Industry Volume (Kiloton), by Country 2024 & 2032
- Figure 57: Europe Light Stabilizers Industry Revenue Share (%), by Country 2024 & 2032
- Figure 58: Europe Light Stabilizers Industry Volume Share (%), by Country 2024 & 2032
- Figure 59: South America Light Stabilizers Industry Revenue (Million), by Type 2024 & 2032
- Figure 60: South America Light Stabilizers Industry Volume (Kiloton), by Type 2024 & 2032
- Figure 61: South America Light Stabilizers Industry Revenue Share (%), by Type 2024 & 2032
- Figure 62: South America Light Stabilizers Industry Volume Share (%), by Type 2024 & 2032
- Figure 63: South America Light Stabilizers Industry Revenue (Million), by End-User Industry 2024 & 2032
- Figure 64: South America Light Stabilizers Industry Volume (Kiloton), by End-User Industry 2024 & 2032
- Figure 65: South America Light Stabilizers Industry Revenue Share (%), by End-User Industry 2024 & 2032
- Figure 66: South America Light Stabilizers Industry Volume Share (%), by End-User Industry 2024 & 2032
- Figure 67: South America Light Stabilizers Industry Revenue (Million), by Country 2024 & 2032
- Figure 68: South America Light Stabilizers Industry Volume (Kiloton), by Country 2024 & 2032
- Figure 69: South America Light Stabilizers Industry Revenue Share (%), by Country 2024 & 2032
- Figure 70: South America Light Stabilizers Industry Volume Share (%), by Country 2024 & 2032
- Figure 71: Middle East and Africa Light Stabilizers Industry Revenue (Million), by Type 2024 & 2032
- Figure 72: Middle East and Africa Light Stabilizers Industry Volume (Kiloton), by Type 2024 & 2032
- Figure 73: Middle East and Africa Light Stabilizers Industry Revenue Share (%), by Type 2024 & 2032
- Figure 74: Middle East and Africa Light Stabilizers Industry Volume Share (%), by Type 2024 & 2032
- Figure 75: Middle East and Africa Light Stabilizers Industry Revenue (Million), by End-User Industry 2024 & 2032
- Figure 76: Middle East and Africa Light Stabilizers Industry Volume (Kiloton), by End-User Industry 2024 & 2032
- Figure 77: Middle East and Africa Light Stabilizers Industry Revenue Share (%), by End-User Industry 2024 & 2032
- Figure 78: Middle East and Africa Light Stabilizers Industry Volume Share (%), by End-User Industry 2024 & 2032
- Figure 79: Middle East and Africa Light Stabilizers Industry Revenue (Million), by Country 2024 & 2032
- Figure 80: Middle East and Africa Light Stabilizers Industry Volume (Kiloton), by Country 2024 & 2032
- Figure 81: Middle East and Africa Light Stabilizers Industry Revenue Share (%), by Country 2024 & 2032
- Figure 82: Middle East and Africa Light Stabilizers Industry Volume Share (%), by Country 2024 & 2032
List of Tables
- Table 1: Global Light Stabilizers Industry Revenue Million Forecast, by Region 2019 & 2032
- Table 2: Global Light Stabilizers Industry Volume Kiloton Forecast, by Region 2019 & 2032
- Table 3: Global Light Stabilizers Industry Revenue Million Forecast, by Type 2019 & 2032
- Table 4: Global Light Stabilizers Industry Volume Kiloton Forecast, by Type 2019 & 2032
- Table 5: Global Light Stabilizers Industry Revenue Million Forecast, by End-User Industry 2019 & 2032
- Table 6: Global Light Stabilizers Industry Volume Kiloton Forecast, by End-User Industry 2019 & 2032
- Table 7: Global Light Stabilizers Industry Revenue Million Forecast, by Region 2019 & 2032
- Table 8: Global Light Stabilizers Industry Volume Kiloton Forecast, by Region 2019 & 2032
- Table 9: Global Light Stabilizers Industry Revenue Million Forecast, by Country 2019 & 2032
- Table 10: Global Light Stabilizers Industry Volume Kiloton Forecast, by Country 2019 & 2032
- Table 11: China Light Stabilizers Industry Revenue (Million) Forecast, by Application 2019 & 2032
- Table 12: China Light Stabilizers Industry Volume (Kiloton) Forecast, by Application 2019 & 2032
- Table 13: India Light Stabilizers Industry Revenue (Million) Forecast, by Application 2019 & 2032
- Table 14: India Light Stabilizers Industry Volume (Kiloton) Forecast, by Application 2019 & 2032
- Table 15: Japan Light Stabilizers Industry Revenue (Million) Forecast, by Application 2019 & 2032
- Table 16: Japan Light Stabilizers Industry Volume (Kiloton) Forecast, by Application 2019 & 2032
- Table 17: South Korea Light Stabilizers Industry Revenue (Million) Forecast, by Application 2019 & 2032
- Table 18: South Korea Light Stabilizers Industry Volume (Kiloton) Forecast, by Application 2019 & 2032
- Table 19: Rest of Asia Pacific Light Stabilizers Industry Revenue (Million) Forecast, by Application 2019 & 2032
- Table 20: Rest of Asia Pacific Light Stabilizers Industry Volume (Kiloton) Forecast, by Application 2019 & 2032
- Table 21: Global Light Stabilizers Industry Revenue Million Forecast, by Country 2019 & 2032
- Table 22: Global Light Stabilizers Industry Volume Kiloton Forecast, by Country 2019 & 2032
- Table 23: United States Light Stabilizers Industry Revenue (Million) Forecast, by Application 2019 & 2032
- Table 24: United States Light Stabilizers Industry Volume (Kiloton) Forecast, by Application 2019 & 2032
- Table 25: Canada Light Stabilizers Industry Revenue (Million) Forecast, by Application 2019 & 2032
- Table 26: Canada Light Stabilizers Industry Volume (Kiloton) Forecast, by Application 2019 & 2032
- Table 27: Mexico Light Stabilizers Industry Revenue (Million) Forecast, by Application 2019 & 2032
- Table 28: Mexico Light Stabilizers Industry Volume (Kiloton) Forecast, by Application 2019 & 2032
- Table 29: Global Light Stabilizers Industry Revenue Million Forecast, by Country 2019 & 2032
- Table 30: Global Light Stabilizers Industry Volume Kiloton Forecast, by Country 2019 & 2032
- Table 31: Germany Light Stabilizers Industry Revenue (Million) Forecast, by Application 2019 & 2032
- Table 32: Germany Light Stabilizers Industry Volume (Kiloton) Forecast, by Application 2019 & 2032
- Table 33: United Kingdom Light Stabilizers Industry Revenue (Million) Forecast, by Application 2019 & 2032
- Table 34: United Kingdom Light Stabilizers Industry Volume (Kiloton) Forecast, by Application 2019 & 2032
- Table 35: France Light Stabilizers Industry Revenue (Million) Forecast, by Application 2019 & 2032
- Table 36: France Light Stabilizers Industry Volume (Kiloton) Forecast, by Application 2019 & 2032
- Table 37: Italy Light Stabilizers Industry Revenue (Million) Forecast, by Application 2019 & 2032
- Table 38: Italy Light Stabilizers Industry Volume (Kiloton) Forecast, by Application 2019 & 2032
- Table 39: Rest of Europe Light Stabilizers Industry Revenue (Million) Forecast, by Application 2019 & 2032
- Table 40: Rest of Europe Light Stabilizers Industry Volume (Kiloton) Forecast, by Application 2019 & 2032
- Table 41: Global Light Stabilizers Industry Revenue Million Forecast, by Country 2019 & 2032
- Table 42: Global Light Stabilizers Industry Volume Kiloton Forecast, by Country 2019 & 2032
- Table 43: Brazil Light Stabilizers Industry Revenue (Million) Forecast, by Application 2019 & 2032
- Table 44: Brazil Light Stabilizers Industry Volume (Kiloton) Forecast, by Application 2019 & 2032
- Table 45: Argentina Light Stabilizers Industry Revenue (Million) Forecast, by Application 2019 & 2032
- Table 46: Argentina Light Stabilizers Industry Volume (Kiloton) Forecast, by Application 2019 & 2032
- Table 47: Rest of South America Light Stabilizers Industry Revenue (Million) Forecast, by Application 2019 & 2032
- Table 48: Rest of South America Light Stabilizers Industry Volume (Kiloton) Forecast, by Application 2019 & 2032
- Table 49: Global Light Stabilizers Industry Revenue Million Forecast, by Country 2019 & 2032
- Table 50: Global Light Stabilizers Industry Volume Kiloton Forecast, by Country 2019 & 2032
- Table 51: Saudi Arabia Light Stabilizers Industry Revenue (Million) Forecast, by Application 2019 & 2032
- Table 52: Saudi Arabia Light Stabilizers Industry Volume (Kiloton) Forecast, by Application 2019 & 2032
- Table 53: South Africa Light Stabilizers Industry Revenue (Million) Forecast, by Application 2019 & 2032
- Table 54: South Africa Light Stabilizers Industry Volume (Kiloton) Forecast, by Application 2019 & 2032
- Table 55: Rest of Middle East and Africa Light Stabilizers Industry Revenue (Million) Forecast, by Application 2019 & 2032
- Table 56: Rest of Middle East and Africa Light Stabilizers Industry Volume (Kiloton) Forecast, by Application 2019 & 2032
- Table 57: Global Light Stabilizers Industry Revenue Million Forecast, by Type 2019 & 2032
- Table 58: Global Light Stabilizers Industry Volume Kiloton Forecast, by Type 2019 & 2032
- Table 59: Global Light Stabilizers Industry Revenue Million Forecast, by End-User Industry 2019 & 2032
- Table 60: Global Light Stabilizers Industry Volume Kiloton Forecast, by End-User Industry 2019 & 2032
- Table 61: Global Light Stabilizers Industry Revenue Million Forecast, by Country 2019 & 2032
- Table 62: Global Light Stabilizers Industry Volume Kiloton Forecast, by Country 2019 & 2032
- Table 63: China Light Stabilizers Industry Revenue (Million) Forecast, by Application 2019 & 2032
- Table 64: China Light Stabilizers Industry Volume (Kiloton) Forecast, by Application 2019 & 2032
- Table 65: India Light Stabilizers Industry Revenue (Million) Forecast, by Application 2019 & 2032
- Table 66: India Light Stabilizers Industry Volume (Kiloton) Forecast, by Application 2019 & 2032
- Table 67: Japan Light Stabilizers Industry Revenue (Million) Forecast, by Application 2019 & 2032
- Table 68: Japan Light Stabilizers Industry Volume (Kiloton) Forecast, by Application 2019 & 2032
- Table 69: South Korea Light Stabilizers Industry Revenue (Million) Forecast, by Application 2019 & 2032
- Table 70: South Korea Light Stabilizers Industry Volume (Kiloton) Forecast, by Application 2019 & 2032
- Table 71: Rest of Asia Pacific Light Stabilizers Industry Revenue (Million) Forecast, by Application 2019 & 2032
- Table 72: Rest of Asia Pacific Light Stabilizers Industry Volume (Kiloton) Forecast, by Application 2019 & 2032
- Table 73: Global Light Stabilizers Industry Revenue Million Forecast, by Type 2019 & 2032
- Table 74: Global Light Stabilizers Industry Volume Kiloton Forecast, by Type 2019 & 2032
- Table 75: Global Light Stabilizers Industry Revenue Million Forecast, by End-User Industry 2019 & 2032
- Table 76: Global Light Stabilizers Industry Volume Kiloton Forecast, by End-User Industry 2019 & 2032
- Table 77: Global Light Stabilizers Industry Revenue Million Forecast, by Country 2019 & 2032
- Table 78: Global Light Stabilizers Industry Volume Kiloton Forecast, by Country 2019 & 2032
- Table 79: United States Light Stabilizers Industry Revenue (Million) Forecast, by Application 2019 & 2032
- Table 80: United States Light Stabilizers Industry Volume (Kiloton) Forecast, by Application 2019 & 2032
- Table 81: Canada Light Stabilizers Industry Revenue (Million) Forecast, by Application 2019 & 2032
- Table 82: Canada Light Stabilizers Industry Volume (Kiloton) Forecast, by Application 2019 & 2032
- Table 83: Mexico Light Stabilizers Industry Revenue (Million) Forecast, by Application 2019 & 2032
- Table 84: Mexico Light Stabilizers Industry Volume (Kiloton) Forecast, by Application 2019 & 2032
- Table 85: Global Light Stabilizers Industry Revenue Million Forecast, by Type 2019 & 2032
- Table 86: Global Light Stabilizers Industry Volume Kiloton Forecast, by Type 2019 & 2032
- Table 87: Global Light Stabilizers Industry Revenue Million Forecast, by End-User Industry 2019 & 2032
- Table 88: Global Light Stabilizers Industry Volume Kiloton Forecast, by End-User Industry 2019 & 2032
- Table 89: Global Light Stabilizers Industry Revenue Million Forecast, by Country 2019 & 2032
- Table 90: Global Light Stabilizers Industry Volume Kiloton Forecast, by Country 2019 & 2032
- Table 91: Germany Light Stabilizers Industry Revenue (Million) Forecast, by Application 2019 & 2032
- Table 92: Germany Light Stabilizers Industry Volume (Kiloton) Forecast, by Application 2019 & 2032
- Table 93: United Kingdom Light Stabilizers Industry Revenue (Million) Forecast, by Application 2019 & 2032
- Table 94: United Kingdom Light Stabilizers Industry Volume (Kiloton) Forecast, by Application 2019 & 2032
- Table 95: France Light Stabilizers Industry Revenue (Million) Forecast, by Application 2019 & 2032
- Table 96: France Light Stabilizers Industry Volume (Kiloton) Forecast, by Application 2019 & 2032
- Table 97: Italy Light Stabilizers Industry Revenue (Million) Forecast, by Application 2019 & 2032
- Table 98: Italy Light Stabilizers Industry Volume (Kiloton) Forecast, by Application 2019 & 2032
- Table 99: Rest of Europe Light Stabilizers Industry Revenue (Million) Forecast, by Application 2019 & 2032
- Table 100: Rest of Europe Light Stabilizers Industry Volume (Kiloton) Forecast, by Application 2019 & 2032
- Table 101: Global Light Stabilizers Industry Revenue Million Forecast, by Type 2019 & 2032
- Table 102: Global Light Stabilizers Industry Volume Kiloton Forecast, by Type 2019 & 2032
- Table 103: Global Light Stabilizers Industry Revenue Million Forecast, by End-User Industry 2019 & 2032
- Table 104: Global Light Stabilizers Industry Volume Kiloton Forecast, by End-User Industry 2019 & 2032
- Table 105: Global Light Stabilizers Industry Revenue Million Forecast, by Country 2019 & 2032
- Table 106: Global Light Stabilizers Industry Volume Kiloton Forecast, by Country 2019 & 2032
- Table 107: Brazil Light Stabilizers Industry Revenue (Million) Forecast, by Application 2019 & 2032
- Table 108: Brazil Light Stabilizers Industry Volume (Kiloton) Forecast, by Application 2019 & 2032
- Table 109: Argentina Light Stabilizers Industry Revenue (Million) Forecast, by Application 2019 & 2032
- Table 110: Argentina Light Stabilizers Industry Volume (Kiloton) Forecast, by Application 2019 & 2032
- Table 111: Rest of South America Light Stabilizers Industry Revenue (Million) Forecast, by Application 2019 & 2032
- Table 112: Rest of South America Light Stabilizers Industry Volume (Kiloton) Forecast, by Application 2019 & 2032
- Table 113: Global Light Stabilizers Industry Revenue Million Forecast, by Type 2019 & 2032
- Table 114: Global Light Stabilizers Industry Volume Kiloton Forecast, by Type 2019 & 2032
- Table 115: Global Light Stabilizers Industry Revenue Million Forecast, by End-User Industry 2019 & 2032
- Table 116: Global Light Stabilizers Industry Volume Kiloton Forecast, by End-User Industry 2019 & 2032
- Table 117: Global Light Stabilizers Industry Revenue Million Forecast, by Country 2019 & 2032
- Table 118: Global Light Stabilizers Industry Volume Kiloton Forecast, by Country 2019 & 2032
- Table 119: Saudi Arabia Light Stabilizers Industry Revenue (Million) Forecast, by Application 2019 & 2032
- Table 120: Saudi Arabia Light Stabilizers Industry Volume (Kiloton) Forecast, by Application 2019 & 2032
- Table 121: South Africa Light Stabilizers Industry Revenue (Million) Forecast, by Application 2019 & 2032
- Table 122: South Africa Light Stabilizers Industry Volume (Kiloton) Forecast, by Application 2019 & 2032
- Table 123: Rest of Middle East and Africa Light Stabilizers Industry Revenue (Million) Forecast, by Application 2019 & 2032
- Table 124: Rest of Middle East and Africa Light Stabilizers Industry Volume (Kiloton) Forecast, by Application 2019 & 2032
Frequently Asked Questions
1. What is the projected Compound Annual Growth Rate (CAGR) of the Light Stabilizers Industry?
The projected CAGR is approximately 5.96%.
2. Which companies are prominent players in the Light Stabilizers Industry?
Key companies in the market include ALTANA AG, Eastman Chemical Company, Rianlon Corporation, Mayzo Inc, Solvay, SABO S p A, CLARIANT, Everlight Chemical Industrial Co, SI Group Inc (SK Capital Partners), Chitec Technology Co Ltd, ADEKA CORPORATION, Lycus Ltd LLC, SONGWON, UniteChem Group*List Not Exhaustive, BASF SE.
3. What are the main segments of the Light Stabilizers Industry?
The market segments include Type, End-User Industry.
4. Can you provide details about the market size?
The market size is estimated to be USD 1.36 Million as of 2022.
5. What are some drivers contributing to market growth?
Rising Consumption in Polymer Industry; Increasing Demand for Wood Coatings.
6. What are the notable trends driving market growth?
Automotive Sector to Dominate the Market.
7. Are there any restraints impacting market growth?
Fluctuations in Raw Material Prices.
8. Can you provide examples of recent developments in the market?
July 2022: Solvay announced the creation of an innovative new UV-C stabilizer range. The UV-C spectrum (200-280 nm) was used to treat polyolefin surfaces in these products, intended for use in demanding hygiene applications where COVID and hospital-acquired infections were combated. The development of the new unique stabilizing technique, which was the first to address the dangers of polyolefin deterioration, discoloration, and microcrack formation brought on by frequent exposure to UV-C radiation, marks a significant turning point for the polyolefin industry.
9. What pricing options are available for accessing the report?
Pricing options include single-user, multi-user, and enterprise licenses priced at USD 4750, USD 5250, and USD 8750 respectively.
10. Is the market size provided in terms of value or volume?
The market size is provided in terms of value, measured in Million and volume, measured in Kiloton.
11. Are there any specific market keywords associated with the report?
Yes, the market keyword associated with the report is "Light Stabilizers Industry," which aids in identifying and referencing the specific market segment covered.
12. How do I determine which pricing option suits my needs best?
The pricing options vary based on user requirements and access needs. Individual users may opt for single-user licenses, while businesses requiring broader access may choose multi-user or enterprise licenses for cost-effective access to the report.
13. Are there any additional resources or data provided in the Light Stabilizers Industry report?
While the report offers comprehensive insights, it's advisable to review the specific contents or supplementary materials provided to ascertain if additional resources or data are available.
14. How can I stay updated on further developments or reports in the Light Stabilizers Industry?
To stay informed about further developments, trends, and reports in the Light Stabilizers Industry, consider subscribing to industry newsletters, following relevant companies and organizations, or regularly checking reputable industry news sources and publications.
Methodology
Step 1 - Identification of Relevant Samples Size from Population Database


Step 2 - Approaches for Defining Global Market Size (Value, Volume* & Price*)

Note*: In applicable scenarios
Step 3 - Data Sources
Primary Research
- Web Analytics
- Survey Reports
- Research Institute
- Latest Research Reports
- Opinion Leaders
Secondary Research
- Annual Reports
- White Paper
- Latest Press Release
- Industry Association
- Paid Database
- Investor Presentations

Step 4 - Data Triangulation
Involves using different sources of information in order to increase the validity of a study
These sources are likely to be stakeholders in a program - participants, other researchers, program staff, other community members, and so on.
Then we put all data in single framework & apply various statistical tools to find out the dynamic on the market.
During the analysis stage, feedback from the stakeholder groups would be compared to determine areas of agreement as well as areas of divergence


