
Key Insights
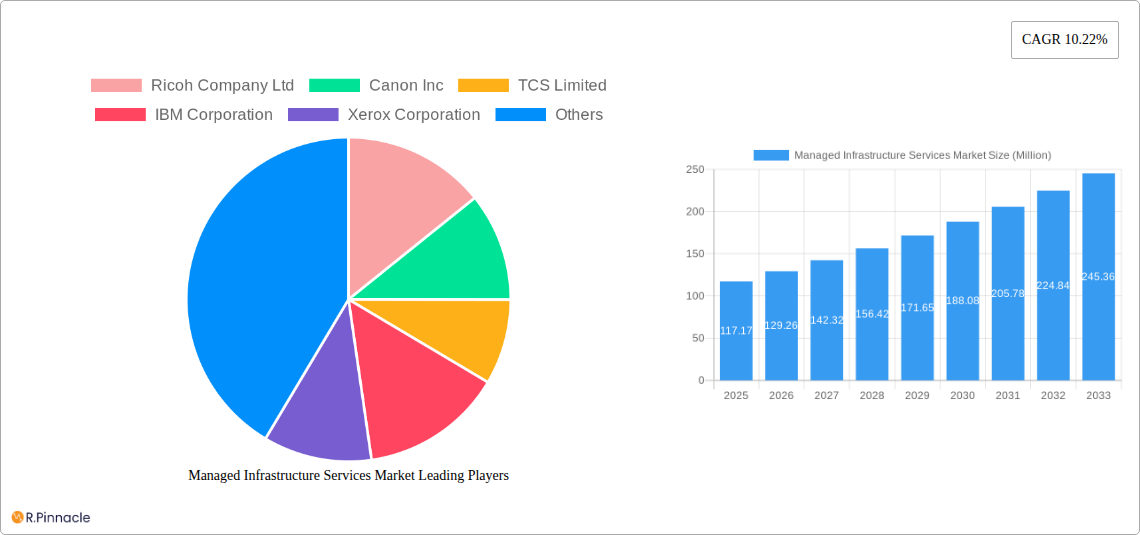
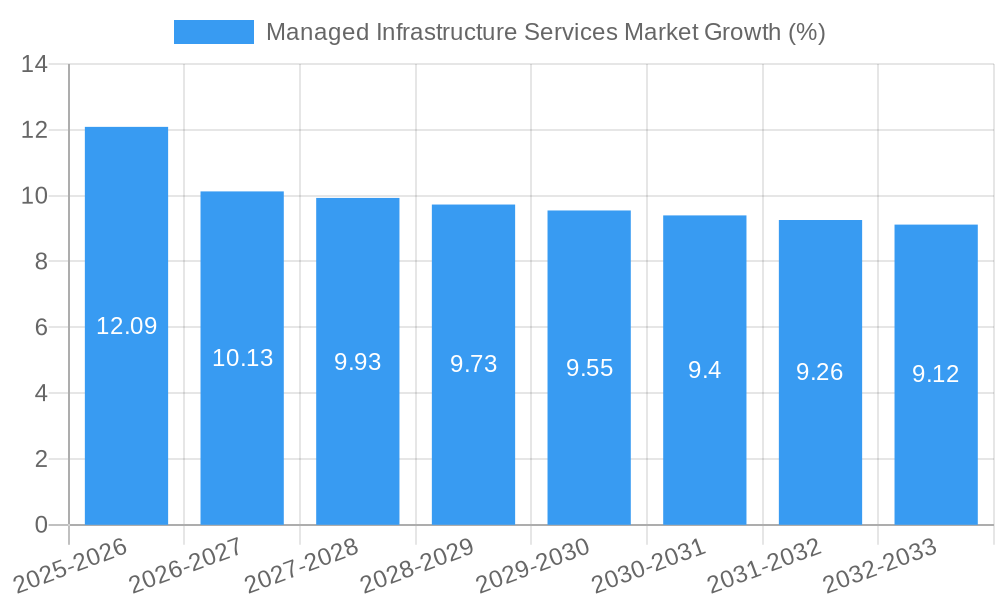
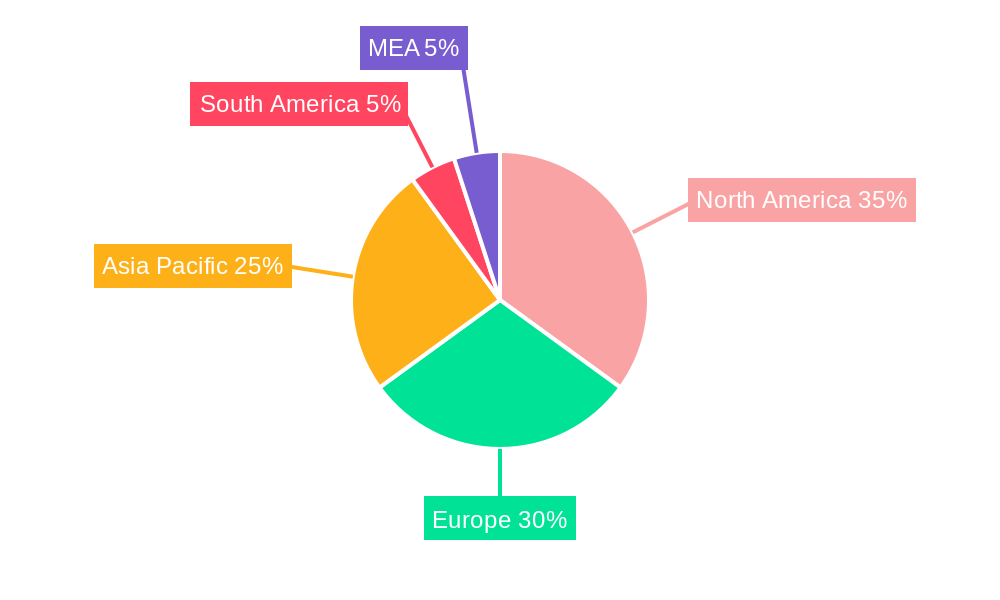
The Managed Infrastructure Services (MIS) market is experiencing robust growth, projected to reach a market size of $117.17 million in 2025, exhibiting a Compound Annual Growth Rate (CAGR) of 10.22%. This expansion is fueled by several key drivers. Increasing reliance on cloud-based solutions and the growing adoption of digital transformation initiatives across various sectors are pushing businesses to outsource their IT infrastructure management. The need for enhanced security, scalability, and cost optimization further propels market growth. Specific trends shaping the market include the rise of hybrid cloud models, increased adoption of automation and artificial intelligence for improved efficiency, and a growing demand for comprehensive service level agreements (SLAs). While certain restraints such as security concerns related to cloud adoption and the complexities of integrating legacy systems with modern infrastructure exist, the overall market outlook remains positive. The segmentation analysis reveals a strong preference for cloud-based deployment, driven by its flexibility and cost-effectiveness. Within services, desktop and print services, and server management constitute significant market segments. The BFSI and IT & Telecom sectors are key end-users, followed by healthcare and manufacturing. Geographically, North America and Europe currently hold substantial market shares, however, the Asia-Pacific region is expected to exhibit high growth rates in the coming years driven by rapid digitalization and economic expansion in key markets like India and China.
The competitive landscape is characterized by a mix of established players like Ricoh, Canon, IBM, and Xerox alongside emerging technology providers. These companies are actively investing in research and development, strategic partnerships, and acquisitions to enhance their service offerings and expand their market presence. The long-term forecast (2025-2033) anticipates sustained growth, driven by the continuing adoption of cloud computing, the expanding Internet of Things (IoT) ecosystem, and the increasing need for robust and resilient IT infrastructures across various industries. This will likely lead to further market consolidation and the emergence of innovative service models. The projected growth will be further influenced by government initiatives promoting digital transformation and technological advancements.
Managed Infrastructure Services Market Report: 2019-2033
This comprehensive report provides an in-depth analysis of the Managed Infrastructure Services market, offering valuable insights for industry professionals, investors, and strategists. The study period spans from 2019 to 2033, with 2025 serving as the base and estimated year. The report leverages robust data analysis to project market trends and opportunities from 2025 to 2033. Key players analyzed include Ricoh Company Ltd, Canon Inc, TCS Limited, IBM Corporation, Xerox Corporation, Toshiba Corporation, Fujitsu Ltd, Alcatel-Lucent SA (Nokia Corporation), Hewlett Packard Enterprise, Lexmark International Inc, Cisco Systems Inc, Verizon Communications Inc, Microsoft Corporation, Deutsche Telekom AG, Dell Technologies Inc, Konica Minolta Inc, and Citrix Systems Inc. The market is segmented by deployment type (on-premise, cloud), service type (desktop and print services, servers, inventory, other types), and end-user (BFSI, IT and telecom, healthcare, manufacturing, retail, other end-users).
Managed Infrastructure Services Market Structure & Innovation Trends
The Managed Infrastructure Services market exhibits a moderately consolidated structure, with several large multinational corporations holding significant market share. While precise market share figures for each company are proprietary data, we estimate that the top five players collectively hold approximately xx% of the market in 2025. The market is characterized by continuous innovation, driven by the need for increased efficiency, scalability, and security in IT infrastructure management. This leads to ongoing mergers and acquisitions (M&A) activity, with deal values reaching xx Million in 2024.
- Innovation Drivers: Advancements in cloud computing, automation, artificial intelligence (AI), and cybersecurity are major catalysts for innovation.
- Regulatory Frameworks: Government regulations regarding data privacy and security significantly impact market dynamics and technology adoption.
- Product Substitutes: Open-source solutions and self-managed infrastructure represent potential substitutes, though managed services generally offer superior expertise and support.
- End-User Demographics: The market is widely diversified across various industry verticals, with BFSI, IT and Telecom, and Healthcare sectors showing strong growth potential.
- M&A Activities: Strategic acquisitions by major players aim to expand service portfolios, enhance technological capabilities, and consolidate market share. Recent significant M&A transactions show deal sizes ranging from xx Million to xx Million.
Managed Infrastructure Services Market Market Dynamics & Trends
The Managed Infrastructure Services market is experiencing robust growth, driven by factors such as the increasing adoption of cloud computing, the growing demand for IT outsourcing, and the rise of digital transformation initiatives across various industries. We project a compound annual growth rate (CAGR) of xx% during the forecast period (2025-2033). Market penetration in key sectors like BFSI and Healthcare is steadily rising, exceeding xx% in 2024 and expected to reach xx% by 2033. Technological disruptions, including the emergence of edge computing and serverless architectures, are reshaping the market landscape, driving demand for new services and solutions. Intense competition among established players and emerging providers fuels innovation and price optimization.
Dominant Regions & Segments in Managed Infrastructure Services Market
Leading Region: North America currently holds the largest market share, driven by high technology adoption rates and a robust IT infrastructure. Europe follows closely, with significant growth projected in Asia-Pacific.
Dominant Segments:
- By Deployment Type: Cloud-based managed infrastructure services are experiencing rapid growth, surpassing on-premise solutions due to enhanced scalability, cost-effectiveness, and accessibility.
- By Services Type: Server management and cloud infrastructure services command the largest market share, reflecting the core functions of IT infrastructure. The demand for desktop and print services remains significant, particularly among small and medium-sized enterprises (SMEs).
- By End-User: The BFSI sector is a leading adopter of managed infrastructure services, driven by the need to ensure high levels of data security and system availability. The IT and Telecom sector also demonstrates strong growth, as companies seek efficient management of their extensive IT infrastructure.
Key drivers for regional dominance include robust economic growth, supportive government policies, and well-developed IT infrastructure. The competitive landscape varies across regions, with different players holding dominant positions.
Managed Infrastructure Services Market Product Innovations
Recent product innovations focus on enhancing automation, integrating AI-powered analytics for predictive maintenance, and strengthening cybersecurity measures. The market is witnessing a shift towards integrated platforms providing holistic management of various infrastructure components, reducing complexity and streamlining operations. These innovations cater to the growing need for efficient, secure, and scalable IT infrastructure management in an increasingly complex digital environment.
Report Scope & Segmentation Analysis
This report comprehensively analyzes the Managed Infrastructure Services market, segmented by deployment type (on-premise and cloud), service type (desktop and print services, servers, inventory, and other types), and end-user (BFSI, IT and telecom, healthcare, manufacturing, retail, and other end-users). Each segment's growth projection, market size, and competitive dynamics are thoroughly examined. The cloud deployment segment is expected to exhibit the highest CAGR, driven by the increasing adoption of cloud-based solutions for improved scalability and cost efficiency. Similarly, server management within the service type segment is projected to grow at a significant rate, reflecting the core functionality of modern IT infrastructure. The BFSI sector within the end-user segment is expected to continue as a dominant consumer of managed infrastructure services.
Key Drivers of Managed Infrastructure Services Market Growth
Several key factors fuel the Managed Infrastructure Services market's growth. Firstly, the rising adoption of cloud computing and digital transformation initiatives drives the demand for sophisticated management solutions. Secondly, the increasing need for enhanced IT security and compliance necessitates specialized managed services. Finally, the cost optimization and efficiency benefits of outsourcing IT infrastructure management attract organizations of all sizes.
Challenges in the Managed Infrastructure Services Market Sector
The market faces challenges, including intense competition, the complexities of integrating legacy systems with modern cloud-based infrastructure, and the risk of security breaches. Furthermore, fluctuations in global economic conditions can affect customer spending and overall market growth. The evolving regulatory landscape, particularly concerning data privacy, adds another layer of complexity to market operations. These challenges necessitate continuous innovation and strategic adaptation by market participants.
Emerging Opportunities in Managed Infrastructure Services Market
Emerging opportunities include the expanding adoption of edge computing, the growth of AI-powered automation for IT infrastructure management, and the increased demand for cybersecurity services. Moreover, the growing adoption of hybrid cloud environments creates opportunities for integrated managed services. Expansion into new geographical markets, particularly in developing economies, also presents significant potential for growth.
Leading Players in the Managed Infrastructure Services Market Market
- Ricoh Company Ltd
- Canon Inc
- TCS Limited
- IBM Corporation
- Xerox Corporation
- Toshiba Corporation
- Fujitsu Ltd
- Alcatel-Lucent SA (Nokia Corporation)
- Hewlett Packard Enterprise
- Lexmark International Inc
- Cisco Systems Inc
- Verizon Communications Inc
- Microsoft Corporation
- Deutsche Telekom AG
- Dell Technologies Inc
- Konica Minolta Inc
- Citrix Systems Inc
Key Developments in Managed Infrastructure Services Market Industry
- September 2023: Cloud4C achieves Google Cloud Specialization for Infrastructure Services in APAC, enhancing its capabilities in managed infrastructure modernization and digital transformation solutions.
- May 2023: Kyndryl and Cloudflare partner to offer managed WAN-as-a-Service and Cloudflare Zero Trust, enabling efficient cloud connectivity and enhanced network security.
- October 2022: Gulf Bridge International (GBI) and Alliance International Management (AIM) partner to deliver digital infrastructure services in the Middle East, leveraging GBI's Smart Network.
- June 2022: Cisco Systems and Kyndryl form a technology partnership to integrate Cisco's technologies into Kyndryl's enterprise-focused solutions, developing new cloud, network, and edge computing offerings.
Future Outlook for Managed Infrastructure Services Market Market
The Managed Infrastructure Services market is poised for continued growth, driven by sustained digital transformation across industries, increasing cloud adoption, and the rising demand for sophisticated IT management solutions. Strategic partnerships, technological advancements, and expansion into emerging markets will shape future market dynamics. The market's future potential is significant, offering attractive opportunities for both established players and new entrants.
Managed Infrastructure Services Market Segmentation
-
1. Deployment Type
- 1.1. On-premise
- 1.2. Cloud
-
2. Services Type
- 2.1. Desktop and Print Services
- 2.2. Servers
- 2.3. Inventory
- 2.4. Other Types
-
3. End User
- 3.1. BFSI
- 3.2. IT and Telecom
- 3.3. Healthcare
- 3.4. Manufacturing
- 3.5. Retail
- 3.6. Other End Users
Managed Infrastructure Services Market Segmentation By Geography
-
1. North America
- 1.1. United States
- 1.2. Canada
-
2. Europe
- 2.1. Germany
- 2.2. UK
- 2.3. France
- 2.4. Spain
- 2.5. Rest of Europe
-
3. Asia Pacific
- 3.1. China
- 3.2. Japan
- 3.3. India
- 3.4. Australia
- 3.5. Rest of Asia Pacific
-
4. Latin America
- 4.1. Brazil
- 4.2. Mexico
- 4.3. Argentina
- 4.4. Rest of Latin America
-
5. Middle East and Africa
- 5.1. UAE
- 5.2. Saudi Arabia
- 5.3. South Africa
- 5.4. Rest of Middle East and Africa
Managed Infrastructure Services Market REPORT HIGHLIGHTS
| Aspects | Details |
|---|---|
| Study Period | 2019-2033 |
| Base Year | 2024 |
| Estimated Year | 2025 |
| Forecast Period | 2025-2033 |
| Historical Period | 2019-2024 |
| Growth Rate | CAGR of 10.22% from 2019-2033 |
| Segmentation |
|
Table of Contents
- 1. Introduction
- 1.1. Research Scope
- 1.2. Market Segmentation
- 1.3. Research Methodology
- 1.4. Definitions and Assumptions
- 2. Executive Summary
- 2.1. Introduction
- 3. Market Dynamics
- 3.1. Introduction
- 3.2. Market Drivers
- 3.2.1. Increasing use of Cloud Managed Infrastructure Services; Technological Proliferation and Advancement of Cloud Based Technology Boosting the Demand; Improved cost and Operational Efficiency and Update of Outdated Hardware
- 3.3. Market Restrains
- 3.3.1. Declining Profit Margins and Integration and Reliability Concerns
- 3.4. Market Trends
- 3.4.1. The Cloud Segment is Expected to Exhibit the Highest Growth
- 4. Market Factor Analysis
- 4.1. Porters Five Forces
- 4.2. Supply/Value Chain
- 4.3. PESTEL analysis
- 4.4. Market Entropy
- 4.5. Patent/Trademark Analysis
- 5. Global Managed Infrastructure Services Market Analysis, Insights and Forecast, 2019-2031
- 5.1. Market Analysis, Insights and Forecast - by Deployment Type
- 5.1.1. On-premise
- 5.1.2. Cloud
- 5.2. Market Analysis, Insights and Forecast - by Services Type
- 5.2.1. Desktop and Print Services
- 5.2.2. Servers
- 5.2.3. Inventory
- 5.2.4. Other Types
- 5.3. Market Analysis, Insights and Forecast - by End User
- 5.3.1. BFSI
- 5.3.2. IT and Telecom
- 5.3.3. Healthcare
- 5.3.4. Manufacturing
- 5.3.5. Retail
- 5.3.6. Other End Users
- 5.4. Market Analysis, Insights and Forecast - by Region
- 5.4.1. North America
- 5.4.2. Europe
- 5.4.3. Asia Pacific
- 5.4.4. Latin America
- 5.4.5. Middle East and Africa
- 5.1. Market Analysis, Insights and Forecast - by Deployment Type
- 6. North America Managed Infrastructure Services Market Analysis, Insights and Forecast, 2019-2031
- 6.1. Market Analysis, Insights and Forecast - by Deployment Type
- 6.1.1. On-premise
- 6.1.2. Cloud
- 6.2. Market Analysis, Insights and Forecast - by Services Type
- 6.2.1. Desktop and Print Services
- 6.2.2. Servers
- 6.2.3. Inventory
- 6.2.4. Other Types
- 6.3. Market Analysis, Insights and Forecast - by End User
- 6.3.1. BFSI
- 6.3.2. IT and Telecom
- 6.3.3. Healthcare
- 6.3.4. Manufacturing
- 6.3.5. Retail
- 6.3.6. Other End Users
- 6.1. Market Analysis, Insights and Forecast - by Deployment Type
- 7. Europe Managed Infrastructure Services Market Analysis, Insights and Forecast, 2019-2031
- 7.1. Market Analysis, Insights and Forecast - by Deployment Type
- 7.1.1. On-premise
- 7.1.2. Cloud
- 7.2. Market Analysis, Insights and Forecast - by Services Type
- 7.2.1. Desktop and Print Services
- 7.2.2. Servers
- 7.2.3. Inventory
- 7.2.4. Other Types
- 7.3. Market Analysis, Insights and Forecast - by End User
- 7.3.1. BFSI
- 7.3.2. IT and Telecom
- 7.3.3. Healthcare
- 7.3.4. Manufacturing
- 7.3.5. Retail
- 7.3.6. Other End Users
- 7.1. Market Analysis, Insights and Forecast - by Deployment Type
- 8. Asia Pacific Managed Infrastructure Services Market Analysis, Insights and Forecast, 2019-2031
- 8.1. Market Analysis, Insights and Forecast - by Deployment Type
- 8.1.1. On-premise
- 8.1.2. Cloud
- 8.2. Market Analysis, Insights and Forecast - by Services Type
- 8.2.1. Desktop and Print Services
- 8.2.2. Servers
- 8.2.3. Inventory
- 8.2.4. Other Types
- 8.3. Market Analysis, Insights and Forecast - by End User
- 8.3.1. BFSI
- 8.3.2. IT and Telecom
- 8.3.3. Healthcare
- 8.3.4. Manufacturing
- 8.3.5. Retail
- 8.3.6. Other End Users
- 8.1. Market Analysis, Insights and Forecast - by Deployment Type
- 9. Latin America Managed Infrastructure Services Market Analysis, Insights and Forecast, 2019-2031
- 9.1. Market Analysis, Insights and Forecast - by Deployment Type
- 9.1.1. On-premise
- 9.1.2. Cloud
- 9.2. Market Analysis, Insights and Forecast - by Services Type
- 9.2.1. Desktop and Print Services
- 9.2.2. Servers
- 9.2.3. Inventory
- 9.2.4. Other Types
- 9.3. Market Analysis, Insights and Forecast - by End User
- 9.3.1. BFSI
- 9.3.2. IT and Telecom
- 9.3.3. Healthcare
- 9.3.4. Manufacturing
- 9.3.5. Retail
- 9.3.6. Other End Users
- 9.1. Market Analysis, Insights and Forecast - by Deployment Type
- 10. Middle East and Africa Managed Infrastructure Services Market Analysis, Insights and Forecast, 2019-2031
- 10.1. Market Analysis, Insights and Forecast - by Deployment Type
- 10.1.1. On-premise
- 10.1.2. Cloud
- 10.2. Market Analysis, Insights and Forecast - by Services Type
- 10.2.1. Desktop and Print Services
- 10.2.2. Servers
- 10.2.3. Inventory
- 10.2.4. Other Types
- 10.3. Market Analysis, Insights and Forecast - by End User
- 10.3.1. BFSI
- 10.3.2. IT and Telecom
- 10.3.3. Healthcare
- 10.3.4. Manufacturing
- 10.3.5. Retail
- 10.3.6. Other End Users
- 10.1. Market Analysis, Insights and Forecast - by Deployment Type
- 11. North America Managed Infrastructure Services Market Analysis, Insights and Forecast, 2019-2031
- 11.1. Market Analysis, Insights and Forecast - By Country/Sub-region
- 11.1.1 United States
- 11.1.2 Canada
- 11.1.3 Mexico
- 12. Europe Managed Infrastructure Services Market Analysis, Insights and Forecast, 2019-2031
- 12.1. Market Analysis, Insights and Forecast - By Country/Sub-region
- 12.1.1 Germany
- 12.1.2 United Kingdom
- 12.1.3 France
- 12.1.4 Spain
- 12.1.5 Italy
- 12.1.6 Spain
- 12.1.7 Belgium
- 12.1.8 Netherland
- 12.1.9 Nordics
- 12.1.10 Rest of Europe
- 13. Asia Pacific Managed Infrastructure Services Market Analysis, Insights and Forecast, 2019-2031
- 13.1. Market Analysis, Insights and Forecast - By Country/Sub-region
- 13.1.1 China
- 13.1.2 Japan
- 13.1.3 India
- 13.1.4 South Korea
- 13.1.5 Southeast Asia
- 13.1.6 Australia
- 13.1.7 Indonesia
- 13.1.8 Phillipes
- 13.1.9 Singapore
- 13.1.10 Thailandc
- 13.1.11 Rest of Asia Pacific
- 14. South America Managed Infrastructure Services Market Analysis, Insights and Forecast, 2019-2031
- 14.1. Market Analysis, Insights and Forecast - By Country/Sub-region
- 14.1.1 Brazil
- 14.1.2 Argentina
- 14.1.3 Peru
- 14.1.4 Chile
- 14.1.5 Colombia
- 14.1.6 Ecuador
- 14.1.7 Venezuela
- 14.1.8 Rest of South America
- 15. North America Managed Infrastructure Services Market Analysis, Insights and Forecast, 2019-2031
- 15.1. Market Analysis, Insights and Forecast - By Country/Sub-region
- 15.1.1 United States
- 15.1.2 Canada
- 15.1.3 Mexico
- 16. MEA Managed Infrastructure Services Market Analysis, Insights and Forecast, 2019-2031
- 16.1. Market Analysis, Insights and Forecast - By Country/Sub-region
- 16.1.1 United Arab Emirates
- 16.1.2 Saudi Arabia
- 16.1.3 South Africa
- 16.1.4 Rest of Middle East and Africa
- 17. Competitive Analysis
- 17.1. Global Market Share Analysis 2024
- 17.2. Company Profiles
- 17.2.1 Ricoh Company Ltd
- 17.2.1.1. Overview
- 17.2.1.2. Products
- 17.2.1.3. SWOT Analysis
- 17.2.1.4. Recent Developments
- 17.2.1.5. Financials (Based on Availability)
- 17.2.2 Canon Inc
- 17.2.2.1. Overview
- 17.2.2.2. Products
- 17.2.2.3. SWOT Analysis
- 17.2.2.4. Recent Developments
- 17.2.2.5. Financials (Based on Availability)
- 17.2.3 TCS Limited
- 17.2.3.1. Overview
- 17.2.3.2. Products
- 17.2.3.3. SWOT Analysis
- 17.2.3.4. Recent Developments
- 17.2.3.5. Financials (Based on Availability)
- 17.2.4 IBM Corporation
- 17.2.4.1. Overview
- 17.2.4.2. Products
- 17.2.4.3. SWOT Analysis
- 17.2.4.4. Recent Developments
- 17.2.4.5. Financials (Based on Availability)
- 17.2.5 Xerox Corporation
- 17.2.5.1. Overview
- 17.2.5.2. Products
- 17.2.5.3. SWOT Analysis
- 17.2.5.4. Recent Developments
- 17.2.5.5. Financials (Based on Availability)
- 17.2.6 Toshiba Corporation
- 17.2.6.1. Overview
- 17.2.6.2. Products
- 17.2.6.3. SWOT Analysis
- 17.2.6.4. Recent Developments
- 17.2.6.5. Financials (Based on Availability)
- 17.2.7 Fujitsu Ltd
- 17.2.7.1. Overview
- 17.2.7.2. Products
- 17.2.7.3. SWOT Analysis
- 17.2.7.4. Recent Developments
- 17.2.7.5. Financials (Based on Availability)
- 17.2.8 Alcatel-Lucent SA (Nokia Corporation)
- 17.2.8.1. Overview
- 17.2.8.2. Products
- 17.2.8.3. SWOT Analysis
- 17.2.8.4. Recent Developments
- 17.2.8.5. Financials (Based on Availability)
- 17.2.9 Hewlett Packard Enterprise
- 17.2.9.1. Overview
- 17.2.9.2. Products
- 17.2.9.3. SWOT Analysis
- 17.2.9.4. Recent Developments
- 17.2.9.5. Financials (Based on Availability)
- 17.2.10 Lexmark International Inc
- 17.2.10.1. Overview
- 17.2.10.2. Products
- 17.2.10.3. SWOT Analysis
- 17.2.10.4. Recent Developments
- 17.2.10.5. Financials (Based on Availability)
- 17.2.11 Cisco Systems Inc
- 17.2.11.1. Overview
- 17.2.11.2. Products
- 17.2.11.3. SWOT Analysis
- 17.2.11.4. Recent Developments
- 17.2.11.5. Financials (Based on Availability)
- 17.2.12 Verizon Communications Inc
- 17.2.12.1. Overview
- 17.2.12.2. Products
- 17.2.12.3. SWOT Analysis
- 17.2.12.4. Recent Developments
- 17.2.12.5. Financials (Based on Availability)
- 17.2.13 Microsoft Corporation
- 17.2.13.1. Overview
- 17.2.13.2. Products
- 17.2.13.3. SWOT Analysis
- 17.2.13.4. Recent Developments
- 17.2.13.5. Financials (Based on Availability)
- 17.2.14 Deutsche Telekom AG
- 17.2.14.1. Overview
- 17.2.14.2. Products
- 17.2.14.3. SWOT Analysis
- 17.2.14.4. Recent Developments
- 17.2.14.5. Financials (Based on Availability)
- 17.2.15 Dell Technologies Inc
- 17.2.15.1. Overview
- 17.2.15.2. Products
- 17.2.15.3. SWOT Analysis
- 17.2.15.4. Recent Developments
- 17.2.15.5. Financials (Based on Availability)
- 17.2.16 Konica Minolta Inc
- 17.2.16.1. Overview
- 17.2.16.2. Products
- 17.2.16.3. SWOT Analysis
- 17.2.16.4. Recent Developments
- 17.2.16.5. Financials (Based on Availability)
- 17.2.17 Citrix Systems Inc
- 17.2.17.1. Overview
- 17.2.17.2. Products
- 17.2.17.3. SWOT Analysis
- 17.2.17.4. Recent Developments
- 17.2.17.5. Financials (Based on Availability)
- 17.2.1 Ricoh Company Ltd
List of Figures
- Figure 1: Global Managed Infrastructure Services Market Revenue Breakdown (Million, %) by Region 2024 & 2032
- Figure 2: North America Managed Infrastructure Services Market Revenue (Million), by Country 2024 & 2032
- Figure 3: North America Managed Infrastructure Services Market Revenue Share (%), by Country 2024 & 2032
- Figure 4: Europe Managed Infrastructure Services Market Revenue (Million), by Country 2024 & 2032
- Figure 5: Europe Managed Infrastructure Services Market Revenue Share (%), by Country 2024 & 2032
- Figure 6: Asia Pacific Managed Infrastructure Services Market Revenue (Million), by Country 2024 & 2032
- Figure 7: Asia Pacific Managed Infrastructure Services Market Revenue Share (%), by Country 2024 & 2032
- Figure 8: South America Managed Infrastructure Services Market Revenue (Million), by Country 2024 & 2032
- Figure 9: South America Managed Infrastructure Services Market Revenue Share (%), by Country 2024 & 2032
- Figure 10: North America Managed Infrastructure Services Market Revenue (Million), by Country 2024 & 2032
- Figure 11: North America Managed Infrastructure Services Market Revenue Share (%), by Country 2024 & 2032
- Figure 12: MEA Managed Infrastructure Services Market Revenue (Million), by Country 2024 & 2032
- Figure 13: MEA Managed Infrastructure Services Market Revenue Share (%), by Country 2024 & 2032
- Figure 14: North America Managed Infrastructure Services Market Revenue (Million), by Deployment Type 2024 & 2032
- Figure 15: North America Managed Infrastructure Services Market Revenue Share (%), by Deployment Type 2024 & 2032
- Figure 16: North America Managed Infrastructure Services Market Revenue (Million), by Services Type 2024 & 2032
- Figure 17: North America Managed Infrastructure Services Market Revenue Share (%), by Services Type 2024 & 2032
- Figure 18: North America Managed Infrastructure Services Market Revenue (Million), by End User 2024 & 2032
- Figure 19: North America Managed Infrastructure Services Market Revenue Share (%), by End User 2024 & 2032
- Figure 20: North America Managed Infrastructure Services Market Revenue (Million), by Country 2024 & 2032
- Figure 21: North America Managed Infrastructure Services Market Revenue Share (%), by Country 2024 & 2032
- Figure 22: Europe Managed Infrastructure Services Market Revenue (Million), by Deployment Type 2024 & 2032
- Figure 23: Europe Managed Infrastructure Services Market Revenue Share (%), by Deployment Type 2024 & 2032
- Figure 24: Europe Managed Infrastructure Services Market Revenue (Million), by Services Type 2024 & 2032
- Figure 25: Europe Managed Infrastructure Services Market Revenue Share (%), by Services Type 2024 & 2032
- Figure 26: Europe Managed Infrastructure Services Market Revenue (Million), by End User 2024 & 2032
- Figure 27: Europe Managed Infrastructure Services Market Revenue Share (%), by End User 2024 & 2032
- Figure 28: Europe Managed Infrastructure Services Market Revenue (Million), by Country 2024 & 2032
- Figure 29: Europe Managed Infrastructure Services Market Revenue Share (%), by Country 2024 & 2032
- Figure 30: Asia Pacific Managed Infrastructure Services Market Revenue (Million), by Deployment Type 2024 & 2032
- Figure 31: Asia Pacific Managed Infrastructure Services Market Revenue Share (%), by Deployment Type 2024 & 2032
- Figure 32: Asia Pacific Managed Infrastructure Services Market Revenue (Million), by Services Type 2024 & 2032
- Figure 33: Asia Pacific Managed Infrastructure Services Market Revenue Share (%), by Services Type 2024 & 2032
- Figure 34: Asia Pacific Managed Infrastructure Services Market Revenue (Million), by End User 2024 & 2032
- Figure 35: Asia Pacific Managed Infrastructure Services Market Revenue Share (%), by End User 2024 & 2032
- Figure 36: Asia Pacific Managed Infrastructure Services Market Revenue (Million), by Country 2024 & 2032
- Figure 37: Asia Pacific Managed Infrastructure Services Market Revenue Share (%), by Country 2024 & 2032
- Figure 38: Latin America Managed Infrastructure Services Market Revenue (Million), by Deployment Type 2024 & 2032
- Figure 39: Latin America Managed Infrastructure Services Market Revenue Share (%), by Deployment Type 2024 & 2032
- Figure 40: Latin America Managed Infrastructure Services Market Revenue (Million), by Services Type 2024 & 2032
- Figure 41: Latin America Managed Infrastructure Services Market Revenue Share (%), by Services Type 2024 & 2032
- Figure 42: Latin America Managed Infrastructure Services Market Revenue (Million), by End User 2024 & 2032
- Figure 43: Latin America Managed Infrastructure Services Market Revenue Share (%), by End User 2024 & 2032
- Figure 44: Latin America Managed Infrastructure Services Market Revenue (Million), by Country 2024 & 2032
- Figure 45: Latin America Managed Infrastructure Services Market Revenue Share (%), by Country 2024 & 2032
- Figure 46: Middle East and Africa Managed Infrastructure Services Market Revenue (Million), by Deployment Type 2024 & 2032
- Figure 47: Middle East and Africa Managed Infrastructure Services Market Revenue Share (%), by Deployment Type 2024 & 2032
- Figure 48: Middle East and Africa Managed Infrastructure Services Market Revenue (Million), by Services Type 2024 & 2032
- Figure 49: Middle East and Africa Managed Infrastructure Services Market Revenue Share (%), by Services Type 2024 & 2032
- Figure 50: Middle East and Africa Managed Infrastructure Services Market Revenue (Million), by End User 2024 & 2032
- Figure 51: Middle East and Africa Managed Infrastructure Services Market Revenue Share (%), by End User 2024 & 2032
- Figure 52: Middle East and Africa Managed Infrastructure Services Market Revenue (Million), by Country 2024 & 2032
- Figure 53: Middle East and Africa Managed Infrastructure Services Market Revenue Share (%), by Country 2024 & 2032
List of Tables
- Table 1: Global Managed Infrastructure Services Market Revenue Million Forecast, by Region 2019 & 2032
- Table 2: Global Managed Infrastructure Services Market Revenue Million Forecast, by Deployment Type 2019 & 2032
- Table 3: Global Managed Infrastructure Services Market Revenue Million Forecast, by Services Type 2019 & 2032
- Table 4: Global Managed Infrastructure Services Market Revenue Million Forecast, by End User 2019 & 2032
- Table 5: Global Managed Infrastructure Services Market Revenue Million Forecast, by Region 2019 & 2032
- Table 6: Global Managed Infrastructure Services Market Revenue Million Forecast, by Country 2019 & 2032
- Table 7: United States Managed Infrastructure Services Market Revenue (Million) Forecast, by Application 2019 & 2032
- Table 8: Canada Managed Infrastructure Services Market Revenue (Million) Forecast, by Application 2019 & 2032
- Table 9: Mexico Managed Infrastructure Services Market Revenue (Million) Forecast, by Application 2019 & 2032
- Table 10: Global Managed Infrastructure Services Market Revenue Million Forecast, by Country 2019 & 2032
- Table 11: Germany Managed Infrastructure Services Market Revenue (Million) Forecast, by Application 2019 & 2032
- Table 12: United Kingdom Managed Infrastructure Services Market Revenue (Million) Forecast, by Application 2019 & 2032
- Table 13: France Managed Infrastructure Services Market Revenue (Million) Forecast, by Application 2019 & 2032
- Table 14: Spain Managed Infrastructure Services Market Revenue (Million) Forecast, by Application 2019 & 2032
- Table 15: Italy Managed Infrastructure Services Market Revenue (Million) Forecast, by Application 2019 & 2032
- Table 16: Spain Managed Infrastructure Services Market Revenue (Million) Forecast, by Application 2019 & 2032
- Table 17: Belgium Managed Infrastructure Services Market Revenue (Million) Forecast, by Application 2019 & 2032
- Table 18: Netherland Managed Infrastructure Services Market Revenue (Million) Forecast, by Application 2019 & 2032
- Table 19: Nordics Managed Infrastructure Services Market Revenue (Million) Forecast, by Application 2019 & 2032
- Table 20: Rest of Europe Managed Infrastructure Services Market Revenue (Million) Forecast, by Application 2019 & 2032
- Table 21: Global Managed Infrastructure Services Market Revenue Million Forecast, by Country 2019 & 2032
- Table 22: China Managed Infrastructure Services Market Revenue (Million) Forecast, by Application 2019 & 2032
- Table 23: Japan Managed Infrastructure Services Market Revenue (Million) Forecast, by Application 2019 & 2032
- Table 24: India Managed Infrastructure Services Market Revenue (Million) Forecast, by Application 2019 & 2032
- Table 25: South Korea Managed Infrastructure Services Market Revenue (Million) Forecast, by Application 2019 & 2032
- Table 26: Southeast Asia Managed Infrastructure Services Market Revenue (Million) Forecast, by Application 2019 & 2032
- Table 27: Australia Managed Infrastructure Services Market Revenue (Million) Forecast, by Application 2019 & 2032
- Table 28: Indonesia Managed Infrastructure Services Market Revenue (Million) Forecast, by Application 2019 & 2032
- Table 29: Phillipes Managed Infrastructure Services Market Revenue (Million) Forecast, by Application 2019 & 2032
- Table 30: Singapore Managed Infrastructure Services Market Revenue (Million) Forecast, by Application 2019 & 2032
- Table 31: Thailandc Managed Infrastructure Services Market Revenue (Million) Forecast, by Application 2019 & 2032
- Table 32: Rest of Asia Pacific Managed Infrastructure Services Market Revenue (Million) Forecast, by Application 2019 & 2032
- Table 33: Global Managed Infrastructure Services Market Revenue Million Forecast, by Country 2019 & 2032
- Table 34: Brazil Managed Infrastructure Services Market Revenue (Million) Forecast, by Application 2019 & 2032
- Table 35: Argentina Managed Infrastructure Services Market Revenue (Million) Forecast, by Application 2019 & 2032
- Table 36: Peru Managed Infrastructure Services Market Revenue (Million) Forecast, by Application 2019 & 2032
- Table 37: Chile Managed Infrastructure Services Market Revenue (Million) Forecast, by Application 2019 & 2032
- Table 38: Colombia Managed Infrastructure Services Market Revenue (Million) Forecast, by Application 2019 & 2032
- Table 39: Ecuador Managed Infrastructure Services Market Revenue (Million) Forecast, by Application 2019 & 2032
- Table 40: Venezuela Managed Infrastructure Services Market Revenue (Million) Forecast, by Application 2019 & 2032
- Table 41: Rest of South America Managed Infrastructure Services Market Revenue (Million) Forecast, by Application 2019 & 2032
- Table 42: Global Managed Infrastructure Services Market Revenue Million Forecast, by Country 2019 & 2032
- Table 43: United States Managed Infrastructure Services Market Revenue (Million) Forecast, by Application 2019 & 2032
- Table 44: Canada Managed Infrastructure Services Market Revenue (Million) Forecast, by Application 2019 & 2032
- Table 45: Mexico Managed Infrastructure Services Market Revenue (Million) Forecast, by Application 2019 & 2032
- Table 46: Global Managed Infrastructure Services Market Revenue Million Forecast, by Country 2019 & 2032
- Table 47: United Arab Emirates Managed Infrastructure Services Market Revenue (Million) Forecast, by Application 2019 & 2032
- Table 48: Saudi Arabia Managed Infrastructure Services Market Revenue (Million) Forecast, by Application 2019 & 2032
- Table 49: South Africa Managed Infrastructure Services Market Revenue (Million) Forecast, by Application 2019 & 2032
- Table 50: Rest of Middle East and Africa Managed Infrastructure Services Market Revenue (Million) Forecast, by Application 2019 & 2032
- Table 51: Global Managed Infrastructure Services Market Revenue Million Forecast, by Deployment Type 2019 & 2032
- Table 52: Global Managed Infrastructure Services Market Revenue Million Forecast, by Services Type 2019 & 2032
- Table 53: Global Managed Infrastructure Services Market Revenue Million Forecast, by End User 2019 & 2032
- Table 54: Global Managed Infrastructure Services Market Revenue Million Forecast, by Country 2019 & 2032
- Table 55: United States Managed Infrastructure Services Market Revenue (Million) Forecast, by Application 2019 & 2032
- Table 56: Canada Managed Infrastructure Services Market Revenue (Million) Forecast, by Application 2019 & 2032
- Table 57: Global Managed Infrastructure Services Market Revenue Million Forecast, by Deployment Type 2019 & 2032
- Table 58: Global Managed Infrastructure Services Market Revenue Million Forecast, by Services Type 2019 & 2032
- Table 59: Global Managed Infrastructure Services Market Revenue Million Forecast, by End User 2019 & 2032
- Table 60: Global Managed Infrastructure Services Market Revenue Million Forecast, by Country 2019 & 2032
- Table 61: Germany Managed Infrastructure Services Market Revenue (Million) Forecast, by Application 2019 & 2032
- Table 62: UK Managed Infrastructure Services Market Revenue (Million) Forecast, by Application 2019 & 2032
- Table 63: France Managed Infrastructure Services Market Revenue (Million) Forecast, by Application 2019 & 2032
- Table 64: Spain Managed Infrastructure Services Market Revenue (Million) Forecast, by Application 2019 & 2032
- Table 65: Rest of Europe Managed Infrastructure Services Market Revenue (Million) Forecast, by Application 2019 & 2032
- Table 66: Global Managed Infrastructure Services Market Revenue Million Forecast, by Deployment Type 2019 & 2032
- Table 67: Global Managed Infrastructure Services Market Revenue Million Forecast, by Services Type 2019 & 2032
- Table 68: Global Managed Infrastructure Services Market Revenue Million Forecast, by End User 2019 & 2032
- Table 69: Global Managed Infrastructure Services Market Revenue Million Forecast, by Country 2019 & 2032
- Table 70: China Managed Infrastructure Services Market Revenue (Million) Forecast, by Application 2019 & 2032
- Table 71: Japan Managed Infrastructure Services Market Revenue (Million) Forecast, by Application 2019 & 2032
- Table 72: India Managed Infrastructure Services Market Revenue (Million) Forecast, by Application 2019 & 2032
- Table 73: Australia Managed Infrastructure Services Market Revenue (Million) Forecast, by Application 2019 & 2032
- Table 74: Rest of Asia Pacific Managed Infrastructure Services Market Revenue (Million) Forecast, by Application 2019 & 2032
- Table 75: Global Managed Infrastructure Services Market Revenue Million Forecast, by Deployment Type 2019 & 2032
- Table 76: Global Managed Infrastructure Services Market Revenue Million Forecast, by Services Type 2019 & 2032
- Table 77: Global Managed Infrastructure Services Market Revenue Million Forecast, by End User 2019 & 2032
- Table 78: Global Managed Infrastructure Services Market Revenue Million Forecast, by Country 2019 & 2032
- Table 79: Brazil Managed Infrastructure Services Market Revenue (Million) Forecast, by Application 2019 & 2032
- Table 80: Mexico Managed Infrastructure Services Market Revenue (Million) Forecast, by Application 2019 & 2032
- Table 81: Argentina Managed Infrastructure Services Market Revenue (Million) Forecast, by Application 2019 & 2032
- Table 82: Rest of Latin America Managed Infrastructure Services Market Revenue (Million) Forecast, by Application 2019 & 2032
- Table 83: Global Managed Infrastructure Services Market Revenue Million Forecast, by Deployment Type 2019 & 2032
- Table 84: Global Managed Infrastructure Services Market Revenue Million Forecast, by Services Type 2019 & 2032
- Table 85: Global Managed Infrastructure Services Market Revenue Million Forecast, by End User 2019 & 2032
- Table 86: Global Managed Infrastructure Services Market Revenue Million Forecast, by Country 2019 & 2032
- Table 87: UAE Managed Infrastructure Services Market Revenue (Million) Forecast, by Application 2019 & 2032
- Table 88: Saudi Arabia Managed Infrastructure Services Market Revenue (Million) Forecast, by Application 2019 & 2032
- Table 89: South Africa Managed Infrastructure Services Market Revenue (Million) Forecast, by Application 2019 & 2032
- Table 90: Rest of Middle East and Africa Managed Infrastructure Services Market Revenue (Million) Forecast, by Application 2019 & 2032
Frequently Asked Questions
1. What is the projected Compound Annual Growth Rate (CAGR) of the Managed Infrastructure Services Market?
The projected CAGR is approximately 10.22%.
2. Which companies are prominent players in the Managed Infrastructure Services Market?
Key companies in the market include Ricoh Company Ltd, Canon Inc, TCS Limited, IBM Corporation, Xerox Corporation, Toshiba Corporation, Fujitsu Ltd, Alcatel-Lucent SA (Nokia Corporation), Hewlett Packard Enterprise, Lexmark International Inc, Cisco Systems Inc, Verizon Communications Inc, Microsoft Corporation, Deutsche Telekom AG, Dell Technologies Inc, Konica Minolta Inc , Citrix Systems Inc.
3. What are the main segments of the Managed Infrastructure Services Market?
The market segments include Deployment Type, Services Type, End User.
4. Can you provide details about the market size?
The market size is estimated to be USD 117.17 Million as of 2022.
5. What are some drivers contributing to market growth?
Increasing use of Cloud Managed Infrastructure Services; Technological Proliferation and Advancement of Cloud Based Technology Boosting the Demand; Improved cost and Operational Efficiency and Update of Outdated Hardware.
6. What are the notable trends driving market growth?
The Cloud Segment is Expected to Exhibit the Highest Growth.
7. Are there any restraints impacting market growth?
Declining Profit Margins and Integration and Reliability Concerns.
8. Can you provide examples of recent developments in the market?
September 2023: Cloud4C, a global application-focused cloud-managed services provider, achieved the APAC region's Google Cloud Specialization for Infrastructure Services. As a result, the business gained significant experience in various Google Cloud products, solutions, and industries and became a Specialized Partner for the firm. This demonstrates Cloud4C's extensive technical proficiency in offering fully managed infrastructure modernization and wider digital transformation solutions driven by Google Cloud to APAC enterprises.
9. What pricing options are available for accessing the report?
Pricing options include single-user, multi-user, and enterprise licenses priced at USD 4750, USD 5250, and USD 8750 respectively.
10. Is the market size provided in terms of value or volume?
The market size is provided in terms of value, measured in Million.
11. Are there any specific market keywords associated with the report?
Yes, the market keyword associated with the report is "Managed Infrastructure Services Market," which aids in identifying and referencing the specific market segment covered.
12. How do I determine which pricing option suits my needs best?
The pricing options vary based on user requirements and access needs. Individual users may opt for single-user licenses, while businesses requiring broader access may choose multi-user or enterprise licenses for cost-effective access to the report.
13. Are there any additional resources or data provided in the Managed Infrastructure Services Market report?
While the report offers comprehensive insights, it's advisable to review the specific contents or supplementary materials provided to ascertain if additional resources or data are available.
14. How can I stay updated on further developments or reports in the Managed Infrastructure Services Market?
To stay informed about further developments, trends, and reports in the Managed Infrastructure Services Market, consider subscribing to industry newsletters, following relevant companies and organizations, or regularly checking reputable industry news sources and publications.
Methodology
Step 1 - Identification of Relevant Samples Size from Population Database


Step 2 - Approaches for Defining Global Market Size (Value, Volume* & Price*)

Note*: In applicable scenarios
Step 3 - Data Sources
Primary Research
- Web Analytics
- Survey Reports
- Research Institute
- Latest Research Reports
- Opinion Leaders
Secondary Research
- Annual Reports
- White Paper
- Latest Press Release
- Industry Association
- Paid Database
- Investor Presentations

Step 4 - Data Triangulation
Involves using different sources of information in order to increase the validity of a study
These sources are likely to be stakeholders in a program - participants, other researchers, program staff, other community members, and so on.
Then we put all data in single framework & apply various statistical tools to find out the dynamic on the market.
During the analysis stage, feedback from the stakeholder groups would be compared to determine areas of agreement as well as areas of divergence


